Recall that a report is a database object that displays the fields and records from a table or a query in an easy-to-read format suitable for printing. Reports are created to summarize information in a database in a professional-looking manner.
The purpose of the Fundraiser database is to see how much money is raised for this years charity fundraising event at Lake Michigan City College. Each club competes to raise the most money. Based on the data that has been collected, James Smith would like a report that shows how much money has been collected for each club by each student.
|
[Page 1083] |
1. | On the Objects bar, click Queries, and then double-click Pledges by Club to open this query. Compare your screen with Figure 3.34.
Figure 3.34.

This query shows the pledges made to each club, the name of the student who collected the pledge, and the name of the donor. In this format, there is duplication of some information, such as the students names and the club names. Using a report, you can group information so that it is easier to read and understand.
|
2. | Close  the query window, and then on the Objects bar, click Reports. To the right of the Objects bar, double-click the command Create report by using wizard. the query window, and then on the Objects bar, click Reports. To the right of the Objects bar, double-click the command Create report by using wizard.
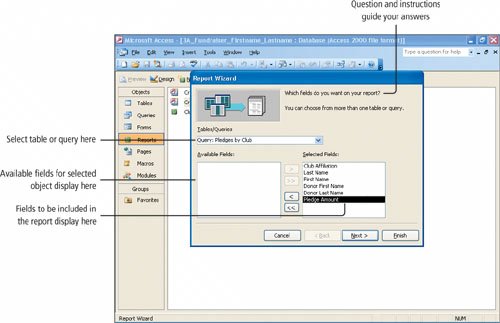
The Report Wizard displays with its first question. Here you select the table or query from which you want to get information, and then select the fields that you want to include in the report. You can also choose from more than one table or query.
|
| |
3. | Click the Tables/Queries arrow, and then click Query: Pledges by Club. Click the All Fields button  to move all of the fields to the Selected Fields list on the right. Compare your screen with Figure 3.35, and then click Next. to move all of the fields to the Selected Fields list on the right. Compare your screen with Figure 3.35, and then click Next.
[Page 1084]
Figure 3.35.
The Report Wizard displays its second question. Here you decide how you want to group the information. The box on the right is a preview of how the data will be organized.
|
4. | With Club Affiliation selected, click the One Field button  . .
The preview on the right displays the Club Affiliation in a separate box at the top of the graphic. Grouping data helps you organize and summarize the data in your report. Grouping data in a report places all of the records that have the same data in a field together as a groupin this instance, each club will display as a group.
|
| |
5. | Click Next, and then compare your screen with Figure 3.36.
Figure 3.36.
(This item is displayed on page 1085 in the print version)
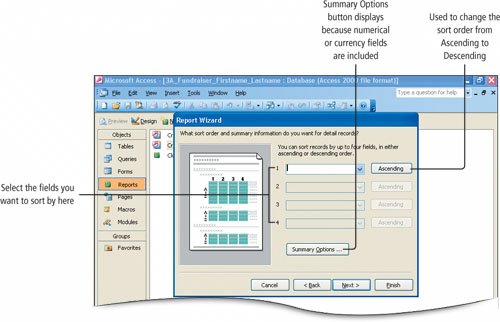
Here you decide how you want to sort and summarize the information. You can sort on up to four fields. The Summary Options button displays because the data is grouped and contains numerical or currency data.
|
|
[Page 1085] |
6. | In box 1 on the right, click the arrow, and then click Last Name.
This action will cause the records in the report to be sorted alphabetically by the students Last Name within the grouping option specified, which is Club Affiliation. Sorting records in a report presents a more organized report.
|
| |
7. | Click the Summary Options button, and then compare your screen with Figure 3.37.
Figure 3.37.
(This item is displayed on page 1086 in the print version)
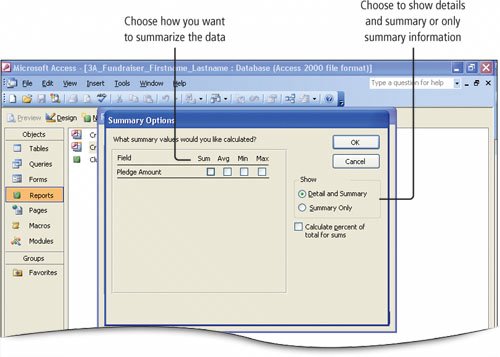
The Summary Options dialog box displays. Here you can choose to display only summary information or to display both detailseach recordand the summary information. The Pledge Amount field can be summarized by selecting one of the four options displayedSum, Avg, Min, or Max.
|
|
[Page 1086] |
8. | To the right of Pledge Amount, select the Sum check box. Under Show, be sure the Detail and Summary option button is selected, and then click OK. Click Next.
Here you select the layout and the page orientation. The box on the left displays a preview of the currently selected layout.
|
9. | Click each Layout option button and view the options, and then click the Stepped option button to select it as the layout for your report. On the right side of the dialog box, under Orientation, be sure Portrait is selected, and at the bottom be sure the Adjust the field width so all fields fit on a page check box is selected.
|
10. | Click Next. In the displayed list of styles, click Formal. Notice the preview to the left, and then click Soft Gray to view its preview. Click to view each of the remaining styles, and then click Corporate.
|
11. | With Corporate selected as the style, click the Next button. In the What title do you want for your report? text box, accept the default name Pledges by Club by clicking the Finish button.
The report is named and displays in Print Preview. This step also saves the report with the name that you entered as the report title.
|
| |
12. | Use the vertical scroll bar to examine the data in the report and compare your screen with Figure 3.38.
Figure 3.38.
(This item is displayed on page 1087 in the print version)
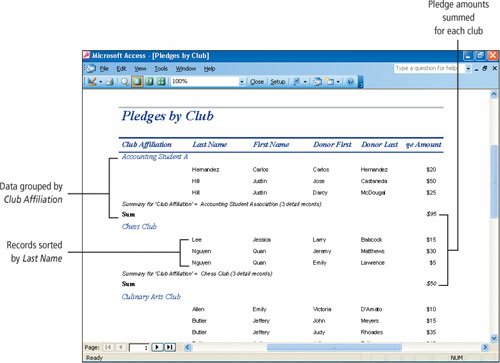
Each of the specifications you defined in the Report Wizard is reflected in the Print Preview of the report. The data is grouped by Club Affiliation and the names of the students within each club grouping are alphabetized. The amount collected by each club is summarized and a Sum displays at the end of the grouping. For example, the Chess Club gathered a total of $50 in pledges.
|
There are various methods you can use to create a form or a report. You can start on the Forms or Reports object and use one of the displayed commands. You can also click the New button, and then select from the methods listed in the New Form or New Report dialog box. Here you have more choices for creating your object, including some specialized designs that you would not otherwise see. You can also start by clicking the table or query that you want to use as the basis for your form or report and then click the New Objects button arrow. The displayed list offers AutoForm or AutoReport options which are the quickest method for creating a simple form or report that includes all fields but very limited formatting. Using the Form Wizard or Report Wizard offers the best combination of design control and assistance. After your object is created, you can always modify it in the Design view.
