Measuring and Managing E-Business Initiatives Through the Balanced Scorecard
Wim Van Grembergen
University of Antwerp, Belgium
Isabelle Amelinckx
University of Antwerp, Belgium
Copyright 2004, Idea Group Inc. Copying or distributing in print or electronic forms without written permission of Idea Group Inc. is prohibited.
Abstract
The Balanced Scorecard (BSC) initially developed by Kaplan and Norton is a performance measurement system that supplements traditional financial measures with the criteria that measure performance from three additional perspectives: customer perspective, internal business perspective, and innovation and learning perspective. In recent years, the Balanced Scorecard has been applied to information technology in order to ensure that IT is fairly evaluated. The proposed methodology can also be applied to e-business initiatives. In this chapter, it is illustrated how the BSC can be used to measure and manage e-business initiatives. A generic e-business Balanced Scorecard is proposed and its development and implementation is discussed.
Introduction
As we enter the new millennium, the internet-based way of doing business is certainly going to change whole industries and markets and will therefore have a great impact on consumers and businesses. Electronic business (e-business) can be described as the process of buying and selling or the exchanging of products, services, and information; generating demand for them through marketing and advertising; servicing customers; collaborating with business partners; and conducting electronic transactions within an organization via computer networks including the internet (Turban et al., 2000). Similar definitions exist (see e.g., Hartman et al., 2000): "An e-business initiative is any internet initiative — tactical or strategic — that transforms business relationships, whether those relationships are business-to-consumer, business-to-business, intra-business or consumer-to-consumer." Electronic business will change all aspects of our lives — how we work, play, learn and shop. It will transform our economic infrastructure in the sense that new methods of supply, distribution, marketing, service, and management will emerge. E-business will improve business performance through low cost and open connectivity by introduction of new technologies in the value chain and connecting value chains across businesses in order to improve service, reduce costs, open new channels, and transform the competitive landscape.
Companies are becoming increasingly aware of the many potential benefits provided by e-business. Some of the e-business potential benefits for organizations are (Turban et al., 2000; Amor, 2000):
- supporting Business Process Reengineering (BPR) efforts;
- expanding the marketplace;
- strengthening the relationships with customers and suppliers;
- reducing costs through the deployment of electronic internal and external business processes;
- lowering telecommunications costs as a result of the inexpensive internet infrastructure.
Because of the intangible nature of some of these benefits, it is difficult to measure the contribution of e-business initiatives to business performance and to manage these initiatives to ensure that real profits are realized (Giaglis et al., 1999). In practice, when starting an e-business initiative, organizations focus too much on the technology (Rifkin & Kurtzman, 2002; Barua et al., 2001). An example is the Belgian online grocery store Ready.be that used its web storefront to take customers' orders. It relied heavily on manual processes to fulfill the orders. In less than two years, Ready.be set up a centralized warehouse and fifty points of distribution where customers could pick up their purchases they made through the internet. Besides this, Ready.be renewed its web site three times and even started a WAP (Wireless Application Protocol) project that would allow customers to mail their shopping list via their mobile phone. In the year 2000 the losses of Ready.be amounted to 12 million Euros and the online grocery had to stop its business. This mini case shows that too much attention was paid to the technology and that this e-business initiative should have been monitored. In the grocery case, the use of a monitoring instrument could easily have shown that too many costs were made that could be avoided by just using the existing warehouses and shops of their traditional grocery chain and by not starting yet the WAP project (this pervasive computing project was clearly technically driven). Therefore, in this chapter a recent developed monitoring instrument, the Balanced Scorecard, will be presented and applied to e-business initiatives.
The need for measuring e-business performance is confirmed by a study conducted by the consulting firm Accenture (formerly Andersen Consulting) and the Cranfield School of Management (Adams et al., 2001). Senior managers from more than 70 bricks-and-mortar, clicks-and-mortar, and dot.com firms were surveyed regarding their performance management systems. One of the major findings is that dot.coms appear to measure more than the two other types of businesses, but that may be misguided because numerous publications reveal that e-businesses are failing to deliver the expected service and even go bankrupt. We agree with one of the study's conclusions that "even if they do have the data, they would appear to be failing to act on it." Another observation is that too many dotcoms are "obsessed with measurement rather than management." The deployment of an e-business Balanced Scorecard may overcome these problems if it is implemented as a measurement and management system.
IT Evaluation
Evaluation is often considered as a process to diagnose malfunctions and to suggest appropriate planning and treatment by providing feedback information and contributing to organizational planning. It is generally aimed at the identification and quantification of costs and benefits. There are different monitoring instruments available and these are dependent on the features of the costs and benefits.
When both costs and benefits can be easily quantified and assigned a monetary value, traditional financial performance measures work well. These "hard" evaluation techniques draw upon the traditional skills of the financial analyst. Whatever features are looked at, they have to be given numeric values. Figure 1 shows an overview of the most popular IT evaluation techniques.
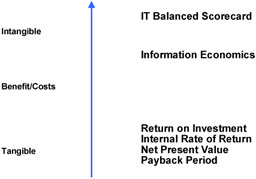
Figure 1: IT Evaluation
- Return On Investment (ROI): Return on investment is the ratio of average annual net income of the project divided by the internal investment in the project. To find the ROI, first the average net benefit has to be calculated. This net benefit is divided by the total initial investment to arrive at ROI. The weakness of ROI is that it can ignore the time value of money.
- Net Present Value (NPV): Evaluating a capital project requires that the cost of an investment be compared with the net cash inflows that occur many years later. But these two kinds of inflows are not directly comparable because of the time value of money. Thus, to compare the investment with future savings, you need to discount the earnings to their present value and then calculate the net present value of the investment. To calculate the NPV, the opportunity cost of capital is used as discount rate. The net present value is the amount of money an investment is worth, taking into account its costs, earnings and other time value of money.
- Internal Rate of Return (IRR): The IRR is defined as the rate of return or profit that an investment is expected to earn. It is a variation of the NPV method but calculated using an interest rate that will cause the NPV to equal zero. This is also called the yield of the investment and is often used to define a hurdle rate. The IRR intends to make projects more comparable by showing what interest would have to be received on the sum of the investment to get the same return offered.
- Payback Method: The payback method is a measure of the time required to pay back the initial investment of a project. It is the period between the moment that an IT investment gets funded and the moment that the total sum of the investment is recovered through the net incoming cash flows. A short payback period reduces the risk of the project and many organizations will select projects on the basis of short payback periods, even at the cost of lower net benefit levels. The payback period calculations are easy and hence popular but they suffer from the fact that they take no account of the time value of money, the amount of cash flow after the payback period, the disposal value (usually zero with computer systems) and the profitability of the investment.
Because they need monetary values for benefits and costs, the traditional financial performance measures such as ROI, NPV, IRR, and the payback method are problematic in measuring IT and e-business investments. Multi-criteria methods may solve this problem because they account for tangibles as well as for intangible impacts (Berghout & Renkema, 2001). One of the best known multi-criteria methods is Information Economics (Parker, 1996). This method uses an extended form of the ROI, which includes an assessment of intangible elements. The greatest weakness of this technique is the fact that it is a scoring technique with the difficulty that one has to agree on scores (Robson, 2001).
The Information Economics method is a scoring technique whereby the value and risk categories are attributed scores between 0 and 5. For a value category, 0 means "no positive contribution" and a 5 refers to "a large positive contribution". For a risk category, 0 means "no risk" and a 5 means "large risk". Each of these categories is assigned a weight. By adding the weighted scores of the value categories and subtracting the weighted scores of the risk categories, one can calculate the weighted scores of each IT project. The categories of Table 1 have an indicative meaning, so when applying this method one has to adapt these categories to his own needs and specifications.
|
Traditional ROI(+) |
||
|
+ value linking (+) + value restructuring (+) |
+ value acceleration (+) + innovation (+) |
|
|
= Adjusted ROI |
+ Business Value |
+ IT Value |
|
|
|
|
- Business Risk |
- IT Risk |
|
|
|
|
|
= VALUE (business contribution) |
||
Although most categories of Table 1 are clear, a few of them might require some explanation. Value linking incorporates, e.g., interest savings due to an accelerated cashing of invoices realized through electronic payment. Value acceleration contains the additional cash flows due to reduced time scale for e-business operations. Value restructuring refers to the efficiency and effectiveness of the employees. Innovation valuation incorporates the additional cash flows arising from the innovating aspects of the e-business investment. Strategic IT architecture assesses the degree of value to which the project fits into the e-business plan. Business strategy risk and IT strategy risk respectively refer to the degree of risk in terms of how well the company or IT department succeeds in achieving its strategic objectives. Definitional uncertainty indicates the degree of risk in terms of how clearly the functional requirements and specifications have been agreed upon. The bigger the change, the bigger the risk and the larger the negative score for the project. Technical risk assesses the skills, hardware and software innovations required by the project to attach a score to the uncertainty. The more innovative, the bigger the risk and the bigger the negative score for the project.
Although Information Economics do consider non-quantifiable elements such as flexibility, however, no rational economic value can be assigned.
The solution for our measurement problem seems to be the Balanced Scorecard technique developed in the 90s, which is a measurement system that also takes into account intangible elements. Moreover, it enables businesses to derive strategies based on measurement and follow-up. In recent years, the BSC has also been applied to information technology.
Balanced Scorecard (BSC)
In the 1990s, Kaplan and Norton developed the Balanced Scorecard. Their idea is that the evaluation of a company should not be restricted to the traditional financial performance measures but should be supplemented with measures concerning customer satisfaction, internal processes, and the ability to innovate. Results achieved within the additional perspectives should assure future financial results (Kaplan & Norton, 1992, 1993, 1996a, 1996b).
Kaplan and Norton propose a three layered structure for the four perspectives: mission (to become the customers' most preferred supplier), objectives (to provide the customers with new products), and measures (percentage of turnover generated by new products). To put the BSC to work, companies should translate each of the perspectives into corresponding metrics and measures that assess the current situation. These assessments have to be repeated periodically and have to be confronted with the goals that have to be set beforehand. At first, the BSC was used as a performance measurement system and a planning and control device. Later on, some companies moved beyond this early vision of the scorecard. They discovered that the measures on a Balanced Scorecard can be used as the cornerstone of a management system that communicates strategy, aligns individuals and teams to the strategy, establishes long-term strategic targets, aligns initiatives, allocates long- and short term resources and finally, provides feedback and learning about the strategy (Kaplan & Norton, 1992, 1993, 1996a, 1996b).
Generic IT Balanced Scorecard
Different market situations, product strategies, business units, and competitive environments require different scorecards to fit their mission, strategy, technology, and culture. The general BSC-framework can be translated to the more specific needs of the monitoring and evaluation of the IT function, and recently the IT BSC has emerged in practice (Graeser et al., 1998; Van Grembergen & Saull, 2001). In Van Grembergen and Van Bruggen (1997) and Van Grembergen and Timmerman (1998) a generic IT scorecard is proposed consisting of four perspectives: business contribution, user orientation, operational excellence, and future orientation (Table 2). This IT scorecard differs from the company-wide BSC because it is a departmental scorecard for an internal service supplier (IT): the customers are the computer users, the business contribution is to be considered from management's point of view, the internal processes under consideration are the IT processes (systems development and operations), and the ability to innovate is measuring the use of new technologies and the human IT resources.
|
USER ORIENTATION |
BUSINESS CONTRIBUTION |
|
How do the users view the IT department? |
How does management view the IT department? |
|
Mission |
Mission |
|
To be the preferred supplier of information systems and to exploit business opportunities maximally through information technology |
To obtain a reasonable business contribution of investment inIT |
|
Objectives
|
Objectives
|
|
OPERATIONAL EXCELLENCE |
FUTURE ORIENTATION |
|
How effective and efficient are the IT processes? |
Is IT positioned to meet future needs? |
|
Mission |
Mission |
|
To deliver efficiently IT products and services |
To develop opportunities to answer future challenges |
|
Objectives
|
Objectives
|
A detailed version of the IT BSC model is depicted in Table 2.
Generic E Business Balanced Scorecard
The costs that go with the development, implementation, and the maintenance of an e-business initiative can be very high. Therefore, e-business projects, like any other projects, need to be evaluated and monitored to find out if the project delivers what it was supposed to deliver (Giaglis et al., 1999). This means that performance measurement is one of the most important activities that occur once an e-business initiative is started. However, many of the e-business benefits such as better customer service, increased responsiveness, and faster deliveries are intangibles that are difficult to translate into monetary benefits. Raisinghani (2001) reports that three-fourths of information systems investments, ranging from data centers to web sites, offer no calculable business value.
Within an IT scorecard, we certainly will have some contribution measures regarding e-business initiatives, but within the e-business scorecard we will have more detailed and in-depth e-business initiative measures that will allow us to monitor and manage these emerging initiatives. Similar to Rosemann (2001) who applies the BSC to ERP (Enterprise Resource Planning) projects, the scorecard concepts are applied to another type of projects, in casu e-business projects (see also, e.g., Hasan & Tibbits, 2000).
In Table 3 a generic e-business Balanced Scorecard is proposed. The Customer Orientation perspective represents the evaluation of the consumer and business clients of the web site and in this way also the supporting back office systems. The Operational Excellence perspective represents the e-business processes employed to deliver the demanded services and the e-business applications. The Future Orientation perspective represents the human and technology resources needed by the e-business initiative to deliver its services over time. The Business Contribution perspective captures the business value created from the e-business investments. In building this generic e-business scorecard, performance measures defined in Van Grembergen and Saull (2001), Rosemann (2001), and Chaffey et al. (2000) are integrated into this scorecard.
|
CUSTOMER ORIENTATION |
BUSINESS CONTRIBUTION |
|
What is the company's success in acquiring and retaining customers through the web site? |
How should the e-business initiative appear to the Board in order to be considered as significant contribution to company success? |
|
Mission |
Mission |
|
To be the preferred supplier through the Internet |
To enable and contribute to the achievement of business strategies through effective application of e-business |
|
Objectives
|
Objectives
|
|
OPERATIONAL EXCELLENCE |
FUTURE ORIENTATION |
|
At which services and processes must the e-business application excel to satisfy the stakeholders and customers? |
How will IT develop the ability to change and improve in order to better achieve the company's strategy through e-business application? |
|
Mission |
Mission |
|
To deliver timely and effective e-business services at targeted service levels |
To enable and contribute to the achievement of business strategies through effective application of e-business |
|
Objectives
|
Objectives
|
Measures for Business Contribution
The ultimate goal of e-business initiatives, as any other IT initiative, is to satisfy the Board of Directors and consequently the shareholders. Surprisingly, the Adams' survey (2001) revealed that only 56% of the dot.com companies tracked shareholder satisfaction, which is low if one takes into consideration their reliance on the stock exchange and investors (for the bricks-and-mortar and the clicks-and-mortar firms percentages were even lower, with respectively 36% and 44%). We suppose that this is caused by the fact that many e-business initiatives are technically driven and that not always is the business evaluation taken too seriously. Therefore, in a Balanced Scorecard, the business contribution perspective is as important — not to say the most important — as the other three perspectives. Motivated, trained, and experienced IT employees (future orientation) should improve the delivery of excellent e-business processes and applications (operational excellence), that in turn should enhance customer satisfaction (customer orientation), and finally should by all means result in financial profits (business contribution).
The key issues, as depicted by Table 4, are e-business strategic plan achievements, business value of e-business initiatives, and compliance with budget.
|
E-Business strategic plan achievements
Business value of E-business initiatives
Compliance with budget
|
E-Business Strategic Plan Achievements
E-business initiatives often are deployed on the basis of a step-by-step approach. A well-known Gartner-model describes four levels of e-business: (1) the publishing level, focusing on showing information of the company on a web site, (2) the prospecting level with customer oriented information, (3) the business integration level, which is transaction-centric and can be defined as e-commerce, and (4) the business transformation level, which is the mature level of e-business that includes supplier and customer integration. Completion of steps of the e-business project plan will represent this evaluation item.
Business Value of E-Business Initiatives
The business value of e-business initiatives shows how the e-business initiatives are affecting the performance of the whole business. It gives an idea of the contribution of the initiative measured through the standard financial measures that are used to determine the health of the business. Typical measures are the profitability of the web site that can be defined as the direct revenue of the web site minus the operational costs of the site, and a combination of Return on Investment and Information Economics to capture the tangible and intangible benefits (cf., paragraphs on IT evaluation).
The direct online contribution measures the extent to which the internet contributes to sales and refers to the sales that are actually placed on the web site. It does not include the amount of revenue indirectly achieved due to the internet influencing buying decisions, although the internet has also in this case made a real contribution to sales (Lee, 1998).
Operational cost reductions, cost reductions of acquiring a new customer, cost reductions of customer relationship management, and cost reductions of promotional material are measures that explain how the web site is helping to reduce costs. Cost reductions of promotional material, e.g., are lower printing and distribution costs. In direct mail, money has to be spent for every additional person that a company wants to reach, whereas with a web site there is no extra cost. E-business is supporting the customer on an ongoing basis through interactive online user groups, online technical support, frequently asked questions and answers, newsletters, and online renewal and subscriptions. Therefore, the cost of supporting customers can be reduced because some of these functions can be partly or totally automated through specific e-business software such as customer relationship management products (e.g., Siebel), customer-facing e-mail products to manage large volumes of incoming e-mails, collaborative filtering packages to derive what products or services individuals will be likely to purchase based on their similarity to other individuals or groups, etc.
Compliance with Budget
An e-business initiative represents a capital investment that entails expenses as well as revenues. The start of an e-business initiative is also the initiation of a permanent commitment to resource demands because of ongoing expenses that are often difficult to predict. Therefore, a financial evaluation is needed that compares the actual costs with the budgeted expenses. Important cost categories include the costs associated with the development and — not to forget — the maintenance of a web site and its back office systems.
Measures for Customer Orientation
The customer orientation perspective evaluates the performance of the e-business initiative from the viewpoint of the business and/or consumer clients (Table 5). The measures in this perspective describe the company's success in acquiring and retaining customers and sales. This perspective also represents customer satisfaction and effective internet marketing that both are performance drivers for outcome measures regarding acquiring and retaining clients.
|
Customer satisfaction
Customer retention
Acquiring new customers
Effective internet marketing
|
Customer Satisfaction
Customer satisfaction is the feeling that a product or service meets the customer expectations and determines whether a customer will repeat his or her web purchases or not. Since service quality is an antecedent of user satisfaction in web environments, customer satisfaction will be enhanced by increasing customer service (Zeithaml et al., 1993). Typical measures for customer satisfaction are web site satisfaction scores calculated on the basis of offline or online surveys, and the number of customer complaints eventually compared to the resolutions within a reasonable time. Customer satisfaction is perceived by senior managers involved in e-business initiatives as an important measure. All respondents of the Adams et al. (2001) survey said that they measured customer satisfaction or that they should measure it.
Customer Retention
Besides measuring the customer satisfaction, it is also crucial to know how to increase the customer retention rate — the degree to which a customer will stay with a specific vendor or brand. After all, there is no point having fairly satisfied customers who do not come back to buy again or who are not prepared to recommend the product or service to others. Customers will be likely to return to the merchant's web site if they have had good experience with the firm in the past. Relationships and repeat business happen when customers feel a connection to a site and believe that the site is their best option for doing business. Connection to a site is a function of web design, as customers see and interact with a company via the web interface. Belief in a site or in a company's ability to fulfill its commitments is a function of service design. Both are required for relationships and repeat business. Furthermore, by retaining customers, a company can increase its profits because customers will buy more and sales will grow. In the end, a company's market position is strengthened because customers are kept away from the competitors. Besides this, it is important that they have developed trust. Trust can be developed through reputation, relationship, and knowledge of the other party's business (Stewart, 1998). Measurements are retention rates of online clients and loyalty measures such as percent of online customers placing repeat orders.
Acquiring New Customers
Acquiring new customers is measured through the number of new customers and/ or new leads generated via the web site. A more general measure is the number of sales generated by the web site eventually compared to the usual business.
Effective Internet Marketing
Internet marketing measures indicate the effectiveness of internet marketing activities in meeting customer, business, and marketing objectives and can be collected online or offline. Although traditional offline metrics are still important, online web metrics are more often used for the assessment of internet marketing effectiveness. Online web metrics are those that are collected automatically on a web server and enable marketers to detect which parts of their web sites are working well and which are not. Before some examples of online metrics will be given, some remarks have to be made. Measuring and tracking visits and usage of commercial web sites and measuring consumer response to advertisements are hindered by the lack of standardization. Moreover, the complexity of the medium hampers the standardization process. In addition to it, most measures try to prove that a web site is successful when it attracts large numbers of visitors, while it is not so much the quantity of people visiting your web site as the quality of their experience that is important (Schwartz, 1998).
An example of an online metric is a hit. A hit is each element, including graphics, text, and interactive items of a requested page recorded by the web server. A single page with multiple graphics can be counted as multiple hits since each graphic is counted as a separate hit. Although the term hit is frequently used to indicate how successful a particular site is, it is misleading because a hit includes all units of content sent by a web server when a particular URL is assessed. Merely hitting on a site does not mean that the user did anything with the information. A simple count of the number of web browsers requesting a data transfer from a web server is not enough to explain the browser's interest because it does not account for the user's ability to access information, how effectively information is organized and structured for comprehension, or the appropriateness of the information to the user. A page impression is a more reliable measure and equals the number of times a particular web page has been presented to visitors. When customers visit a site, they can visit the home page, browse through the site or visit many pages. When the marketer is not interested in this distinction a useful measure may be the number of site visits. A site visit is a series of consecutive web page requests from a visitor to a web site. Measuring the number of site visits can be misleading. A user might enter a new site, then go to lunch leaving his browser on this site to continue clicking around the site when he returns from lunch one hour later. Surprisingly, this would be counted as two visits because there was a period of 30 minutes of inactivity between clicks. Another problem in counting visits is when a user enters a site, and clicks on a link which takes him away for a few minutes but then returns to the site. This will also be counted as two visits even though it might make more sense to count it as one. To gauge performance it is also possible to use the number of visitors. A visitor is a unique individual who visits a web site (Alpar et al., 2001). The primary problem in identifying unique visitors is that the web logs only the internet protocol address of the user visiting a site. The problem with IP addresses is that corporate firewalls and internet service providers may allow multiple users to share a single IP address or may assign the same user a different IP address every time he or she connects to the web (Amor, 2000). None of the measures mentioned are able to identify the individual user. Requiring a user to login with a password or using cookies are means of identification that can overcome this. Web site self-registration can be used to identify the individual user and to collect the users' perception of the web site, the company, and its products and services (Chaffey et al., 2000).
Measures for Operational Excellence
The operational excellence perspective (Table 6) focuses on the internal conditions for satisfying the customer expectations as mentioned above. The fulfillment process measures the back office processes, whereas the other measures availability, improvement of systems development and security, represent the IT processes.
|
Fulfillment process
Availability of the e-business system
Improvement of systems development
Security and safety
|
Fulfillment Process
The fulfillment process measures are very important because it may happen that the back office systems are not adapted to the new e-conomy requirements and/or are not integrated with the front office. Online clients, by the nature of the medium, expect almost immediate delivery of goods and services that can be delayed by stock-outs, shipping errors, and processing problems. Major critical success factors are: a full integration between front and back office and sufficient stock levels.
Availability of the E-Business system
The availability of the e-business systems is crucial. The 24 hours a day, all year round availability is necessary for remaining competitive because companies have a market reach beyond national boundaries or offer e-commerce not restricted to limited opening hours, because customers no longer want to be tied to these opening hours of stores and bank branch offices. Therefore, average downtime and maximum downtime must be restricted to a minimum.
Improvement of Systems Development
In relation to the measurement of the e-business systems development process, significant use can be made of the Capability Maturity Model of the Software Engineering Institute (Paulk et al., 1993). This model defines five maturity levels for systems development that can be easily adapted to the more specific e-business development process. A reasonable level is Level Three which can be defined as (adapted for e-business): The e-business systems development process is documented, standardized, and integrated into a standard software process for the organization. All e-business initiatives use an approved, tailored version of the organization's standard software process for developing and maintaining e-business software. Needless to say that in practice, because of the time pressure on delivering e-business systems, most e-business developments do not reach this level.
Security and Safety
Almost every day publications claim that people's willingness to engage in online transactions requires a perception of security. So, one of the main e-business challenges is to guarantee security and safety, and focus must be on the occurrence and management of major e-business incidents and the responses to audit reports on the security of e-business systems.
Measures for Future Orientation
The future orientation perspective (Table 7) examines the company's ability to effectively make use of as well as to improve the e-business project functions nowadays and in the future. Because this ability depends on the know-how and experience of personnel, IT employee-centered measures (e-business expertise of developers) such as number of training days, expertise of developers, and their knowledge of new e-business solutions are required. Education and training, and involvement in new e-business technologies are important motivators for IT employees. In light of the shortage of these professionals, it is important to have a follow-up of these measures. Surprisingly, the Adams' (2001) survey shows that only 50% of the dotcoms claim to measure employee satisfaction.
|
E-business expertise of developers
E-business staff management effectiveness
Independence of consultants
Reliability of software vendors
|
Human resources may be limited, which is often the reason for not delivering e-business systems within time and not delivering the quality that is required. The e-business staff management effectiveness measures capture the workload per developer, their rate of absence leave that may indicate problems if this rate is too high, developer backup for the e-business applications, and the satisfaction of the project members and related IT staff.
Other useful measures are these relating to the dependence on external consultants. E-business initiatives are often implemented with the assistance of external consultants. However, companies want a quick transfer of the e-business initiatives' know-how to their own staff in order to reduce the need for expensive consultants and to be able to cope with problems. The evolution over time of the number of consultant days spent within the firm can assess the success of such a transfer.
As most e-business initiatives rely on external software providers, it is essential to monitor them in order to foresee future problems. Relevant measures are their number of releases per year, the functional enhancements within their packages and their number of new customers.
Building an E Business Balanced Scorecard
In building a company-specific e-business Balanced Scorecard, a number of steps need to be followed. First, the concept of the e-business Balanced Scorecard technique has to be presented to senior management, IT management, and e-business project management, and an e-business BSC project team has to be established. Secondly, during the data-gathering phase, information is collected on e-business metrics. The metrics identified have to be specific, measurable, actionable, relevant, and timely (SMART). In this manner, one avoids developing metrics for which accurate or complete data cannot be collected and that lead to actions contrary to the best interests of the business (Chaffey et al., 2000). Thereafter online and offline techniques are introduced to collect metrics. Finally, the organization-specific e-business scorecard, based on the principles of Kaplan and Norton, is developed (Van Grembergen & Timmerman, 1998).
The most important development principle is that an e-business Balanced Scorecard should contain cause-and-effect relationships. The measures selected for the e-business scorecard should be elements in a chain of cause-and-effect relationships. This means that an e-business scorecard needs a good mix of outcomes and performance drivers. While outcome measures reflect the common goals of many strategies as well as similar structures across industries and companies, the performance drivers are the measures that are unique for a particular business unit, or in our case, for an e-business initiative. On the one hand, outcome measures without performance drivers do not indicate how the outcomes are to be achieved. On the other hand, performance drivers without outcome measures may enable the e-business initiative to achieve short term operational improvements but will fail to reveal whether the operational improvements have been translated into expanded business with existing and new customers and enhanced financial performance (Kaplan & Norton, 1992). An example may clarify the difference between outcome measures (sometimes referred to as key goal indicators) and performance drivers (key performance indicators). Improvement of the e-business expertise of the developers (performance driver) may enhance and shorten the delivery of e-business applications (outcome measure). In other words, the developer's experience is an enabler of the fast delivery of e-business applications. This also means that the future orientation and the operational excellence measures are enablers of, respectively, the customer orientation and business contribution goals.
Summary Conclusion
In this chapter, the Balanced Scorecard concepts are applied to e-business initiatives. A generic e-business Balanced Scorecard is developed and presented as a measuring and management instrument. The proposed e-business scorecard consists of four perspectives: the Customer perspective representing the evaluation of the consumer and business clients, the Operational perspective focusing on the business and IT processes, the Future perspective showing the human and technology resources needed to deliver the e-business application, and the Contribution perspective capturing the e-business benefits. It is argued that a monitoring instrument such as the proposed e-business scorecard is a must when building, implementing, and maintaining an e-business system because these initiatives are often too technically managed and are often started without a clear business case.
A major pitfall when introducing and using an e-business Balanced Scorecard is that the focus is too much on measurement and that management fails to act on the performance measures. It is our conjecture that the many e-business initiatives within bricks-and-mortar firms and within dotcoms fail because there is no real monitoring of the e-business initiative. At least, a well-developed performance management system may give signals to senior management that something is wrong and that the e-business strategy has to be reconsidered.
References
Adams, C.,Kapashi, N.,Neely, A., & Marr, B. (2001). Measuring eBusiness performance. Cranfield University School of Management/Accenture. Available online: http://www.accenture.com.
Alpar, P.,Porembski, M., & Pickerodt, S. (2001). Measuring the efficiency of web site traffic generation. International Journal of Electronic Commerce, 6(1), 53–74.
Amor, D. (2000). The E-business revolution: Living and working in an interconnected world. Upper Saddle River, NJ: Prentice Hall.
Barua, A.,Konana, P.,Whinston, A., & Yin, F. (2001). Driving e-business excellence. MIT Sloan Management Review, 43(1), 36–44.
Berghout, E., & Renkema, T. (2001). Methodologies for IT investment evaluation: A review and assessment. In W. Van Grembergen, (Ed.), Information Technology Evaluation Methods and Management (pp. 78–97). Hershey, PA: Idea Group Publishing.
Chaffey, D.,Mayer, R.,Johnston, K., & Ellis-Chadwick, F. (2000). Internet marketing. Harlow: Pearson Education.
Giaglis, G.,Paul, R., & Doukidis, G. (1999). Assessing the impact of electronic commerce on business performance: A simulation experiment. Electronic Markets, 9(1/2), 25–31.
Graeser, V.,Willcocks, L., & Pisanias, N. (1998). Developing the IT scorecard. London: Business Intelligence.
Hartman, A.,Sifonis J., & Kador, J. (2000). Net ready - Strategies for success in the Economy. New York: McGraw-Hill.
Hasan, H., & Tibbits, H. (2000). Strategic management of electronic commerce: An adaption of the Balanced Scorecard. Internet Research, 10(5), 439–450.
Kaplan, R., & Norton, D. (1992). The Balanced Scorecard - Measures that drive performance. Harvard Business Review, 70(1), 71-79.
Kaplan, R., & Norton, D. (1993). Putting the Balanced Scorecard to work. Harvard Business Review, 71(5), 134–142.
Kaplan, R., & Norton, D. (1996a). Linking the Balanced Scorecard to strategy. California Management Review, 39(1), 53–79.
Kaplan, R., & Norton, D. (1996b). The Balanced Scorecard translating strategy into action. Boston, MA: Harvard Business School Press.
Lee, S. (1998). The business value of transaction - based web sites. Proceedings of the 9th Information Resources Management (IRMA) International Conference, Boston (pp. 749-751).
Parker, M. (1996). Strategic transformation and information technology. Upper Saddle River, NJ: Prentice Hall.
Paulk, M.,Curtis, B.,Chrissis, M.B., & Weber, C. (1993). Capability maturity model for software, version 1.1, Technical Report, CMU/SEI-93-TR024, ESC-TR-93-177, Software Engineering Institute.
Raisinghani, M. (2001). A balanced analytic approach to strategic electronic commerce decisions: A framework of the evaluation method. In W. Van Grembergen, (Ed.), Information Technology Evaluation Methods and Management (pp. 185–197). Hershey, PA: Idea Group Publishing.
Rifkin, G., & Kurtzman, J. (2002). Is your e-business plan radical enough? MIT Sloan Management Review, 43(3), 91–95.
Robson, W. (2001). Information value and IS investment. In W. Robson (Ed.), Strategic Management and Information Systems (pp. 347–394). London: Pitman Publishing.
Rosemann, M. (2001). Evaluating the management of enterprise systems with the Balanced Scorecard. In W. Van Grembergen, Information Technology Evaluation Methods and Management (pp. 171–184). Hershey, PA: Idea Group Publishing.
Schwartz, E. (1998). Webeconomics. New York: Broadway Books.
Stewart, T. (1998). The e-business tidal wave. Available online: http://www.deloitte.com/tidalwave/.
Turban, E.,Lee, J., & King, D. (2000). Electronic commerce: A managerial perspective. Upper Saddle River, NJ: Prentice Hall.
Van Grembergen, W., & Saull, R. (2001). Information Technology governance through the Balanced Scorecard. Proceedings of the 34th Hawaii International Conference on System Sciences (HICSS), Maui, Hawaii. CD-ROM.
Van Grembergen, W., & Timmerman, D. (1998). Monitoring the IT process through the Balanced Scorecard. Proceedings of the 9th Information Resources Management (IRMA) International Conference (pp. 105–116). Boston, MA.
Van Grembergen, W., & Van Bruggen, R. (1997). Measuring and improving corporate information technology through the Balanced Scorecard technique. Proceedings of the 4th European Conference on the Evaluation of Information Technology, Delft (pp. 163–171). Delft.
Zeithaml, V.,Berry, L., & Parasuraman, A. (1993). The nature and determinants of customer expectations of service. Journal of the Academy of Marketing Science, 21(Winter), 1–12.
Section I - IT Governance Frameworks
- Structures, Processes and Relational Mechanisms for IT Governance
- Integration Strategies and Tactics for Information Technology Governance
- An Emerging Strategy for E-Business IT Governance
Section II - Performance Management as IT Governance Mechanism
- Assessing Business-IT Alignment Maturity
- Linking the IT Balanced Scorecard to the Business Objectives at a Major Canadian Financial Group
- Measuring and Managing E-Business Initiatives Through the Balanced Scorecard
- A View on Knowledge Management: Utilizing a Balanced Scorecard Methodology for Analyzing Knowledge Metrics
- Measuring ROI in E-Commerce Applications: Analysis to Action
- Technical Issues Related to IT Governance Tactics: Product Metrics, Measurements and Process Control
Section III - Other IT Governance Mechanisms
- Managing IT Functions
- Governing Information Technology Through COBIT
- Governance in IT Outsourcing Partnerships
Section IV - IT Governance in Action
EAN: 2147483647
Pages: 182
