Assessing Business-IT Alignment Maturity
Jerry Luftman
Stevens Institute of Technology, USA
Copyright 2004, Idea Group Inc. Copying or distributing in print or electronic forms without written permission of Idea Group Inc. is prohibited.
Abstract
Strategic alignment focuses on the activities that management performs to achieve cohesive goals across the IT (Information Technology) and other functional organizations (e.g., finance, marketing, H/R, R&D, manufacturing). Therefore, alignment addresses both how IT is in harmony with the business, and how the business should, or could, be in harmony with IT. Alignment evolves into a relationship where the function of IT and other business functions adapt their strategies together. Achieving alignment is evolutionary and dynamic. It requires strong support from senior management, good working relationships, strong leadership, appropriate prioritization, trust, and effective communication, as well as a thorough understanding of the business and technical environments. The strategic alignment maturity assessment provides organizations with a vehicle to evaluate these activities. Knowing the maturity of its strategic choices and alignment practices make it possible for a firm to see where it stands and how it can improve. This chapter discusses an approach for assessing the maturity of the business-IT alignment. Once maturity is understood, an organization can identify opportunities for enhancing the harmonious relationship of business and IT.
Introduction
Business-IT alignment refers to applying IT in an appropriate and timely way, in harmony with business strategies, goals and needs. It has remained a fundamental concern of business and IT executives for more than 15 years. This definition of alignment addresses how:
- IT is aligned with the business
- The business should or could be aligned with IT.
Mature alignment evolves into a relationship where IT and other business functions adapt their strategies together. When discussing business-IT alignment, terms like harmony, linkage, fusion, fit, match, and integration are frequently used synonymously with the term alignment. It does not matter whether one considers business-IT alignment or IT-business alignment; the objective is to ensure that the organizational strategies adapt harmoniously.
The evidence that IT has the power to transform whole industries and markets is strong (e.g., King, 1995; Luftman, 1996; Earl, 1993; Earl, 1996; Luftman et al., 1993; Goff, 1993; Liebs, 1992; Robson, 1994; Luftman, Papp, & Brier, 1999; Luftman & Brier, 1999). Important questions that need to be addressed include the following:
- How can organizations assess alignment?
- How can organizations improve alignment?
- How can organizations achieve mature alignment?
The purpose of this chapter is to present an approach for assessing the maturity of a firm's business-IT alignment. Until now, none was available. The alignment maturity assessment approach described in this chapter provides a comprehensive vehicle for organizations to evaluate business-IT alignment in terms of where they are and what they can do to improve alignment. The maturity assessment applies the previous research that identified enablers/inhibitors to achieving alignment (Luftman, Papp, & Brier, 1995; Luftman & Brier, 1999), and the author's consulting experience that applied the methodology that leverages the most important enablers and inhibitors as building blocks for the evaluation. The maturity assessment also applies concepts included in the popular work done by the Software Engineering Institute (Humphrey, 1988), Keen's reach and range (Keen, 1996) and an evolution of the Nolan and Gibson stages of growth (Nolan, 1979).
Alignment's importance has been well known and well documented since the late 1970s (e.g., McLean & Soden, 1977; IBM, 1981; Mills, 1986; Parker & Benson, 1988; Brancheau & Whetherbe, 1987; Dixon & Little, 1989; Niederman et al., 1991; Chan & Huff, 1993; Henderson & Venkatraman, 1996; Luftman & Brier, 1999). Over the years, it persisted among the top-ranked concerns of business executives. Alignment seems to grow in importance as companies strive to link technology and business in light of dynamic business strategies and continuously evolving technologies (Papp, 1995; Luftman, 1996). Importance aside, what is not clear is how to achieve and sustain this harmony relating business and IT, how to assess the maturity of alignment, and what the impact of misalignment might be on the firm (Papp & Luftman, 1995). The ability to achieve and sustain this synergistic relationship is anything but easy. Identifying an organization's alignment maturity provides an excellent vehicle for understanding and improving the business-IT relationship. It is the maturity of the IT-business alignment relationship that is the focus of this chapter.
This chapter, after this Introduction, is divided into five sections. They are:
- The Strategic Alignment Maturity Assessment Description — explains the essential components of the maturity assessment.
- The Six Strategic Alignment Maturity Criteria — illustrates each of the six criteria that are evaluated in deriving the level of strategic alignment maturity. Examples from many of the previously conducted assessments are included.
- Conducting a Strategic Alignment Maturity Assessment — describes the process applied in carrying out an evaluation. This section ties the respective assessment metrics together. Along with the examples in the Appendix, the last section serves as the vehicle for validating the model.
- Conclusions — summarizes the strategic alignment maturity assessment research, to date.
- Appendices
A - Strategic Alignment Maturity Assessment Experiences — highlights the experiences with 25 Fortune 500 companies that participated in the initial strategic alignment maturity assessments. It also includes summaries of six assessments of Fortune 200 companies and a large university.
B - The Five Levels of Strategic Alignment Maturity — describes each of the five levels of strategic alignment maturity.
Strategic Alignment Maturity Assessment
As the summary of the maturity assessment in Figure 1 illustrates, the model involves the following five levels of strategic alignment maturity:
- Initial/Ad Hoc Process
- Committed Process
- Established Focused Process
- Improved/Managed Process
- Optimized Process
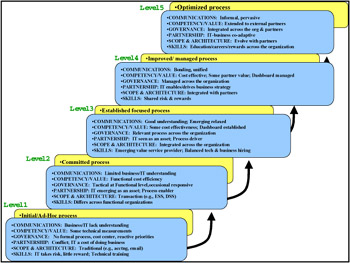
Figure 1: Strategic Alignment Maturity Summary
Each of the five levels of alignment maturity focuses, in turn, on a set of six criteria based on practice validated with an evaluation of 25 Fortune 500 companies. A summary of the evaluations is presented in Appendix A. There are now over 60 organizations that have taken the assessment. Research and benchmarking are continuing under the sponsorship of The Conference Board and Society for Information Management (SIM). The five levels of maturity are described in detail in Appendix B. The same criteria are used for each level of maturity.
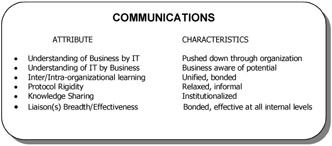
The six IT-business alignment criteria are illustrated in Figure 2 and are described in the following section of this chapter. These six criteria are:
- Communications Maturity
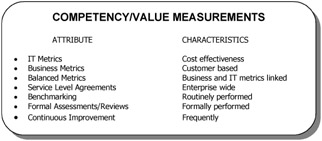
- Competency/Value Measurement Maturity
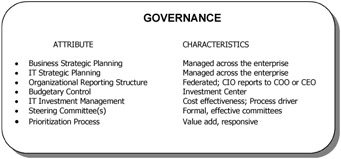
- Governance Maturity
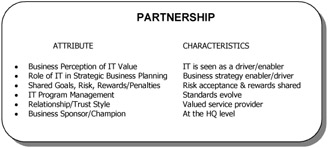
- Partnership Maturity
- Scope & Architecture Maturity
- Skills Maturity
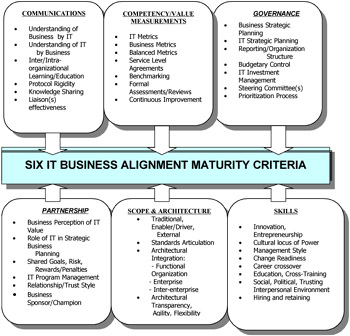
Figure 2: Alignment Maturity Criteria
The procedure for assessing maturity is as follows:
- Each of the criteria is assessed individually by a team of IT and business unit executives to determine the firm's level of strategic maturity on this criterion. In other words, each of the six criteria is found to be at Level 1, Level 2, Level 3, Level 4, or Level 5.
- The evaluation team converges on a single assessment level for each of the six criteria. The discussions that ensue are extremely valuable in understanding both the current state of the organization's alignment maturity and how the organization can best proceed to improve the maturity.
- The evaluation team, after assessing each of the six criteria from level one to five, uses the results to converge on an overall assessment level of the maturity for the firm. They apply the next higher level of maturity as a roadmap to identify what they should do next.
This conceptual framework (qualities and attributes) is described in Appendix B. The process of conducting a Strategic Alignment Maturity Assessment is described in more detail later in this chapter.
The Six Strategic Alignment Maturity Criteria
This section describes each of the six criteria (illustrated in Figure 2) that are evaluated in deriving the level of strategic alignment maturity. Examples taken from actual assessment summaries illustrate the kinds of insights that can be identified. Appendix A includes a more complete description of seven of these studies, as well as the benchmark data attained thus far.
Most organizations today are at a Level 2 with some attributes of Level 3. This is similar to what has been found by the Carnegie software models that identify the comparable stage of application development. Naturally, the objective of the Strategic Alignment Maturity model is to assess the organization at a higher stratum.
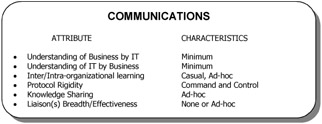
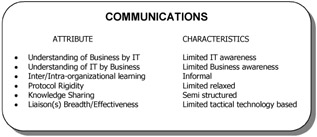
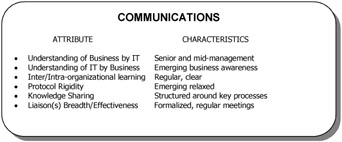
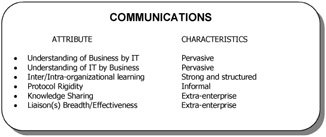
Communications
Effective exchange of ideas and a clear understanding of what it takes to ensure successful strategies are high on the list of enablers and inhibitors to alignment. Too often there is little business awareness on the part of IT or little IT appreciation on the part of the business. Given the dynamic environment in which most organizations find themselves, ensuring ongoing knowledge sharing across organizations is paramount.
Many firms choose to draw on liaisons to facilitate this knowledge sharing. The key word here is facilitate. Often the author has seen facilitators whose role is to serve as the sole conduit of interaction among the different organizations. This approach tends to stifle rather than foster effective communications. Rigid protocols that impede discussions and the sharing of ideas should be avoided.
For example, a large aerospace company assessed its communications alignment maturity at Level 2. Business-IT understanding is sporadic. The relationship between IT and the business function could be improved. Improving communication should focus on how to create the understanding of IT as a strategic business partner by the businesses it supports rather than simply a service provider. The firm's CIO made the comment that there is "no constructive partnership". However, in an interview with the firm's Director of Engineering & Infrastructure, he stated that he views his organization as a "strategic business partner". One way to improve communications and, more important, understanding, would be to establish effective business function/IT liaisons that facilitate sharing of knowledge and ideas.
In a second case, a large financial services company's communication alignment maturity placed it in Level 2 with some attributes of Level 1. Business awareness within IT is through specialized IT business analysts, who understand and translate the business needs to other IT staff (i.e., there is limited awareness of business by general IT staff). Awareness of IT by the firm's business functions is also limited, although senior and mid-level management are aware of IT's potential. Communications are achieved through bi-weekly priority meetings attended by the senior and middle level management from both groups, where they discuss requirements, priorities and IT implementation.
In a third example, a large utility company's communication alignment maturity places it at a Level 2. Communications are not open until circumstances force the business to identify specific needs. There is a lack of trust and openness between some business units and their IT team. IT business partners tend to be bottlenecks in meeting commitments. Its poor performance in previous years left scars that have not healed.
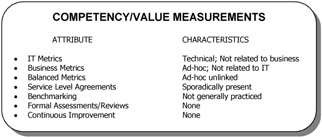
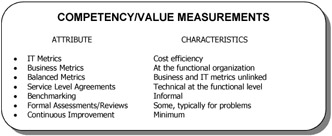
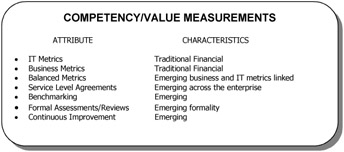
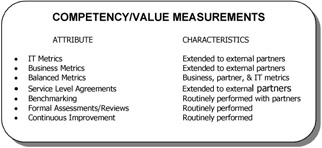
Competency Value Measurements
Too many IT organizations cannot demonstrate their value to the business in terms that the business understands. Frequently business and IT metrics of value differ. A balanced "dashboard" that demonstrates the value of IT in terms of contribution to the business is needed.
Service levels that assess IT's commitments to the business often help. However, the service levels have to be expressed in terms that the business understands and accepts. The service levels should be tied to criteria (see subsection, Partnership) that clearly define the rewards and penalties for surpassing or missing the objectives.
Frequently organizations devote significant resources to measuring performance factors. However, they spend much less of their resources on taking action based on these measurements. For example, an organization that requires an ROI before a project begins, but that does not review how well objectives were met after the project was deployed provides little to the organization. It is important to assess these criteria to understand (1) the factors that lead to missing the criteria and (2) what can be learned to improve the environment continuously.
For example, a large aerospace company assessed its competency/value measurement maturity to be at a Level 2. IT operates as cost center. IT metrics are focused at the functional level, and Service Level Agreements (SLAs) are technical in nature. One area that could help to improve maturity would be to add more business-related metrics to SLAs to help form more of a partnership between IT and the business units. Periodic formal assessments and reviews in support of continuous improvement would also be beneficial.
A large software development company assessed its competency/value measurement maturity at Level 3. Established metrics evaluate the extent of service provided to the business functions. These metrics go beyond basic service availability and help desk responsiveness, evaluating such issues as end-user satisfaction and application development effectiveness. The metrics are consolidated onto an overall dashboard. However, because no formal feedback mechanisms are in place to react to a metric, the dashboard cannot be considered to be managed.
At a large financial services company, IT competency/value was assessed at a Level 2 because they use cost efficiency methods within the business and functional organizations. Balanced metrics are emerging through linked business and IT metrics, and a Balanced Scorecard is provided to senior management. Service level agreements are technical at the functional level. Benchmarking is not generally practiced and is informal in the few areas where it is practiced. Formal assessments are done typically for problems and minimum measurements are taken after the assessment of failures.
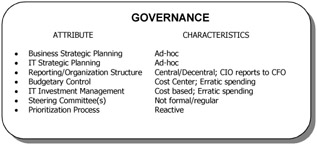
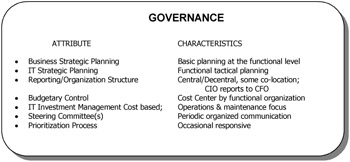
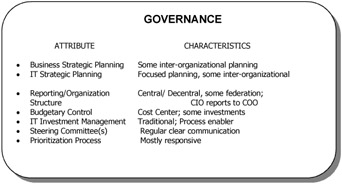
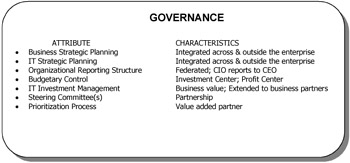
Governance
The considerations for IT Governance are described in Luftman and Brier (1999). Ensuring that the appropriate business and IT participants formally discuss and review the priorities and allocation of IT resources is among the most important enablers/ inhibitors of alignment. This decision-making authority needs to be clearly defined.
For example, IT Governance in a large aerospace company is tactical at the core business level and not consistent across the enterprise. For this reason, they reported a Level 2 maturity assessment. IT can be characterized as reactive to CEO direction. Developing an integrated enterprise-wide strategic business plan for IT would facilitate better partnering within the firm and would lay the groundwork for external partnerships with customers and suppliers.
A large communications manufacturing company assessed its governance maturity at a level falling between one and two. IT does little strategic planning because it operates as a cost center and, therefore, cost reduction is a key objective. In addition, priorities are reactive to business needs as business managers request services.
A large computing services company assessed their governance maturity at a level 1+. A strategic planning committee meets twice a year. The committee consists of corporate top management with regional representation. Topics or results are not discussed nor published to all employees. The reporting structure is federated with the CIO reporting to a COO. IT investments are traditionally made to support operations and maintenance. Regional or corporate sponsors are involved with some projects. Prioritization is occasionally responsive.
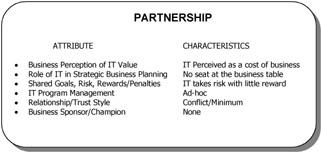
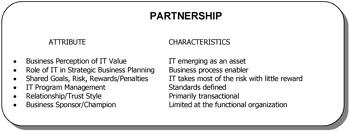
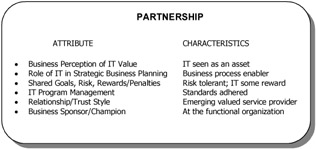
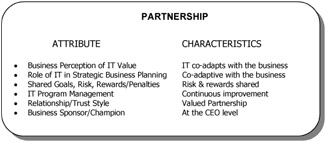
Partnership
The relationship that exists between the business and IT organizations is another criterion that ranks high among the enablers and inhibitors. Giving the IT function the opportunity to have an equal role in defining business strategies is obviously important. However, how each organization perceives the contribution of the other, the trust that develops among the participants, ensuring appropriate business sponsors and champions of IT endeavors, and the sharing of risks and rewards are all major contributors to mature alignment. This partnership should evolve to a point where IT both enables AND drives changes to both business processes and strategies. Naturally, this demands having a good business design where the CIO and CEO share a clearly defined vision.
For example, a large software development company assessed their partnership maturity at a level of two. The IT function is mainly an enabler for the company. IT does not have a seat at the business table, either with the enterprise or with the business function that is making a decision. In the majority of cases, there are no shared risks because only the business will fail. Indications are that the partnership criterion will rise from a Level 2 to 3 as top management sees IT as an asset, and because of the very high enforcement of standards at the company.
Partnership for a large communications manufacturing company was assessed at Level 1. IT is perceived as a cost of being in the communications business. Little value is placed on the IT function. IT is perceived only as help desk support and network maintenance.
For a large utility company, partnership maturity was assessed at a level of 1+. IT charges back all expenses to the business. Most business executives see IT as a cost of doing business. There is heightened awareness that IT can be a critical enabler to success, but there is minimal acceptance of IT as a partner.
Partnership for a large computing services company was assessed at Level 2. Since the business executives pursued e-commerce, IT is seen as a business process enabler as demonstrated by the Web development. Unfortunately, the business now assigns IT with the risks of the project. Most IT projects have an IT sponsor.
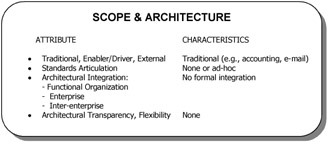
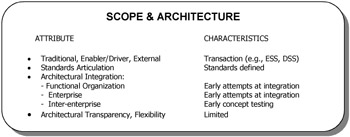
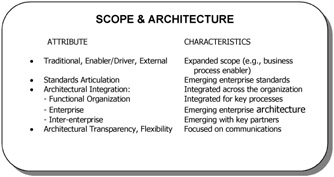
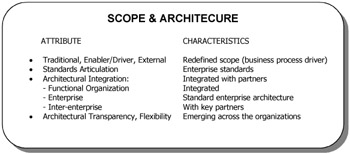
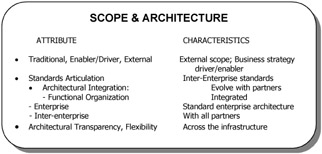
Scope and Architecture
This set of criteria tends to assess information technology maturity. The extent to which IT is able to:
- go beyond the back office and the front office of the organization
- assume a role supporting a flexible infrastructure that is transparent to all business partners and customers
- evaluate and apply emerging technologies effectively
- enable or drive business processes and strategies as a true standard
- provide solutions customizable to customer needs
Scope and Architecture was assessed at a level of 2+ at a large software development company. This is another area where the company is moving from a Level 2 to a Level 3. ERP systems are installed and all projects are monitored at an enterprise level. Standards are integrated across the organization and enterprise architecture is integrated. It is only in the area of Inter-enterprise that there is no formal integration.
A large financial services company assessed their scope and architecture at Level 1. Although standards are defined, there is no formal integration across the enterprise. At best, only functional integration exists.
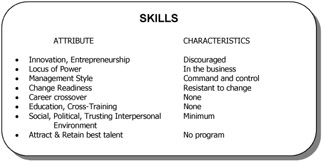
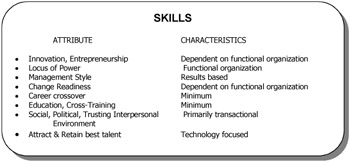
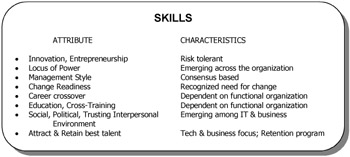
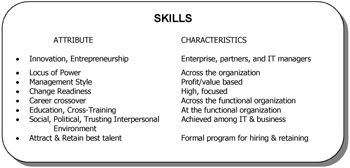
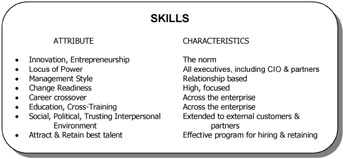
Skills
Skills include all of the human resource considerations for the organization. Going beyond the traditional considerations such as training, salary, performance feedback, and career opportunities are factors that include the organization's cultural and social environment. Is the organization ready for change in this dynamic environment? Do individuals feel personally responsible for business innovation? Can individuals and organizations learn quickly from their experience? Does the organization leverage innovative ideas and the spirit of entrepreneurship? These are some of the important conditions of mature organizations.
For example, a large aerospace company assesses their skills maturity at a Level 2. A definite command and control management style exists within IT and the businesses. Power resides within certain operating companies. Diverse business cultures abound. Getting to a non-political, trusting environment between the businesses and IT, where risks are shared and innovation and entrepreneurship thrive, is essential to achieving improvements in each of the other maturity tenets.
Skills maturity at a large computing services company is assessed at a level of one. Career crossover is not encouraged outside of top management. Innovation is dependent on the business unit, but in general is frowned upon. Management style is dependent on the business unit, but is usually command and control. Training is encouraged but left up to the individual employee.
Conducting a Strategic Alignment Maturity Assessment
An essential part of the assessment process is recognizing that it must be done with a team including both business and IT executives. The convergence on a consensus of the maturity levels and the discussions that ensue are extremely valuable in understanding the problems and opportunities that need to be addressed to improve business-IT alignment. The most important part of the process is the creation of recommendations addressing the problems and opportunities identified. The most difficult step, of course, is actually carrying out the recommendations. This section ties the assessment metrics together. The examples and experiences provided in Appendix A, together with the procedure described here, serves as the vehicle for validating the model.
Each of the criteria and levels are described by a set of attributes that allow a particular dimension to be assessed using a 1 to 5 Likert scale, where:
- 1 = this does not fit the organization, or the organization is very ineffective
- 2 = low level of fit for the organization
- 3 = moderate fit for the organization, or the organization is moderately effective
- 4 = this fits most of the organization
- 5 = strong level of fit throughout the organization, or the organization is very effective
Different scales can be applied to perform the assessment (e.g., good, fair, poor; 1, 2, 3). However, whatever the scale, it is important to evaluate each of the six criteria with both business and IT executives to obtain an accurate assessment. The intent is to have the team of IT and business executives converge on a maturity level. Typically, the initial review will produce divergent results. This outcome is indicative of the problems/ opportunities being addressed.
The relative importance of each of the attributes within the criteria may differ among organizations. For example, in some organizations the use of SLAs (Service Level Agreements) might not be considered as important to alignment as the effectiveness of liaisons. Hence, giving SLAs a low maturity assessment should not significantly impact the overall rating in this case. However, it would be valuable if the group discusses why the organization does not consider a particular attribute (in this example, SLAs) to be significant.
Using a Delphi approach with a Group Decision Support Tool (Luftman, 1997) often helps in attaining the convergence. The author's experience suggests that "discussions" among the different team members helps to ensure a clearer understanding of the problems and opportunities that need to be addressed.
Keep in mind that the primary objective of the assessment is to identify specific recommendations to improve the alignment of IT and the business. The evaluation team, after assessing each of the six criteria from Level 1 to 5, uses the results to converge on an overall assessment level of the maturity for the firm. They apply the next higher level of maturity as a roadmap to identify what they should do next. A trained facilitator is typically needed for these sessions.
Experience with the initial 25 Fortune 500 companies indicates that more than 80% of the organizations are at Level 2 maturity with some characteristics of Level 3 maturity. Figure 3 (including parts A through F) in Appendix A illustrates the "average" results of the Strategic Alignment Maturity assessments for these 25 companies. These results are the start of a Strategic Alignment Maturity Assessment benchmark repository. As the sample grows, it is anticipated that exemplar benchmarks based on factors such as industry, company age, and company size will be available. The figure shows the maturity attributes for each of the six maturity components. Figure 3 (without the average numbers) can be used as the basis for determining an organization's maturity level.
The specific results of the maturity assessment for seven firms are also included in Figure 3. Keep in mind that the results of these maturity assessments were not the principal objective of this exercise. Rather, the goal is to provide the firm with specific insights regarding what it can do to improve the maturity level and thereby improve IT-business strategic alignment.
Strategic Alignment as a Process
The approach applied to attain and sustain business-IT alignment focuses on understanding the alignment maturity, and on maximizing alignment enablers and minimizing inhibitors. The process (Luftman & Brier, 1999) includes the following six steps:
- Set the goals and establish a team. Ensure that there is an executive business sponsor and champion for the assessment. Next, assign a team of both business and IT leaders. Obtaining appropriate representatives from the major business functional organizations (e.g., Marketing, Finance, R&D, Engineering) is critical to the success of the assessment. The purpose of the team is to evaluate the maturity of the business-IT alignment. Once the maturity is understood, the team is expected to define opportunities for enhancing the harmonious relationship of business and IT. Assessments range from three to twelve half-day sessions. The time demanded depends on the number of participants, the degree of consensus required, and the detail of the recommendations to carry out.
- Understand the business-IT linkage. The Strategic Alignment Maturity Assessment is an important tool in understanding the business-IT linkage. The team evaluates each of the six criteria. A trained facilitator can be valuable in guiding the important discussions.
- Analyze and prioritize gaps. Recognize that the different opinions raised by the participants are indicative of the alignment opportunities that exist. Once understood, the group needs to converge on a maturity level. The team must remember that the purpose of this step is to understand the activities necessary to improve the business-IT linkage. The gap between where the organization is today and where the team believes it needs to be are the gaps that need to be prioritized. Apply the next higher level of maturity as a roadmap to identify what can be done next.
- Specify the actions (project management). Naturally, knowing where the organization is with regards to alignment maturity will drive what specific actions are appropriate to enhance IT-business alignment. Assign specific remedial tasks with clearly defined deliverables, ownership, timeframes, resources, risks, and measurements to each of the prioritized gaps.
- Choose and evaluate success criteria. This step necessitates revisiting the goals and regularly discussing the measurement criteria identified to evaluate the implementation of the project plans. The review of the measurements should serve as a learning vehicle to understand how and why the objectives are or are not being met.
- Sustain alignment. Some problems just won't go away. Why are so many of the inhibitors IT related? Obtaining IT-business alignment is a difficult task. This last step in the process is often the most difficult. To sustain the benefit from IT, an "alignment behavior" must be developed and cultivated. The criteria described to assess alignment maturity provide characteristics of organizations that link IT and business strategies. By adopting these behaviors, companies can increase their potential for a more mature alignment assessment and improve their ability to gain business value from investments in IT. Hence, the continued focus on understanding the alignment maturity for an organization and taking the necessary action to improve the IT-business harmony is key.
Conclusion
Achieving and sustaining IT-business alignment continues to be a major issue. Experience shows that no single activity will enable a firm to attain and sustain alignment. There are too many variables. The technology and business environments are too dynamic.
The strategic alignment maturity assessment provides a vehicle to evaluate where an organization is and where it needs to go to attain and sustain business-IT alignment. The careful assessment of a firm's alignment maturity is an important step in identifying the specific actions necessary to ensure IT is being used to appropriately enable or drive the business strategy.
The research to derive the business-IT alignment maturity assessment has just begun. The Conference Board and Society of Information Management (SIM) is sponsoring research to assess and benchmark alignment maturity. To date, more than 50 organizations have participated in the research. The appendices discuss the results of the initial 25 organizations that conducted formal assessments. The author would appreciate hearing from practitioners, researchers, and consultants, as the strategic alignment process and the alignment maturity assessment are applied. The intent is to enhance the alignment assessment tool and provide a vehicle to benchmark exemplar organizations. The journey continues.
References
Brancheau, J., & Wetherbe, J. (1987). Issues in information systems management. MIS Quarterly, 11(1), 23–45.
Dixon, P., & John, D. (1989). Technology issues facing corporate management in the 1990s. MIS Quarterly, 13(3), 247–255.
Earl, M. J. (1996). Experience in strategic information systems planning. MIS Quarterly, 17(1), 1–24.
Faltermayer, E. (1994). Competitiveness: How U.S. companies stack up now. Fortune, 129(8), (April 18), 52–64.
Goff, L. (1993). You say tomayto, I say tomahto. Computerworld, (November 1), 129.
Henderson, J., & Venkatraman, N. (1990). Strategic alignment: A model for organizational transformation via Information Technology. Working Paper 3223-90, Cambridge, MA: Sloan School of Management, Massachusetts Institute of Technology.
Henderson, J., & Venkatraman, N. (1996). Aligning business and IT strategies. In J. N. Luftman (Ed.), Competing in the Information Age: Practical Applications of the Strategic Alignment Model. New York: Oxford University Press.
Humphrey, W.S. (1988). Characterizing the software process: A maturity framework. IEEE Software, 5(2), 73–79.
IBM. (1981). Business Systems Planning, Planning Guide, GE20-0527. White Plains, NY: IBM Corporation.
Keen, P. (1996). Do you need an IT strategy? In J. N. Luftman (Ed.), Competing in the Information Age. New York: Oxford University Press.
King, J. (1995). Re-engineering focus slips. Computerworld, (March 13).
Liebs, S. (1992). We're all in this together. Information Week, (October 26).
Luftman, J. (1996). Competing in the Information Age: Practical applications of the strategic alignment model. New York: Oxford University Press.
Luftman, J. (1997). Align in the sand. Computerworld, (February 17).
Luftman, J., & Brier, T. (1999). Achieving and sustaining business-IT alignment. California Management Review, 1(Fall), 109–122.
Luftman, J.,Lewis, P., & Oldach, S. (1993). Transforming the enterprise: The alignment of business and Information Technology strategies. IBM Systems Journal, 32(1), 198–221.
Luftman, J.,Papp, R., & Brier, T. (1995). The strategic alignment model: Assessment and validation. Proceedings of the Information Technology Management Group of the Association of Management (AoM) 13th Annual International Conference, Vancouver, British Columbia, Canada (August 2–5, pp. 57–66).
Luftman, J.,Papp, R., & Brier, T. (1999). Enablers and inhibitors of business-IT alignment. Communications of the Association for Information Systems, 1(11).
McLean, E., & Soden, J. (1977). Strategic planning for MIS. New York: John Wiley & Sons.
Mills, P. (1986). Managing service industries. New York: Ballinger.
Niederman, F.,Brancheau, J., & Wetherbe, J. (1991). Information systems management issues for the 1990s. MIS Quarterly, 15(4), 475–95.
Nolan, R. L. (1979). Managing the crises in data processing. Harvard Business Review, (March 1).
Papp, R. (1995). Determinants of strategically aligned organizations: A multi-industry, multi-perspective analysis (PhD Dissertation). Hoboken, NJ: Stevens Institute of Technology.
Papp, R., & Luftman, J. (1995). Business and IT strategic alignment: New perspectives and assessments. Proceedings of the Association for Information Systems, Inaugural Americas Conference on Information Systems, Pittsburgh, PA (August 25–27).
Parker, M., & Benson, R. (1988). Information economics. Englewood Cliffs, NJ: PrenticeHall.
Watson, R., & Brancheau, J. (1991). Key issues in information systems management: An international perspective. Information & Management, 20, 213–23.
Appendix A Strategic Alignment Maturity Assessment Experiences
In 2000, pilot studies were conducted using formal assessments of 25 Fortune 500 firms. The last column in Figure 3 (A, B, C, D, E, and F) in this appendix illustrates the "average" evaluations (rated using a Likert scale) for the six criteria of the Strategic Alignment Maturity assessments for these 25 firms. The numbers are the average responses from all participants (e.g., IT, Finance, Marketing from all 25 firms) for each of the respective components of the six criteria. These results are the start of a Strategic Alignment Maturity Assessment benchmark repository. Future assessments will be included to provide exemplar benchmarks based on decisive factors such as industry and company size.
Figure 3 (A, B, C, D, E, and F) in this appendix also includes the responses from six actual assessments of Fortune 200 companies and a large university. These seven assessments represent the average evaluations (rated using a Likert scale) that the multifunctional group (e.g., IT, Finance, Marketing) from each of the firms identified. They are a subset of the 25 firms.
Typically, after getting the individual responses from the participants for their perception of the level of maturity for each of the six criteria, a discussion was facilitated to obtain consensus on the respective maturity level for each of the six criteria. In one case, a Delphi was used to derive the consensus. The maturity level at the bottom of each column represents the consensus for the respective group. Most of the examples used in the main part of this chapter, especially in the section The Six Alignment Maturity Criteria, come from these seven firms. Figure 3 (without the average numbers) can be used as the basis for determining an organization's maturity level.
|
7 Assessments Summarized |
Initial |
|||||||
|---|---|---|---|---|---|---|---|---|
|
1 |
2 |
3 |
4 |
5 |
6 |
7 |
25 Firms |
|
|
Understanding of Business by IT |
||||||||
|
3 |
3 |
1 |
3 |
2 |
1 |
0 |
2 |
|
4 |
3 |
3 |
2 |
2 |
4 |
2 |
4 |
|
2 |
1 |
3 |
1 |
1 |
2 |
5 |
3 |
|
0 |
0 |
1 |
0 |
0 |
0 |
1 |
1 |
|
0 |
0 |
0 |
0 |
0 |
0 |
0 |
1 |
|
Understanding of IT by Business |
||||||||
|
2 |
3 |
2 |
3 |
2 |
2 |
2 |
3 |
|
4 |
3 |
4 |
2 |
3 |
4 |
3 |
4 |
|
1 |
1 |
1 |
0 |
0 |
1 |
2 |
1 |
|
0 |
0 |
0 |
0 |
0 |
0 |
0 |
1 |
|
0 |
0 |
0 |
0 |
0 |
0 |
0 |
0 |
|
Inter/Intra-organizational learning/education |
||||||||
|
3 |
2 |
2 |
3 |
2 |
1 |
0 |
4 |
|
3 |
4 |
3 |
2 |
3 |
4 |
5 |
4 |
|
0 |
1 |
2 |
0 |
0 |
0 |
0 |
1 |
|
0 |
0 |
0 |
0 |
0 |
0 |
0 |
1 |
|
0 |
0 |
0 |
0 |
0 |
0 |
0 |
0 |
|
Protocol Rigidity |
||||||||
|
4 |
3 |
2 |
4 |
4 |
4 |
5 |
4 |
|
2 |
2 |
4 |
2 |
2 |
2 |
0 |
3 |
|
0 |
0 |
1 |
0 |
0 |
1 |
0 |
1 |
|
0 |
0 |
0 |
0 |
0 |
0 |
0 |
1 |
|
0 |
0 |
0 |
0 |
0 |
0 |
0 |
0 |
|
Knowledge (Intellectual Capital) Sharing |
||||||||
|
1 |
2 |
1 |
2 |
1 |
0 |
1 |
0 |
|
2 |
2 |
3 |
3 |
2 |
4 |
5 |
5 |
|
2 |
4 |
3 |
1 |
1 |
3 |
0 |
3 |
|
0 |
0 |
0 |
0 |
0 |
1 |
0 |
1 |
|
0 |
0 |
0 |
0 |
0 |
0 |
0 |
0 |
|
Liaison(s) Breadth/Effectiveness |
||||||||
|
4 |
2 |
1 |
2 |
1 |
1 |
1 |
2 |
|
1 |
2 |
3 |
3 |
4 |
4 |
4 |
4 |
|
0 |
0 |
4 |
0 |
1 |
2 |
2 |
3 |
|
0 |
0 |
1 |
0 |
0 |
0 |
0 |
1 |
|
0 |
0 |
0 |
0 |
0 |
0 |
0 |
0 |
|
MATURITY LEVEL |
2 |
2 |
2 |
2 |
2 |
2 |
2 |
2+ |
Figure 3A: Communications
|
7 Actual Assessments Summarized |
Initial |
|||||||
|---|---|---|---|---|---|---|---|---|
|
1 |
2 |
3 |
4 |
5 |
6 |
7 |
25 Firms |
|
|
IT Metrics |
||||||||
|
4 |
2 |
1 |
5 |
3 |
4 |
5 |
5 |
|
3 |
3 |
4 |
4 |
4 |
4 |
5 |
4 |
|
3 |
4 |
4 |
3 |
4 |
3 |
3 |
3 |
|
1 |
3 |
2 |
1 |
1 |
0 |
0 |
2 |
|
0 |
1 |
1 |
0 |
0 |
0 |
0 |
1 |
|
Business Metrics |
||||||||
|
4 |
2 |
2 |
4 |
4 |
2 |
5 |
4 |
|
3 |
3 |
3 |
4 |
4 |
4 |
4 |
4 |
|
2 |
4 |
4 |
4 |
4 |
4 |
5 |
4 |
|
0 |
3 |
1 |
1 |
1 |
1 |
0 |
3 |
|
0 |
1 |
1 |
1 |
0 |
0 |
0 |
2 |
|
Balanced Metrics |
||||||||
|
3 |
2 |
0 |
1 |
3 |
3 |
4 |
3 |
|
4 |
3 |
2 |
5 |
5 |
4 |
4 |
4 |
|
0 |
2 |
4 |
0 |
0 |
2 |
0 |
3 |
|
0 |
0 |
1 |
0 |
0 |
0 |
0 |
1 |
|
0 |
0 |
0 |
0 |
0 |
0 |
0 |
1 |
|
Service Level Agreements |
||||||||
|
1 |
2 |
2 |
0 |
3 |
4 |
4 |
3 |
|
5 |
3 |
5 |
5 |
4 |
2 |
3 |
4 |
|
1 |
4 |
1 |
2 |
1 |
0 |
0 |
2 |
|
0 |
1 |
1 |
1 |
0 |
0 |
0 |
1 |
|
0 |
0 |
1 |
0 |
0 |
0 |
0 |
1 |
|
Benchmarking |
||||||||
|
2 |
1 |
1 |
1 |
1 |
3 |
2 |
2 |
|
4 |
2 |
4 |
3 |
2 |
4 |
5 |
4 |
|
2 |
4 |
3 |
4 |
4 |
3 |
1 |
3 |
|
2 |
3 |
1 |
2 |
3 |
1 |
0 |
2 |
|
1 |
1 |
0 |
1 |
1 |
0 |
0 |
1 |
|
Formal Assessments/Reviews |
||||||||
|
1 |
0 |
0 |
1 |
0 |
2 |
2 |
2 |
|
4 |
2 |
4 |
4 |
4 |
5 |
4 |
4 |
|
2 |
3 |
2 |
3 |
4 |
1 |
0 |
2 |
|
2 |
3 |
1 |
1 |
2 |
0 |
0 |
1 |
|
0 |
0 |
0 |
1 |
1 |
0 |
0 |
0 |
|
Continuous Improvement |
||||||||
|
1 |
0 |
2 |
0 |
2 |
2 |
3 |
2 |
|
3 |
2 |
3 |
3 |
3 |
3 |
3 |
3 |
|
1 |
4 |
3 |
3 |
3 |
1 |
2 |
3 |
|
1 |
1 |
1 |
2 |
2 |
0 |
0 |
2 |
|
1 |
1 |
1 |
1 |
1 |
0 |
0 |
1 |
|
MATURITY LEVEL |
2 |
3 |
2 |
2 |
2 |
2 |
2 |
2+ |
Figure 3B: Competency/Value Measurements
|
7 Assessments Summarized |
Initial |
|||||||
|---|---|---|---|---|---|---|---|---|
|
1 |
2 |
3 |
4 |
5 |
6 |
7 |
25 Firms |
|
|
Business Strategic Planning |
||||||||
|
3 |
1 |
1 |
4 |
2 |
1 |
2 |
3 |
|
5 |
3 |
5 |
3 |
4 |
5 |
3 |
5 |
|
2 |
2 |
2 |
1 |
2 |
3 |
1 |
2 |
|
0 |
1 1 |
0 |
1 |
0 |
0 |
1 |
|
|
0 |
0 |
0 |
0 |
0 |
0 |
0 |
0 |
|
IT Strategic Planning |
||||||||
|
3 |
1 |
1 |
4 |
5 |
4 |
4 |
3 |
|
5 |
4 |
5 |
2 |
2 |
2 |
5 |
4 |
|
2 |
4 |
4 |
1 |
1 |
1 |
1 |
4 |
|
0 1 |
1 |
1 |
0 |
0 |
0 |
1 |
|
|
0 |
0 |
0 |
0 |
0 |
0 |
0 |
0 |
|
Reporting/Organization Structure |
||||||||
|
2 |
0 |
3 |
5 |
3 |
5 |
4 |
4 |
|
5 |
4 |
5 |
2 |
4 |
1 |
4 |
4 |
|
1 |
3 |
0 |
1 |
0 |
0 |
0 |
3 |
|
0 |
4 |
0 |
0 |
0 |
0 |
0 |
2 |
|
0 |
2 |
0 |
0 |
0 |
0 |
0 |
2 |
|
Budgetary Control |
||||||||
|
2 |
2 |
3 |
3 |
4 |
4 |
5 |
3 |
|
5 |
5 |
5 |
5 |
3 |
1 |
3 |
5 |
|
1 4 |
1 |
1 |
1 |
0 |
1 |
3 |
|
|
0 |
0 |
0 |
0 |
0 |
0 |
0 |
1 |
|
0 |
0 |
0 |
0 |
0 |
0 |
0 |
1 |
|
IT Investment Management |
||||||||
|
4 |
2 |
3 |
5 |
5 |
5 |
5 |
4 |
|
4 |
2 |
5 |
4 |
4 |
4 |
5 |
5 |
|
1 |
4 |
2 |
2 |
1 |
1 |
4 |
3 |
|
0 |
0 |
1 |
0 |
0 |
0 |
0 |
1 |
|
0 |
0 |
0 |
0 |
0 |
0 |
0 |
0 |
|
Steering Committee(s) |
||||||||
|
2 |
2 |
2 |
4 |
4 |
4 |
2 |
2 |
|
5 |
4 |
3 |
3 |
2 |
3 |
5 |
4 |
|
0 |
2 |
1 |
0 |
0 |
0 |
1 |
1 |
|
0 |
0 |
1 |
0 |
0 |
0 |
0 |
1 |
|
0 |
0 |
0 |
0 |
0 |
0 |
0 |
0 |
|
Prioritization Process |
||||||||
|
4 |
2 |
3 |
5 |
4 |
4 |
5 |
4 |
|
4 |
4 |
5 |
3 |
2 |
2 |
2 |
4 |
|
1 |
4 |
2 |
0 |
0 |
0 |
0 |
3 |
|
0 |
1 |
0 |
0 |
0 |
0 |
0 |
1 |
|
0 |
1 |
0 |
0 |
0 |
0 |
0 |
0 |
|
MATURITY LEVEL |
2 |
3 |
2 |
1+ |
1+ |
1 |
2 |
2+ |
Figure 3C: Governance
|
7 Assessments Summarized |
Initial |
|||||||
|---|---|---|---|---|---|---|---|---|
|
1 |
2 |
3 |
4 |
5 |
6 |
7 |
25 Firms |
|
|
Business Perception of IT Value |
||||||||
|
4 |
4 |
3 |
5 |
5 |
4 |
5 |
4 |
|
5 |
5 |
5 |
1 |
1 |
5 |
3 |
5 |
|
2 |
1 |
2 |
0 |
0 |
2 |
0 |
2 |
|
1 |
0 |
1 |
0 |
0 |
0 |
0 |
1 |
|
0 |
0 |
0 |
0 |
0 |
0 |
0 |
0 |
|
Role of IT in Strategic Business Planning |
||||||||
|
2 |
5 |
3 |
5 |
5 |
5 |
5 |
4 |
|
5 |
5 |
5 |
2 |
2 |
5 |
4 |
5 |
|
0 |
0 |
0 |
0 |
0 |
0 |
0 |
1 |
|
0 |
0 |
0 |
0 |
0 |
0 |
0 |
0 |
|
0 |
0 |
0 |
0 |
0 |
0 |
0 |
0 |
|
Shared Goals, Risk, Rewards/Penalties |
||||||||
|
5 |
5 |
3 |
5 |
5 |
5 |
4 |
4 |
|
4 |
5 |
5 |
2 |
2 |
4 |
3 |
5 |
|
1 |
0 |
1 |
0 |
0 |
0 |
3 |
1 |
|
0 |
0 |
0 |
0 |
0 |
0 |
0 |
0 |
|
0 |
0 |
0 |
0 |
0 |
0 |
0 |
0 |
|
IT Program Management |
||||||||
|
2 |
1 |
1 |
1 |
2 |
2 |
4 |
2 |
|
5 |
5 |
5 |
4 |
4 |
3 |
4 |
4 |
|
2 |
4 |
3 |
2 |
2 |
2 |
2 |
2 |
|
2 |
3 |
3 |
2 |
0 |
0 |
0 |
2 |
|
0 |
0 |
1 |
0 |
0 |
0 |
0 |
0 |
|
Relationship/Trust Style |
||||||||
|
3 |
3 |
3 |
4 |
4 |
4 |
4 |
3 |
|
4 |
4 |
5 |
3 |
3 |
4 |
5 |
4 |
|
2 |
3 |
3 |
0 |
0 |
0 |
0 |
2 |
|
1 |
1 |
1 |
0 |
0 |
0 |
0 |
0 |
|
1 |
0 |
0 |
0 |
0 |
0 |
0 |
0 |
|
Business Sponsor/Champion |
||||||||
|
2 |
4 |
3 |
5 |
4 |
3 |
4 |
4 |
|
2 |
4 |
4 |
2 |
4 |
3 |
4 |
4 |
|
4 |
2 |
3 |
0 |
0 |
0 |
4 |
3 |
|
1 |
1 |
1 |
0 |
0 |
0 |
0 |
1 |
|
1 |
1 |
0 |
0 |
0 |
0 |
0 |
1 |
|
MATURITY LEVEL |
2 |
2 |
2 |
1 |
1+ |
2 |
2 |
2+ |
Figure 3D: Partnership
|
7 Assessments Summarized |
Initial |
|||||||
|---|---|---|---|---|---|---|---|---|
|
1 |
2 |
3 |
4 |
5 |
6 |
7 |
25 Firms |
|
|
Traditional, Enabler/Driver, External |
||||||||
|
2 |
2 |
3 |
4 |
2 |
4 |
5 |
2 |
|
2 |
3 |
4 |
3 |
3 |
2 |
2 |
3 |
|
5 |
4 |
3 |
2 |
4 |
0 |
0 |
4 |
|
1 |
0 |
0 |
1 |
0 |
0 |
0 |
1 |
|
0 |
0 |
0 |
0 |
0 |
0 |
0 |
0 |
|
Standards Articulation |
||||||||
|
0 |
0 |
4 |
4 |
0 |
4 |
3 |
2 |
|
5 |
4 |
3 |
2 |
4 |
1 |
4 |
4 |
|
4 |
3 |
1 |
3 |
4 |
0 |
1 |
3 |
|
3 |
3 |
0 |
0 |
3 |
0 |
0 |
1 |
|
0 |
0 |
0 |
0 |
0 |
0 |
0 |
0 |
|
Architectural Integration: |
||||||||
|
Functional Organization |
||||||||
|
0 |
0 |
5 |
4 |
1 |
4 |
5 |
2 |
|
3 |
3 |
2 |
2 |
2 |
3 |
1 |
5 |
|
4 |
4 |
0 |
0 |
4 |
0 |
0 |
1 |
|
1 |
0 |
0 |
0 |
0 |
0 |
0 |
0 |
|
0 |
0 |
0 |
0 |
0 |
0 |
0 |
0 |
|
Enterprise |
||||||||
|
1 |
2 |
5 |
5 |
1 |
4 |
4 |
3 |
|
3 |
4 |
3 |
3 |
3 |
3 |
1 |
4 |
|
4 |
3 |
2 |
1 |
4 |
1 |
1 |
3 |
|
1 |
1 |
0 |
0 |
0 |
0 |
0 |
0 |
|
0 |
0 |
0 |
0 |
0 |
0 |
0 |
0 |
|
Inter-Enterprise |
||||||||
|
2 |
3 |
5 |
4 |
3 |
4 |
4 |
3 |
|
4 |
3 |
2 |
2 |
3 |
1 |
0 |
3 |
|
3 |
1 |
0 |
0 |
1 |
0 |
0 |
2 |
|
2 |
0 |
0 |
0 |
0 |
0 |
0 |
1 |
|
0 |
0 |
0 |
0 |
0 |
0 |
0 |
0 |
|
Architectural Transparency, Agility, Flexibility |
||||||||
|
2 |
2 |
3 |
5 |
4 |
4 |
3 |
4 |
|
4 |
4 |
5 |
2 |
4 |
4 |
4 |
4 |
|
5 |
3 |
2 |
3 |
3 |
1 |
2 |
3 |
|
3 |
2 |
0 |
2 |
2 |
0 |
0 |
2 |
|
2 |
1 |
0 |
0 |
2 |
0 |
0 |
2 |
|
MATURITY LEVEL |
3 |
2+ |
1 |
1 |
2+ |
1 |
1 |
2+ |
Figure 3E: Scope and Architecture
|
7 Assessments Summarized |
Initial |
|||||||
|---|---|---|---|---|---|---|---|---|
|
1 |
2 |
3 |
4 |
5 |
6 |
7 |
25 Firms |
|
|
Innovation, Entrepreneurs hip |
||||||||
|
3 |
3 |
4 |
3 |
4 |
5 |
3 |
4 |
|
4 |
5 |
5 |
4 |
5 |
3 |
4 |
3 |
|
1 |
2 |
0 |
0 |
1 |
1 |
2 |
2 |
|
0 |
0 |
0 |
0 |
0 |
0 |
0 |
1 |
|
0 |
0 |
0 |
0 |
0 |
0 |
0 |
0 |
|
Cultural Locus of Power |
||||||||
|
3 |
2 |
4 |
2 |
2 |
5 |
3 |
3 |
|
4 |
4 |
2 |
4 |
4 |
2 |
4 |
4 |
|
4 |
2 |
0 |
1 |
1 |
1 |
1 |
2 |
|
0 |
0 |
0 |
0 |
0 |
0 |
0 |
1 |
|
||||||||
|
0 |
0 |
0 |
0 |
0 |
0 |
0 |
0 |
|
|
Management Style |
||||||||
|
5 |
3 |
4 |
3 |
4 |
4 |
3 |
4 |
|
2 |
4 |
2 |
3 |
3 |
1 |
2 |
3 |
|
1 |
2 |
2 |
2 |
2 |
1 |
3 |
2 |
|
0 |
0 |
0 |
1 |
0 |
0 |
0 |
1 |
|
0 |
0 |
0 |
0 |
0 |
0 |
0 |
0 |
|
Change Readiness |
||||||||
|
4 |
4 |
5 |
3 |
4 |
4 |
3 |
4 |
|
4 |
5 |
1 |
5 |
4 |
3 |
4 |
4 |
|
2 |
2 |
1 |
2 |
2 |
2 |
4 |
2 |
|
0 |
0 |
0 |
0 |
0 |
0 |
1 |
0 |
|
0 |
0 |
0 |
0 |
0 |
0 |
0 |
0 |
|
Career Crossover |
||||||||
|
2 |
1 |
5 |
2 |
1 |
4 |
3 |
3 |
|
5 |
5 |
3 |
5 |
4 |
2 |
4 |
4 |
|
1 |
3 |
2 |
1 |
3 |
2 |
1 |
2 |
|
0 |
0 |
0 |
0 |
0 |
0 |
0 |
0 |
|
0 |
0 |
0 |
0 |
0 |
0 |
0 |
0 |
|
Education, Cross-Training |
||||||||
|
3 |
2 |
1 |
1 |
3 |
4 |
4 |
3 |
|
4 |
4 |
5 |
4 |
4 |
2 |
4 |
4 |
|
4 |
4 |
4 |
2 |
4 |
2 |
3 |
3 |
|
0 |
0 |
0 |
0 |
0 |
0 |
1 |
1 |
|
0 |
0 |
0 |
0 |
0 |
0 |
0 |
0 |
|
Social, Political, Trusting Interpersonal Environment |
||||||||
|
3 |
3 |
4 |
2 |
2 |
4 |
3 |
4 |
|
4 |
4 |
3 |
3 |
3 |
1 |
4 |
3 |
|
3 |
3 |
1 |
0 |
2 |
0 |
3 |
3 |
|
0 |
0 |
0 |
0 |
0 |
0 |
0 |
1 |
|
0 |
0 |
0 |
0 |
0 |
0 |
0 |
0 |
|
MATURITY LEVEL |
2 |
2 |
1 |
2 |
2 |
1 |
2+ |
2 |
Figure 3F: Skills
Appendix B The Five Levels of Strategic Alignment Maturity
This appendix describes each of the five levels of strategic alignment maturity summarized in Figure 1. Each of the six criteria described in the main part of this chapter are evaluated in deriving the level of strategic alignment maturity.
Level 1: Initial/Ad Hoc Process
Organizations that meet many of the characteristics of the attributes in the six Strategic Alignment Maturity criteria for Level 1 can be characterized as having the lowest level of Strategic Alignment Maturity. It is highly improbable that these organizations will be able to achieve an aligned IT business strategy, leaving their investment in IT significantly unleveraged.
Level 2: Committed Process
Organizations that meet many of the characteristics of the attributes in the six Strategic Alignment Maturity criteria for Level 2 can be characterized as having committed to begin the process for Strategic Alignment Maturity. This level of Strategic Alignment Maturity tends to be directed at local situations or functional organizations (e.g., Marketing, Finance, Manufacturing, H/R) within the overall enterprise. However, due to limited awareness by the business and IT communities of the different functional organizations use of IT, alignment can be difficult to achieve. Any business-IT alignment at the local level is typically not leveraged by the enterprise. However, the potential opportunities are beginning to be recognized.
Level 3: Established Focused Process
Organizations that meet many of the characteristics of the attributes in the six Strategic Alignment Maturity criteria for Level 3 can be characterized as having established a focused Strategic Alignment Maturity. This level of Strategic Alignment Maturity concentrates governance, processes and communications towards specific business objectives. IT is becoming embedded in the business. Level 3 leverages IT assets on an enterprise-wide basis and applications systems demonstrate planned, managed direction away from traditional transaction processing to systems that use information to make business decisions. The IT extrastructure (leveraging the inter-organizational infrastructure) is evolving with key partners.
Level 4: Improved/Managed Process
Organizations that meet many of the characteristics of the attributes in the six Strategic Alignment Maturity criteria for Level 4 can be characterized as having a managed Strategic Alignment Maturity. This level of Strategic Alignment Maturity demonstrates effective governance and services that reinforce the concept of IT as a value center. Organizations at Level 4 leverage IT assets on an enterprise-wide basis and the focus of applications systems is on driving business process enhancements to obtain sustainable competitive advantage. A Level 4 organization views IT as an innovative and imaginative strategic contributor to success.
Level 5: Optimized Process
Organizations that meet the characteristics of the attributes in the six Strategic Alignment Maturity criteria for Level 5 can be characterized as having an optimally aligned Strategic Alignment Maturity. A sustained governance process integrates the IT strategic planning process with the strategic business process. Organizations at Level 5 leverage IT assets on an enterprise-wide basis to extend the reach (the IT extrastructure) of the organization into the supply chains of customers and suppliers. It is often difficult to determine if a Level 5 organization is more a technology company than it is a securities, insurance, travel, retail company.
Section I - IT Governance Frameworks
- Structures, Processes and Relational Mechanisms for IT Governance
- Integration Strategies and Tactics for Information Technology Governance
- An Emerging Strategy for E-Business IT Governance
Section II - Performance Management as IT Governance Mechanism
- Assessing Business-IT Alignment Maturity
- Linking the IT Balanced Scorecard to the Business Objectives at a Major Canadian Financial Group
- Measuring and Managing E-Business Initiatives Through the Balanced Scorecard
- A View on Knowledge Management: Utilizing a Balanced Scorecard Methodology for Analyzing Knowledge Metrics
- Measuring ROI in E-Commerce Applications: Analysis to Action
- Technical Issues Related to IT Governance Tactics: Product Metrics, Measurements and Process Control
Section III - Other IT Governance Mechanisms
- Managing IT Functions
- Governing Information Technology Through COBIT
- Governance in IT Outsourcing Partnerships
Section IV - IT Governance in Action
EAN: 2147483647
Pages: 182
