Measuring ROI in E-Commerce Applications: Analysis to Action
Measuring ROI in E Commerce Applications Analysis to Action
Manuel Mogollon
Nortel Networks, USA
Mahesh S. Raisinghani
University of Dallas, USA
Copyright 2004. Idea Group Inc. Copying or distributing in print or electronic forms without written permission of Idea Group Inc. is prohibited.
Abstract
Measuring the Return on Investment (ROI) of a project is a key element of the IT Governance process. The research in this paper aims to provide an overview of how to calculate the ROI for e-commerce applications so that this information, and the attached ROI Calculator Tool Template, can be used by organizations to reduce the time in preparing the ROI for a project. Although there is much written about ROI, there is not that much said about how to prepare one, specifically for an e-commerce project. By reading this research paper and by using the ROI Calculator Tool, any IT group or organization that is going to deploy e-commerce applications will have a starting point for calculating ROIs.
Section I Introduction
In an interview, Harvard Business School's Michael E. Porter had this to say about e-commerce: "The Internet as a family of technologies will have a very powerful effect on operational effectiveness. We'll see deeper integration among service, sales, logistics, manufacturing and suppliers. The first level of that will improve efficiencies, reduce transaction costs and reduce inventory" (Byrne, 2001, p. 114). Businesses are looking for those e-commerce applications, such as relationship-marketing software, integration software, customer management, E-Procurement, and collaborative software that can achieve the business integration discussed by Michael Porter to boost productivity and/ or create new sources of revenue.
In the late '90s, companies discovered the seemingly endless possibilities of the Internet, and they began to purchase e-commerce applications with little or no financial controls. There was a sense of urgency that precluded taking the time to measure the real economic value of these investments — companies were moving at Internet speed. Then the US economy slowed dramatically, Information Technology (IT) budgets dropped considerably, and projects were competing for the few available dollars (Sammer, 2001). In this new economy, IT managers must convince management of the value of a project, compare projects to determine which offers the best return, and justify the implementation of an e-commerce application.
A survey carried out by the Meta Group in November 2001 led to the following conclusion: "ROI has become one of the most important evaluation criteria for IT groups" (Ferengul, 2001, p. 1). The renewed focus on ROI as an evaluation tool came after years of IT departments using some internal measurements, such as the number of visitors to a web site and network uptime, that didn't have any meaning for business executives who were trying to link a project to the overall performance of a company. Today, Return-on-Investment is becoming an important tool for IT departments and corporate management to measure and quantify the return of e-commerce applications in relation to other investments.
In April and May of 2000, International Data Corporation (IDC) conducted an Internet Executive e-Panel survey about ROI (Rosenthal, 2000, pp. 3–8). These were some of IDC's findings:
- On the question of whether ROIs are calculated for e-business projects: 33% of the respondents said yes, 16% said they didn't know, and 50% said no.
- Reasons given as to why ROIs should not be calculated:
- The time and energy aren't worth it because ROI is an imperfect calculation. Not enough firm data to base calculations on.
- The ROI is usually positive in e-commerce applications so there is no need to calculate it.
- Similar companies may already be doing it. Even though ROIs are not comparable from company to company, if another company has similar programs, tools, and features, then it may not be necessary to spend the time and resources to calculate the ROI for each new element in e-commerce.
- Reasons given for why ROIs should be calculated:
- The ROI process will help determine the metrics that matter.
- Once the ROI is calculated, it is easier to do it for similar projects.
- The ROI process will provide a sense of which e-commerce applications produce the best and fastest results.
The results of IDC's survey summarize the disjunctive situation in which organizations find themselves today. On the one hand, they recognize that e-commerce applications need to be implemented quickly, but they do not want to spend too much time calculating the ROI for a project because they have problems finding the required data. On the other hand, they recognize that e-commerce investments are substantial and risky, and that they should have a thorough measure that projects the risk, yield, and benefit of a project. Organizations can resolve this situation by reducing the time to prepare ROIs, either by developing internal standardized processes and procedures, or by licensing tools already developed by companies specialized in preparing ROIs for e-commerce.
This chapter aims to provide an overview of how to calculate the ROI for e-commerce applications so that this information, and the attached ROI Calculator Tool Template, can be used by organizations to reduce the time in preparing the ROI for a project.
ROI
In any type of investment, investors want to find out what their return will be. This is a key element of the IT Governance process. The return is calculated by dividing the profit by the investment. It is a straight calculation when measuring a capital investment, a loan, for example, where the return on investment is the interest received. However, for a project, the investment is measured as the total cost in time, dollars, or any other unit required to plan, execute, and complete the project. The return is the savings, also in time, dollars or any other measurable unit generated by the project. The project's ROI is, then, the ratio of the total return divided by the total cost of the project.
The difficulty in calculating ROI is in determining what constitutes the total cost of the project and what constitutes the total return of the project. The problem results from the fact that even though most of the cost and return factors are easily measurable and have tangible values, the values of other factors involved are more difficult to determine. An example in point is the factor of customer satisfaction; it can be measured (surveys, focus groups), but its value may be hard to specify. ROI has been used as a measure of a firm's performance in various studies (Byrd & Marshall, 1997; Mahmood & Mann, 1993a, b; Woo & Willard, 1983). In this chapter, the term ROI will be used as the benefit generated by a project, regardless of whether it is measured by the Payback Period, Net Present Value, or Internal Rate of Return (IRR).
Financial Aspect of Measuring the ROI of an E Commerce Application
In finance, the following standard steps are followed to evaluate the capital budgeted for a project (Brigham & Houston, 1999, p. 502):
- Determine the cost of the project.
- Estimate the expected cash flow from the project, including the salvage value of the assets at the end of the project's expected life.
- Estimate the project's risks.
- Determine the project cost of capital based on the project's risk.
- Calculate the present value of the expected cash flow.
- Compare the present value of the expected cash flow with the required outlay. If the present value of the cash flow exceeds the cost, the project should be implemented. Otherwise, it should be rejected.
The same steps used in the finance field to evaluate the capital budgeted for a project can be used to establish a process to measure the return for e-commerce applications. The steps are as follows:
- Determine the internal and external costs of implementing and maintaining current and new e-commerce application processes.
- Calculate the cost savings between the current process and the new process, and add the benefits in productivity and efficiency. All process improvements should be measurable; however, it may be easier in some cases than others to assign a dollar value.
- Calculate the e-commerce application's risk.
- Determine the company's cost of capital for that specific e-commerce application.
- Calculate the net present value.
- Compare the present value of the expected cash flow with the required outlay. If the present value of the e-commerce application cash flow exceeds the cost, the project should be implemented. Otherwise, it should be rejected.
The above steps use the Net Present Value (NPV) to measure the return for a project; however, other finance methods can be used to rank projects. Those methods include the following:
- Payback Period, defined as the expected number of years required to recover the original investment.
- Discounted Payback, similar to regular payback, except that the expected cash flows are discounted by the project's cost of capital.
- Internal Rate of Return, which is defined as the discount rate that equates the present value of a project's expected cash inflows with the present value of the project's costs.
A more complete definition of these terms (including NPV) is presented in Appendix A: ROI Terms.
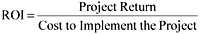
The development of a comprehensive method for calculating the ROI for an e-commerce application is shown in the following steps. Initially, a project's ROI can be calculated as:
However, to further define the method, a project's return can be determined by calculating the expenses that a company will incur with the new process and subtract that from the expenses that a company incurs with the current process. Normally, when a new process is implemented, a value may be given to some other benefits. In this chapter "other benefits" will be included so as to learn how they could be measured and valued. Now, the ROI formula can be written as:

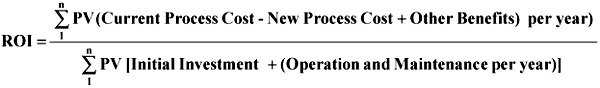
Ideally, when implementing a new process, companies will incur a one-time only cost, the initial investment; however, this is not normally the case. New processes may involve some new costs for maintenance and operation. Therefore, it is not only necessary to determine the initial investment, but, also, how much it is going to cost a company to operate and maintain this new process for a certain period of years. The time factor, measured in cost per year, needs to be included in the ROI formula. In an e-commerce application, a period of three years is usually selected to calculate the ROI because IT and e-commerce technologies change very rapidly (Wu, 2000). The ROI formula now can be written as:

If the Net Present Value (NPV) method is used, then the formula for ROI can be written as:
When calculating ROI, some companies have the policy that if something cannot be assigned a value in dollars, even if it is measurable, it should not be included in the ROI calculation. Other companies allow intangibles to be included in the ROI. In the ROI formula above, the intangibles, also called soft benefits, are included in "Other Benefits". The following list shows some tangible and intangible benefits used in calculating ROIs:
Tangible Benefits
(Measurable and a dollar value can be assigned)
- Sales increase
- Production increase
- Reduction in operating cost
- Reduced network downtime
- Increased mean time before failure
- Reduced time to configure a data network
Intangible Benefits
(Measurable, but difficult to assign a dollar value)
- Customer satisfaction
- Customer retention
- Managerial know-how
- Employee retention
- Stronger channel ties
- Increased customer base
- Improved employee morale
Business Process Analysis Aspect of Measuring the ROI for E Commerce Applications
The main reason a company implements an e-commerce application is because it seeks to improve a process. "It is about doing the same work, in a more effective and efficient way such that it will increase capabilities and reduce costs," states Dr. David Gordon, a professor at the University of Dallas and an expert in operations management and process improvement (D. Gordon, personal communications, February 9, 2002). In his opinion, customers and process meet in areas such as proposals, installations, purchasing/ordering, billing, inquires, and complaints. Dr. Gordon further states that organizations can improve some of these processes by using electronic applications. By improving the processes, Dr. Gordon means the following:
- Learning about the cause-and effect mechanisms that impact process performance
- Improving the effectiveness of their current processes
- Developing and implementing counter-measurements
- Confirming the results of the improvement
In its simple form, the ROI is given by:

As can be seen in the ROI formula, the different costs are related to a process, and this is where "Business Process Analysis" becomes important to help determine the different activities involved in a process.
Current and New Process Costs
When measuring a proposed project's ROI, the first step is to determine and identify the project's benefits. It should be established what the main reason for the project is, e.g., to increase sales, the number of sales leads, production, and customer satisfaction, or to reduce the sales cycle, network downtime, operating costs, the cost per sales lead, and the time to configure a data or voice network. An e-commerce application may replace or reduce the current sales force and distribution channels, or it may increase the performance of the current sales force and distribution channels.
It must also be determined what the expected results are. Statements such as, "The objective of this project is to improve…" help identify these results.
Once the proposed project's expected results are established, the following basic Business Process Analysis procedures should be used for collecting the information regarding the current process (Gordon, 2002):
- Understand the current process.
- Go to the actual location of the process.
- Observe the actual process in action — walk through the process.
- Get the facts by talking to those directly involved.
- Map the actual process by developing a process flow chart.
- Select the right metrics and make sure they describe the business case.
- Collect performance data.
- Rate the process.
The same should be done for the new e-commerce application process; variations in performance, schedule, and cost should be noted.
Mapping the Process
After developing an understanding of the current process, the following steps should be used to map the current process and the new process:
- Prepare a Task/Activity matrix with all the events that now take place in the current process. Highlight the activities that are going to be eliminated and the activities that are going to be improved with the new process. The matrix should include the tasks and the activities in each task. See Table 1, "ROI Step-by-Step".
Table 1: Initial and Recurring Costs Consulting
- Create an overall strategy and a road map for project implementation.
Personnel
-
- Project Management
- Assign a Project Manager.
- Hold customer meetings to determine the concept, project plan/requirements, training needs, and to evaluate progress.
- IT Staff
- Create an entire IT department for the e-commerce application. People to hire may include:
-
- Department Director
- A Webmaster in charge of developing and maintaining the site
- A database engineer
- Site programmers
- Customer service representatives
-
IT Purchases
-
- Purchase as needed:
- E-Commerce application platforms
- Additional hardware
- Security software, firewalls, and VPNs
- Database software
- Payment authorization software
Implementation and Integration
-
- Build and verify configurations.
- Develop and maintain new software.
- Make web site enhancements.
- Do test configuration.
Training and Documentation
-
- Provide internal and/or external training.
- Provide workforce transformation/change management training.
Facilities
- Lease more office space.
- Modify existing physical facilities.
Advertising
- Do Internal and/or external promotion.
- Prepare two flow diagrams showing all the events that take place in the current and in the proposed new process indicating who the contributors are, i.e., the departments in which the events take place, for each. Figures 1 and 2, "ROI Step-by-Step", show the customer and company events that take place. By putting the events for the current and the new processes in the same time format, it is easy to visualize the efficiency of the new process.
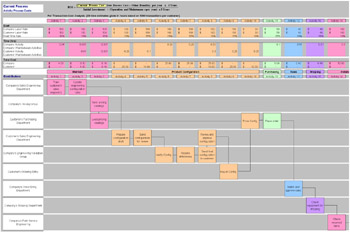
Figure 1: Current Process Flow-Matrix Diagram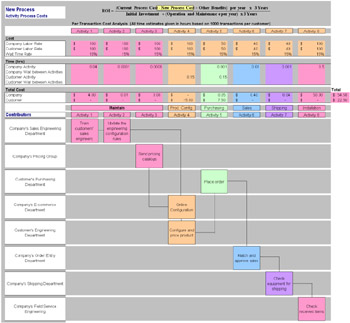
Figure 2: Proposed Process Flow-Matrix Diagram - Determine, in hours, how long it takes for the vendor and for the customer to carry out a transaction at a specific point in the flow chart. Then, multiply that number of hours by the labor rate for the vendor and for the customer. The result in dollars is the labor cost of each transaction at a specific event. Figures 2 and 3 show an example of the labor cost for the actual and for the new proposed process. When the labor costs per transaction are added in, the total cost per transaction of the current and the new process is given.
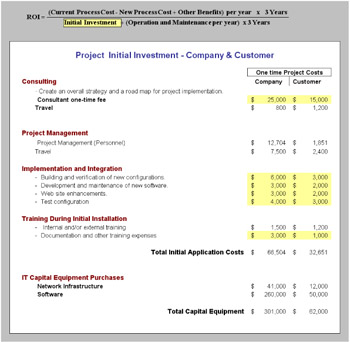
Figure 3: Initial Investment
Initial and Recurring Costs
"Underestimating implementation costs is not as big a problem as underestimating maintenance and operation costs," states Barbara Gomolski (2001, p. 12) in her article, "The Cost of E-Business". She points out that, typically, ongoing costs of new systems are 40% to 60% of the first year's expenses. If the first year's expenses of hardware, software, and staffing are $1 million, then it will cost a company approximately $500,000 per year to maintain and integrate that system.
Many consultants and IT managers share Barbara Gomolski's opinion about the cost of maintaining and integrating an e-commerce solution. Therefore, when trying to determine the cost of a new process, not only the initial investment should be considered, but also, the recurring cost that will continue after the project has been implemented. A good example of this point is that of DoveBid, which, in November 1999, rolled out an online auction service for surplus capital assets. IDC prepared a bulletin describing DoveBid's ROI for adding e-commerce to an existing bricks and mortar company. In that bulletin, IDC showed that most of the costs were not related to acquiring information technology, but to other expenses. For its B2B auction site, DoveBid spent 1% on IT equipment and software purchases, 10% in consulting fees, 34% in staffing, and 55% in advertising (Rosenthal, 2000). The advertising costs were relatively high since this was a new service, but it was important to let the potential customers know about its B2B auction web site.
Initial and recurring costs can fall into any of the seven broad categories (Oleson, 2000): Consulting, Personnel, Software, Hardware, Implementation & Integration, Training, and Facilities (office space expense). Initial costs are also called implementation or start-up costs. Recurring costs are also called operation or maintenance costs. The following table shows some of the costs that need to taken into account when calculating the initial and the recurring costs.
Calculating the Intangibles Other Benefits
Measuring the ROI for an e-commerce application is no different than measuring it for any other project in the sense that all projects have tangible and intangible benefits. The initial investment and the operational and maintenance expenses for implementing an e-commerce project are tangibles, also referred to as "hard dollars", which can be translated directly into a value such as money or time.
The intangibles, also called "soft dollars", are benefits that sometimes cannot be tied directly to cash. This is mainly due to a lack of information that can be used to establish a level of value. For example, it is difficult to give a value to the intangibles on the following detailed list (Schlegel, 2001; Meta Group, 2001):
- Increased customer satisfaction
- Increased customer retention
- Greater customer reach
- Increased customer base
- Reduced customer contact/support requirements
- Reduced fulfillment and customer response errors
- Increased employee retention
- Improved employee morale
- Improved customer or employee knowledge and learning
- New business processes
- Decreased time-to-market
- Reduced ordering process complexity
- Better or improved managerial know-how
- Stronger channel ties
- Better delivery date information
- More productive time on web site
- Increased brand awareness
- Better business alignment
- More product information availability
- Improved communications
- Organizational flexibility
- Streamlining of knowledge
- Ability to work from a remote location
- Reduced days sales outstanding (average collection period)
- Increased efficiency
- Improved information access, search, and retrieval time
In any ROI calculation, it will take significant time and effort to determine the value for these intangibles. Product Managers, Sales Teams, and personnel in IT and the e-commerce departments might be of assistance in placing values on intangibles (the Finance department generally seems to generate hard dollar values for tangibles). Some examples of methods and tools used to identify intangibles include workshops, roundtable discussions, and desk research. Once the values have been established and agreed upon, it makes sense to use them in all ROIs calculations, not only to save time, but also to make all ROI calculations comparable.
The Decision to Implement an E Commerce Application
After calculating a project's ROI, how can it be determined whether the project should be implemented or not? If a project has an ROI of 15%, for example, is that enough return for a company to implement the project?
After calculating the ROI for an e-commerce application, it is necessary to compare it to a point of reference; in this case, it should be compared to the company's cost of capital. The cost of capital of a company is a complex interaction of several factors such as interest rate depreciation, taxes, and capital gains. Different projects have different risk levels, so companies have different costs of capital for different types of projects. A company's chief financial officer can determine the company's cost of capital for e-commerce applications. This cost of capital may be different for other company investments because of the different risks involved in e-commerce projects vs. other expenditures. In a simple ROI calculation, not using Present Value, the ROI of a project should be higher than the cost of capital to be considered for approval. In an ROI calculation using the Present Value, the Cost of Capital is the rate used to discount the cash inflows and outflows.
Conclusion
When companies include e-commerce initiatives in their visions and strategies, they should consider e-commerce applications that are in accord with those visions and strategies and that have appropriate ROIs.
When calculating the ROI for an e-commerce project, it is necessary to take into account the following:
- ROIs are not perfect calculations and are not comparable between different companies, between similar e-commerce projects from two different companies, or from strategic business units within the same company.
- ROIs should not only be used as an approval tool, but, also, to continue measuring the project's benefits during the project's life. Once approved, the same data used to evaluate the ROI can be used to determine if final project costs are on target or not. A higher or lower actual project cost will result in a different ROI than projected.
- If two companies are implementing the same e-commerce application, having a higher ROI for one only means that a greater improvement was achieved in that company and not necessarily that the implementation was better.
- Measuring ROI is a way to present the value of an e-commerce application in a language understood by corporate finance and management.
It is generally assumed that measuring the ROI for an e-commerce application is associated more with finance rather than with the business process analysis, but, in reality, it is the other way around. Finance rules are standard and the same formulas can be used to calculate the ROI for any project; for example, this article includes a template with all the standard finance formulas. On the other hand, the activities are different from project to project and to uncover and quantify those activities requires much more effort. Calculating the intangible benefits is another area that will require a lot of time because standardized information is not available. In addition, how one company calculates intangibles might substantially differ from how other companies might do it. This chapter includes some e-commerce intangibles collected during the research phase that might be used as a starting point.
Section II ROI Case Study
In this section, a case study, the ROI of an Online Tool for Configuring and Pricing a Data Product, will be used to show, step-by-step, how to conduct an ROI calculation. The numbers used in this case study are hypothetical.
- Situation Snapshot. In data communications, a high level of expertise is required to configure a data product. Engineering rules to configure a product are established by the engineers who developed the product or by other engineers who learned to operate the product. Knowledge and access to information is, therefore, in the hands of a relative few, and it would not be cost effective to train the number of engineers needed to be available to answer sales support technical questions.
- Situation Verification. ABC, Inc., a global telecommunications company that sells data products to its distributors, has received complaints from the distributors that it takes too much time to configure and price a data product. Distributors have mentioned that it takes four days to configure ABC's product, while it only takes them four hours to configure data products from DEF, Inc., a competitor of ABC.
- Severity Assessment. Distributors' dissatisfaction with the time it takes to configure data products is causing ABC to lose revenue.
- Improvement Target. The Internet allows companies to post information on their web sites that users can access to carry out electronic commerce activities, such as finding prices and ordering products. ABC, Inc. would like to develop or purchase an online tool to allow its distributors to configure data products for complex networks and to determine the price of those configurations. An online e-commerce application to configure and price data products would have a beneficial impact on the overall cost associated with doing business, but ABC, Inc. would like to calculate the ROI for such an e-commerce application before deciding whether to make the financial investment involved in developing or purchasing the application.
The following are the steps to calculate the ROI for this business case:
ROI Depth and Level of Complexity
If several persons are asked to individually prepare an ROI for a specific project, chances are that each ROI would be calculated in a different way. Everyone's approach to the ROI is different, but even though the ROIs are prepared using different approaches, the results may be the same. However, it is recommended that before starting work on an ROI, several interviews should be conducted to gather information about how ABC, Inc. measures ROIs, so that the ROI is prepared according to the company's or manager's guidelines. ABC's e-commerce group can help determine the issues involved in measuring the ROI of e-commerce applications. Questions such as the following could be put to five executives from e-commerce:
- Is it worth it to measure the ROI of an e-commerce project?
- Do you feel that ABC, Inc. should measure the ROI for all e-commerce projects?
- Does ABC, Inc. have some guidelines for calculating the ROI for e-commerce projects?
- What is your opinion of using intangibles in the ROI calculation?
- Do you track the ROI of an e-commerce project to determine whether the results meet the expectations?
- Do you track the actual implementation costs against the ROI analysis to determine how actual costs compare to forecasted costs?
- What is the typical time frame, or amortization schedule, that ABC, Inc. uses when calculating an ROI for an e-commerce project?
The answers to these questions provide input as to the type and depth of the ROI measurement. The Center of Public Technology of the University of North Carolina recommends using a three-tiered set of business case methodologies that are scaled to the size and complexity of an IT or e-commerce initiative. The following are the three possible methodologies (Rivenbark, FitzGerald, Schelin, Yates, & Runkle, 2001, p. 23):
- Tier 1 (least complex/cost): Total Cost of Ownership;
- Tier 2 (middle/cost): Total Cost of Ownership, Payback Period, Benefit/Cost Ratio, Internal Rate of Return, and Return on Investment;
- Tier 3 (most complex/cost): Applied Information Economics. [1]
ABC's executives agreed that the two-tiered model should be used because the ROI measurement is not very complex and the investments are not very high. The executives also decided not to include intangible benefits in the ROI calculation.
Identifying the Processes
The second step in preparing the ROI analysis for ABC, Inc. is to determine the activities that take place for the current process, as well as the activities that would be involved with the new process.
Again, interviews could be used to gather information; five persons who are very familiar with the current process could be asked the following questions:
- Is the company satisfied by the way the current process is carried out, or has someone requested changing the process?
- Can the process be improved? How? What advantages would these changes bring to the company's process?
- How do employees or customers carry out the current process?
- How much time do employees spend on the current process, broken down by activity?
- How does this time compare to the time another company spends executing a similar process?
- What would be the impact of changing the current process to the new process?
- How would changes made to the current process affect other departments or customers?
- Are there any existing corporate obligations that would make the adoption of the new process more costly?
The answers to these questions allows a company to determine whether or not the new process includes all suggested changes, and if there are other costs not taken previously into account.
If ABC would choose to purchase a new e-commerce application, instead of developing one internally, then a sales representative from the company that sells the application could be interviewed and asked the following questions:
- What activities are involved in using the new application and which ones from the current process would not be necessary? Show them in a flow chart.
- What is the total cost of ownership including the initial investment and the recurring cost-maintenance and operational costs?
- What information and resources does a company need to provide to your company to maintain the accuracy of the new application tool?
- What new hardware or additional software would it be necessary to have once the e-commerce application is implemented?
- Are there any existing features in the current process environment that will be lost by going to the new e-commerce application?
- How much time does it take a company to implement your application?
- Which other companies use your application?
Current and New Process Costs
With the information collected during the interviews, a Task-Activity matrix should be prepared; it should list all the activities, grouped by tasks, as shown in Table 1. This table shows the activities that take place at ABC, Inc. when configuring a data product. The activities are grouped by their main four tasks: Maintain, Product Configuration, Purchasing and Shipping, and Installation. The next step is to determine which activities are going to be eliminated and which ones are going to be improved with the new process. Based on this information, a flow diagram for both processes, the current and the new improved process, should be drawn as shown in Figures 1 and 2.
|
Tasks |
Activity |
Activity |
Activity |
Activity |
|---|---|---|---|---|
|
Maintain |
Train customers' sales engineers |
Update engineering configuration rules |
||
|
Send pricing catalogs to customer |
Load pricing catalogs |
|||
|
Product Configuration |
Prepare configuration draft |
Send configuration for review |
||
|
Verify configuration |
Resolve differences |
Send final configuration to customer |
Review and approve configuration |
|
|
Key-in configuration |
Price configuration |
|||
|
Purchasing & Shipping |
Place order |
Match or approve |
Check equipment for shipping |
|
|
Installation |
Check received items |
Check for missing parts |
Order missing parts |
|
|
Note: The activities highlighted in the lighter shade can be eliminated. The ones highlighted in the darker shade can be improved. |
||||
The flow-matrix diagram for the current and new processes shown in Figures 1 and 2 includes the activities, contributors, the time spent in each activity, the labor rate for each activity, and the total cost of the process on one worksheet.
Combining all this information on one worksheet helps not only to visualize the process, but also to enter the information and calculate the cost for each process (Shiavi, Bourne, Brodersen, & Dawant, 1995; Brassard & Ritter, 1994).
This flow-matrix diagram model is used in the ROI Calculator Tool that is part of this chapter.
Calculate the Initial and Recurring Costs
The cost for the initial investment and the recurring costs are entered on the worksheets. In ROI Calculator Tool, the highlighted part of the ROI formula at the top of the worksheet shows which part of the ROI formula the information is for.
For each of the worksheets, the ROI Excel tool provides additional formulas to calculate the cells not highlighted in yellow.
Preliminary ROI Results
Before trying to calculate the intangible benefits, it must be determined whether the ROI results satisfy the company's requirements. The ROI tool provides two calculations, the Simple ROI and the Net Present Value (NPV) ROI (Oleson, 2000; Brigham & Houston, 1999). It is necessary to enter the company's Federal and State Taxes Bracket, the Company Discount Rate, and the Straight-line Depreciation (Yrs) on the worksheet to calculate the NPV.
Figures 5 and 6 show the ROI results without taking into account the intangible benefits.
The Simple and NPV ROI calculations for this example, Figures 5 and 6, show that this project has a very high return, and that it is not necessary to measure and calculate the intangible benefits (which would be shown above as "Other Benefits").
Calculating the Intangible Benefits
Intangibles, by definition, are assets that are not physical in nature; for example, goodwill, patents, trademarks, customer satisfaction, and copyrights. For those intangibles that can be measured, a dollar value can be assigned or calculated.
ABC's executives agreed not to include the intangible benefits in the ROI calculation for their e-commerce tool. However, because this is a very important aspect of an ROI calculation, some examples on how to calculate intangibles such as customer satisfaction, customer and employee retention, decreased time to market, reduced sales outstanding, and web improvement are discussed in this section.
The ROI Calculator Tool calculates several intangibles such as customer satisfaction, customer and employee retention, decreased time to market, reduced sales outstanding, and web improvement. These measurements are discussed in this section.
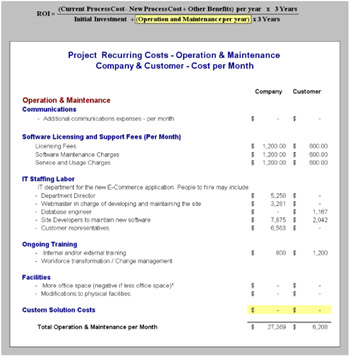
Figure 4: Recurring Costs (Operation and Maintenance)
Customer Satisfaction
Customer satisfaction reduces cost or increases profits in the following areas:
- Increase in customer retention
- Increase in sales
- Increase in customers' Life Time Value (LTV)
- Increase in market share
- Decrease in customer support service
- Reduction in the purchasing decision lead-time, prospect, sale
- Creation of new customer value propositions and profit models
- Enhancement and strengthening of customer relationships
- Leveraging of talent to drive higher productivity improvements
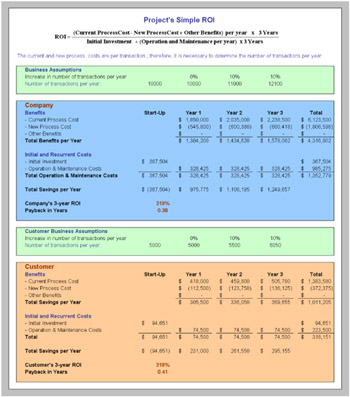
Figure 5: Preliminary Simple ROI Results Without Intangible Benefits
Increasing Customer Retention
Companies are always losing customers and, normally, it costs more to get a new customer than to keep one. That is why there is so much emphasis on retaining customers. The value of a customer to a company is the profit that (s)he brings to the company. Suppose, for example, that ABC, Inc. is losing 10% of its customers a year and would like to implement a Customer Relationship Management (CRM) application with the idea of losing only 4% of its customers. Furthermore, ABC, Inc. is more interested in retaining its more valuable customers rather than those that bring less profitability. Figure 7 shows a customer retention calculation (Synergex, 2001; Novo, 2000).
The following methodology shows how to calculate the different values. First, the customers should be grouped into profitability segments; then it should be determined, of the 10% that ABC is losing, what percentage is in each profitability segment. This calculation is not necessary, but it helps to visualize which segment of the customers ABC, Inc. is losing. This is given by:
- Customers Lost = No. of Cust. x Total % of lost cust. x % per segment
- Customers Lost = 100,000 x 10% x 18% = 1800
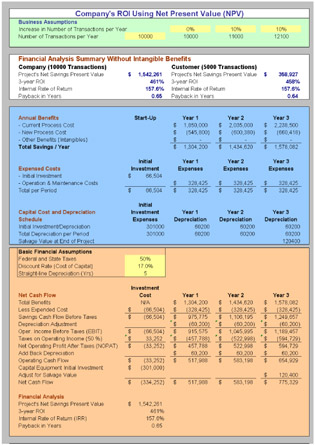
Figure 6: NPV ROI without Intangible Benefits
Second, the number of retained customers in each of the profitability segments that ABC, Inc. would like to have should be determined. This is given by:
- Retained Customers = No. of Cust. x % goal for retined cust. x % per segment
- Retained Customers = 100,000 x 6% x 25% = 1500
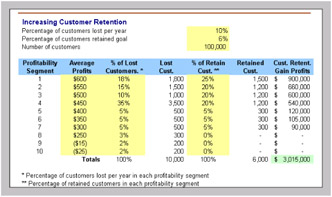
Figure 7: Measuring Customer Retention
Third, the profits that ABC, Inc. will gain by retaining some of the customers that it is currently losing should be calculated. This is given by:
- Gained Profits = No. of Retined Cust. x Profit per segment
- Gained Profits = 1500 x 600 = 900,000
This procedure shows that if ABC, Inc. implements a CRM application that results in retaining some of the customers that it is now losing, ABC, Inc. will have a profit of $3,015,000. The same approach can be used for a company that is gaining more customers than it is losing. The percentage of gained customers can be used instead of the percentage of retained customers.
Customer Life Time Value (CLV)
Many online activities are aimed at retaining customers and the Customer Life Time Value (CLV) can be used to justify the investment by showing projected increase sales or margins (Hansen, 2000, pp. 179–180).
CLV is a measure of the Net Present Value of a customer's profitability for the period, in years, that a customer will remain loyal and keep buying a company's product. It includes the initial cost of getting a new customer.
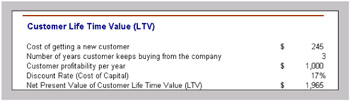
Figure 8: Customer Life Time Value
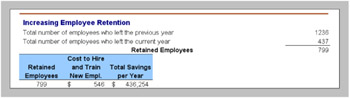
Figure 9: Increasing Employee Retention
Increasing Employee Retention
To determine the savings to a company for increasing employee retention, the number of retained employees should be multiplied by how much it costs a company to hire and train a new employee. In the example below, after implementing an e-business application, a company was able to reduce the number of employees leaving the company in a particular year from 1,236 to 437. If the cost to hire and train a new employee was $546 per employee, then the total savings to the company was $436,254.
Decreasing Time-to-Market
Engineers exchanging information online can reduce the time spent in product development considerably. The main effect of introducing a product earlier to the market is that it brings future sales to the present. The profit to the company is the Net Present Value of those sales.
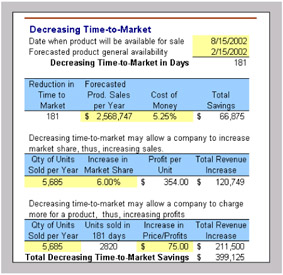
Figure 10: Decreasing Time-to-Market
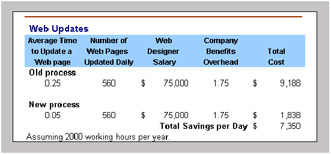
Figure 11: Web Updates
An early product introduction may also allow a company to increase market share or to charge more for the product.
Web Updates
The number of web pages that a company posts on the Internet or on their intranet increases continuously. Updating web pages is costly, and the solution is to update the web pages by using a software application that updates the pages dynamically.
Reduced Days Sales Outstanding (Average Collection Period) and Float
Companies using ABC's Online Tool for Configuring and Pricing Data products will be able to place the order and pay online with a wire transfer by using Electronic Data Interchange (EDI) in their ordering management process. Wire transfers expedite receivables collection by several days.
The benefit to ABC, Inc. for collecting accounts receivable earlier is what a company can earn on those early cash flows; that is, the investment produced when the savings are reinvested or by having to borrow less money to maintain the required cash balance to operate.
Increasing Online Sales
When customers purchase products online, they do not require any assistance, thus reducing the cost of sales. The resulting cost savings can be calculated by determining how long it takes a salesperson to do a sale and multiplying that by his/her salary.
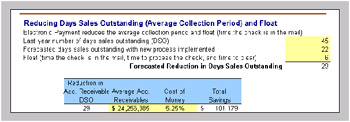
Figure 12: Reducing Collection Period
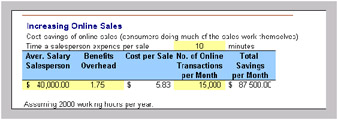
Figure 13: Increasing Online Sales
Providing Online Support
When customers find the information that they need at a company's web site, it saves the company the cost of technical support. A way to calculate the savings of online support is to determine offline and online support costs per unit and then to multiply the difference by the percentage of customers looking for support online.
Finding Information on the Web Site
The calculation of this savings is similar to the savings calculation of Providing Support Online. Determine the number of visitors who will not call the company and multiply it by the cost of each phone call.
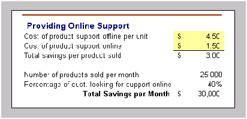
Figure 14: Increasing Online Sales
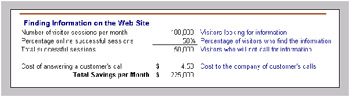
Figure 15: Finding Information on the Web Site
As mentioned previously, there is no specific information available about calculating intangibles in e-commerce. The issue is complex because companies might see the value of an intangible from different perspectives and take different approaches to arriving at a dollar value. Therefore, as part of the IT Governance, each company should create its own library of intangibles values and use it for all ROI calculations.
[1]The Applied Information Economics was developed by Douglas Hubbard and uses concepts in Economics, Statistics, Decision Analysis, Information Theory, and other disciplines to measure intangibles in an ROI calculation. See Appendix A for more information.
Conclusion
The case study, the ROI of an Online Tool for Configuring and Pricing a Data Product, was used to show, step-by-step, how to conduct an ROI calculation. The ROI results were taken directly from the ROI Calculator Tool that includes all the financial formulae. As part of the IT Governance, organizations should develop or purchase a particular ROI calculator and use it for all e-commerce ROI calculations. The use of the same tool for all projects will provide ROI results based on the same standards, in addition to reducing the time needed to prepare a ROI calculation for an e-commerce project.
References
Brassard, M., & Ritter, D. (1994). The memory jogger II, A pocket guide tools for continuous improvement and effective planning (pp. 13–16, 56–62). Methuen, MA: GOAL/QPC.
Brigham, E. F., & Houston, J. F. (1999). Fundamentals of financial management (pp. 502, 548, 496–528). Forth Worth: Harcourt College Publishers.
Byrd, T. A., & Marshall, T. E. (1997). Relating Information Technology investment to organizational performance: A causal model analysis. Omega, 25(1), 43–56.
Byrne, J. (2001). Caught in the Net. Business Week, (August 20), 114.
CIOView. (2001). Financial primer: How to calculate ROI, NPV, Payback and IRR. Available online: http://www.cioview.com/white/finl_primer.htm.
Ferengul, C. (2001). Service management strategies. (November 14), 1. Meta Group.
Friedlob, G. T., & Plewa, F. J. (1996). Understanding return on investment (pp. 184–191, 207–212). New York: John Wiley & Sons.
Gomolski, B. (2001). The cost of e-business. Infoworld, (December 12), 12.
Gordon, D. (2002). Business process analysis: Enhancing organizational effectiveness (p. 3). Dallas, TX: University of Dallas.
Hanson, W. (2000). Principles of Internet marketing (pp. 179–180). Cincinnati, OH: South-Western College Publishing.
Mahmood, M. A., & Mann, G. J. (1993a). Measuring the organizational impact of IT investment: An exploratory study. Journal of Management Information Systems, 10(1), 97–123.
Mahmood, M. A., & Mann, G. J. (1993b). Impact of IT investment: An empirical assessment. Accounting Management and Information Technology, 3(1), 23–32.
Meta Group. (2001). How do I get CRM right in a slowing economy? A third-quarter ROI update. Meta Group.
Novo, J. (2000). Drilling down, turning customer data into profits with a spreadsheet (pp. 17–29). Saint Petersburg: Deep South Publishing Company.
Oleson, T. (2000). The Return on Investment associated with eBusiness and eCommerce. IDC #21462, (February), 35–36.
Rivenbark, W. C.,FitzGerald, K. M.,Schelin, S. H.,Yates, W. H., & Runkle, T. (2001). Information technology investments — Metrics for business decisions (pp. 23, 18–20). Center for Public Technology, Institute of Government, The University of North Carolina at Chapel Hill. Available online: http://www.cpt.unc.edu/pdfs/Final%20Report.pdf.
Rosenthal, R. (2000). ROI, eCommerce, and the metrics that matters: Results from IDC's Internet executive ePanel. IDC #22743, (July), 7–8.
Rosenthal, R. (2000). Using ROI to help a bricks-and-mortar enter eCommerce: DoveBid. IDC #21506, (January), 9.
Sammer, J. (2001). Project ROI. Business Finance Magazine. Available online: http://www.businessfinancemag.com/archives/appfiles/Article.cfm?IssueID=357&ArticleID=13824.
Schlegel, K. (2001). Web & collaboration strategies. (March 27). Meta Group, File: 990.
Shiavi, R.,Bourne, J.,Brodersen, A., & Dawant, M. (1995). Review of Japanese and other quality tools. Vanderbilt University, Introduction to Quality Improvement. Available online: http://www.vanderbilt.edu/Engineering/CIS/Sloan/web/es130/quality/qtooltoc.htm.
Synergex. (2001). Where is the ROI in CRM? Available online: http://www.synergex.com/whitepapers/WhereisROIinCRM.htm.
Woo, C. Y., & Willard, G. (1983). Performance representation in Business Policy Research: Discussion and recommendation. The Twenty-third Annual National Meetings of the Academy of Management, Dallas, Texas, USA.
Wu, J. (2000). Calculating ROI for business intelligence projects. (December 12). Base Consulting Group. Available online: http://www.baseconsulting.com/html/articles_and_white_papers.html.
Endnotes
1 The Applied Information Economics was developed by Douglas Hubbard and uses concepts in Economics, Statistics, Decision Analysis, Information Theory, and other disciplines to measure intangibles in an ROI calculation. See Appendix A for more information.
Appendix A ROI Terminology
A definition of some terms associated with ROI terminology and the pros and cons of using alternative measurements will assist in understanding the measured benefits of a project. The ROI term definitions were compiled from different sources (Rivenbark et al., 2001; Friedlob & Plewa, 1996; CIOView, 2001; Brigham & Houston, 1999).
ROI
The ROI is the total quantitative net savings or return, in hours, dollars, or other measurable units, generated by an initial investment, divided by the total cost of the initial investment. It is the most popular metric. The following are some of the pros and cons:
- Evaluates the earnings derived from a project, an improving effort, or e-commerce application investment as compared to the expended initial investment required to complete the venture.
- Used widely as a key metric to sell IT and e-commerce application investment decisions.
- Indicates the percentage return over a specific period of time without taking into account the magnitude of the project. Would it be better to have 80% ROI in a $20,000 project or 40% ROI in a $200,000 project?
Net Present Value
The Net Present Value is the calculation of the project's cash inflows and outflows discounted to the present time using a pre-selected project Discount Rate or Cost of Capital. The difference between the discounted inflows and outflows is the Net Present Value. A positive NPV means that the project will earn a return greater than an investment would make using the discount rate. A negative NPV means that the company would be better served investing in another project because the project's return is less than the discount rate. The following are some of the pros and cons:
- Helps determine if the project, the improving effort, or the e-commerce investment should be made.
- Gives a direct measure of the project's dollar benefits, but does not explicitly produce a project's rate of return.
- Recognizes the time value of money. Negative NPV: implies that the initiative should be avoided if it is directed at cost reduction. Positive NPV: implies that the assessment should include further risk analysis.
- Does not provide information about when the project savings occur.
- Used to evaluate mutually exclusive projects, especially those that differ in scale and/or timing.
- Used to compare independent projects with approximately the same initial investment. In independent projects, NPV and IRR measurements always lead to the same results; for example, if NPV indicates accept project, IRR also indicates accept project.
Internal Rate of Return
The Internal Rate of Return is the investment yield rate produced by a project when the Net Present Value calculation is used; it is the rate at which the present value of the inflows is equal to the outflows. The IRR is compared to the Project Discount Rate. If the IRR is higher than the Project Discount Rate, the project is selected; if it is lower, the project is rejected. The pros and cons of using IRR for implementing decisions include the following:
- Is the project's expected rate of return.
- Does not give any indication of the magnitude of the project involved.
- Determines the interest rate and then compares this rate to a minimum required rate of return, project discount rate, or cost of capital.
- Is useful in the ranking of IT investment initiatives because they can easily be compared.
- Is very useful for comparing dissimilar initiatives because it is a rate or ratio.
- Is best used in conjunction with Net Present Value.
Payback Period
The Payback Period calculation determines the amount of time, either estimated or measured, that is required for a project, improvement effort, or e-commerce application savings to recoup the initial investment, to show a profit, or to break even. Typically, projects with a short payback period are preferred because they are assumed to indicate a lesser degree of risk. The following are some of the pros and cons:
- Does not provide information about the magnitude of the savings or how the investment performs beyond the payback period.
- Ignores the timing of cash flows.
- Emphasizes liquidity and allows managers greater flexibility in planning for the availability of funds (shorter payback projects).
- Should not be used as sole indicator for a project, improvement effort, or e-commerce application investment.
The Discounted Payback is similar to regular payback, except that the expected cash flows are discounted by the project's cost of capital.
Applied Information Economics (AIE)
AIE, developed by Douglas Hubbard, a principal of Hubbard Ross, applies proprietary scientific and mathematical methods to compute the return on the IT investment — including all intangibles. The following are some of the pros and cons:
- Synthesizes a variety of techniques from scientific and mathematical fields (decision theory, financial theory, and statistics).
- Determines the value of information, methods for modeling uncertainty in estimates, and treating the IT investment as a type of investment portfolio.
Investment
The estimated or measured total cost in hours, dollars, or other units that an improvement effort requires to be planned, executed, and completed.
Cost of Capital
The Cost of Capital is the interest rate that a company has to pay to providers of capital when borrowing capital to implement a particular business or project. Also called Project Discount Rate.
Appendix B Companies Offering ROI Measuring Services
Sometimes organizations are considering e-commerce applications that would require a large financial investment to implement, and they would prefer the help of an external company to prepare the ROI. In doing the research for this paper, the authors have come across names of some companies that offer those services. The authors have neither had any contact with these companies, nor recommend any of them.
The following is a list of companies that provide those services.
- CIOview: http://www.cioview.com/
- Glomark Corp.: http://www.glomark.com/html/index.htm
- Hubbard Ross, LLC.: http://www.hubbardross.com/
Section I - IT Governance Frameworks
- Structures, Processes and Relational Mechanisms for IT Governance
- Integration Strategies and Tactics for Information Technology Governance
- An Emerging Strategy for E-Business IT Governance
Section II - Performance Management as IT Governance Mechanism
- Assessing Business-IT Alignment Maturity
- Linking the IT Balanced Scorecard to the Business Objectives at a Major Canadian Financial Group
- Measuring and Managing E-Business Initiatives Through the Balanced Scorecard
- A View on Knowledge Management: Utilizing a Balanced Scorecard Methodology for Analyzing Knowledge Metrics
- Measuring ROI in E-Commerce Applications: Analysis to Action
- Technical Issues Related to IT Governance Tactics: Product Metrics, Measurements and Process Control
Section III - Other IT Governance Mechanisms
- Managing IT Functions
- Governing Information Technology Through COBIT
- Governance in IT Outsourcing Partnerships
Section IV - IT Governance in Action
EAN: 2147483647
Pages: 182
