Microsoft Performance Monitor
Microsoft Performance Monitor is a Windows 2000 Server application that uses Windows 2000 performance counters to create statistics. It displays the activities and status of the system. Performance Monitor reports both general and specific information in real time. You can use Performance Monitor to collect and display system and device statistics for any Cisco CallManager installation.
Performance Monitor, like the Cisco CallManager Serviceability tool, monitors and logs resource counters from the Cisco CallManager nodes in the network and displays the counters in real time. The update interval could be set to a period between 1 second and 45 days.
Performance Monitor can collect data from multiple systems at once and store it in a single log file. The monitor can then export this log file to a Tab-Separated Values (TSV) file or a Comma-Separated Values (CSV) file that you can view in most spreadsheet applications.
To access Performance Monitor, choose Start > Settings > Control Panel > Administrative Tools and choose Performance.
Note
Extensive monitoring (monitoring a very large number of counters and using short interval times) could cause rising processor usage. Therefore, it is recommended that you use Performance Monitor only for special situations and not as a network management tool.
Microsoft Performance Monitor Report View
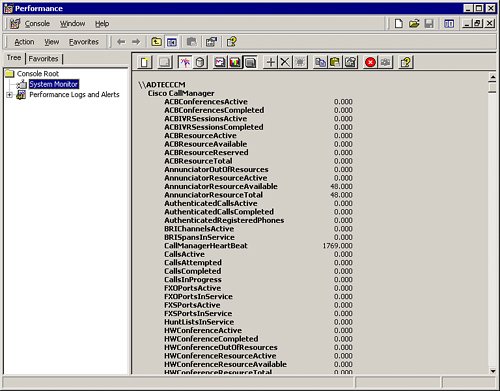
Microsoft Performance Monitor needs to be customized for the parameters related to monitoring Cisco CallManager by choosing the objects, counters, and instances to include. As shown in Figure 31-4, Performance Monitor supports a very concise report view. Many administrators prefer this view because it gives exact figures rather than general estimates on a line chart.
Figure 31-4. Microsoft Performance Monitor Report View

Within Performance Monitor, alarms can be enabled to report certain value thresholds. For example, the number of telephone devices active on Cisco CallManager can be set to a particular level. If the number of devices exceeds that level, the monitor sends a network message alert to the administrator or the person in charge. To create such an alert threshold, right-click Performance Logs and Alerts > Alerts and choose New Alert Settings.
Note
Data collection must be enabled in Cisco CallManager for Performance Monitor to collect data. To verify that data collection is enabled, check the current settings in the Cisco Real-Time Information Server (RIS) Data Collector Service Parameters Configuration window in Cisco CallManager Administration. By default, the Data Collection Enabled parameter is set to True.
Microsoft Performance Monitor Graph and Histogram View
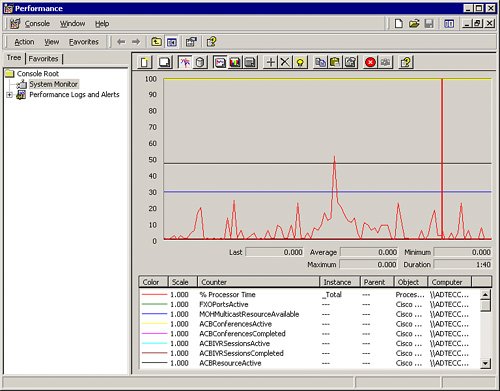
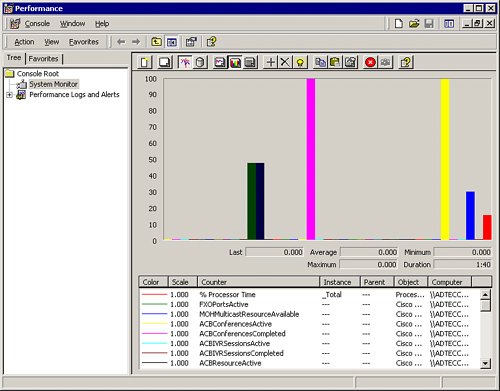
Microsoft Performance Monitor provides graph and histogram graphical views for a visual overview of how the system is currently in use and how it changes.
The graph view (shown in Figure 31-5) is ideal to see the current status of the counters and how they have changed over the most recent period. You can specify the period for status updates and include it in the graph. Using this tool is similar to using a heart-rate monitor. It displays the heartbeat of the monitored performance objects.
Figure 31-5. Microsoft Performance Monitor Graph View

In contrast to graphs, the histogram view (shown in Figure 31-6) shows only the current status of the selected performance object counters. Because it uses only a single bar for each counter, the histogram view is ideal for monitoring many performance counters. To switch between the graph and histogram views, use the graph and histogram icons from the system monitor toolbar or press Ctrl-G (graph) and Ctrl-B (histogram) alternately.
Figure 31-6. Microsoft Performance Monitor Histogram View

Microsoft Windows Task Manager
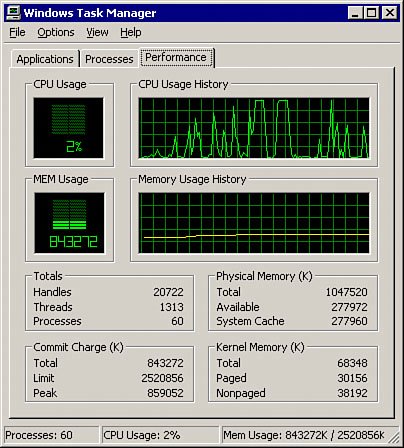
In addition to Microsoft Performance Monitor, you can use Windows Task Manager (shown in Figure 31-7) to get a fast view of the base performance values of CPU and memory usage. The Performance tab of Task Manager shows the CPU and memory usage of the system as a graph and histogram. Moreover, it provides some additional counter values, such as paged kernel memory in plain text. It is an ideal tool to get a quick impression of system health and activity, for example, if the system is working very slowly.
Figure 31-7. Microsoft Windows Task Manager

To access Windows Task Manager, right-click the taskbar and choose Task Manager from the menu or press the Ctrl-Shift-Esc shortcut.
Note
Windows Task Manager influences system performance because it also monitors all system processes and running programs. Therefore, it is recommended that you use it only to get a snapshot of the current situation and not for prolonged monitoring.
Part I: Cisco CallManager Fundamentals
Introduction to Cisco Unified Communications and Cisco Unified CallManager
Cisco Unified CallManager Clustering and Deployment Options
- Cisco Unified CallManager Clustering and Deployment Options
- The Two Sides of the Cisco Unified CallManager Cluster
- Cluster Redundancy Designs
- Call-Processing Deployment Models
- Summary
- Review Questions
Cisco Unified CallManager Installation and Upgrades
- Cisco Unified CallManager Installation and Upgrades
- Cisco Unified CallManager 4.x Clean Installation Process
- Upgrading Prior Cisco Unified CallManager Versions
- Summary
- Review Questions
Part II: IPT Devices and Users
Cisco IP Phones and Other User Devices
Configuring Cisco Unified CallManager to Support IP Phones
- Configuring Cisco Unified CallManager to Support IP Phones
- Configuring Intracluster IP Phone Communication
- IP Phone Configuration
- Case Study: Device Pool Design
- Summary
- Review Questions
Cisco IP Telephony Users
- Cisco IP Telephony Users
- Cisco CallManager User Database
- Cisco CallManager User Configuration
- User Logon and Device Configuration
- Summary
- Review Questions
Cisco Bulk Administration Tool
- Cisco Bulk Administration Tool
- The Cisco Bulk Administration Tool
- Using the Tool for Auto-Registered Phone Support
- Summary
- Review Questions
Part III: IPT Network Integration and Route Plan
Cisco Catalyst Switches
- Cisco Catalyst Switches
- Catalyst Switch Role in IP Telephony
- Powering the Cisco IP Phone
- Data and Voice VLANs
- Configuring Class of Service
- Summary
- Review Questions
Configuring Cisco Gateways and Trunks
- Configuring Cisco Gateways and Trunks
- Cisco Gateway Concepts
- Configuring Access Gateways
- Cisco Trunk Concepts
- Configuring Intercluster Trunks
- SIP and Cisco CallManager
- Summary
- Review Questions
Cisco Unified CallManager Route Plan Basics
- Cisco Unified CallManager Route Plan Basics
- External Call Routing
- Route Plan Configuration Process
- Summary
- Review Questions
Cisco Unified CallManager Advanced Route Plans
- Cisco Unified CallManager Advanced Route Plans
- Route Filters
- Discard Digit Instructions
- Transformation Masks
- Translation Patterns
- Route Plan Report
- Summary
- Review Questions
Configuring Hunt Groups and Call Coverage
- Configuring Hunt Groups and Call Coverage
- Call Distribution Components
- Configuring Line Groups, Hunt Lists, and Hunt Pilots
- Summary
- Review Questions
Implementing Telephony Call Restrictions and Control
- Implementing Telephony Call Restrictions and Control
- Class of Service Overview
- Partitions and Calling Search Spaces Overview
- Time-of-Day Routing Overview
- Configuring Time-of-Day Routing
- Time-of-Day Routing Usage Scenario
- Summary
- Review Questions
Implementing Multiple-Site Deployments
- Implementing Multiple-Site Deployments
- Call Admission Control
- Survivable Remote Site Telephony
- Summary
- Review Questions
Part IV: VoIP Features
Media Resources
- Media Resources
- Introduction to Media Resources
- Conference Bridge Resources
- Media Termination Point Resources
- Annunciator Resources
- Transcoder Resources
- Music on Hold Resources
- Media Resource Management
- Summary
- Review Questions
Configuring User Features, Part 1
- Configuring User Features, Part 1
- Basic IP Phone Features
- Softkey Templates
- Enhanced IP Phone Features
- Barge and Privacy
- IP Phone Services
- Summary
- Review Questions
Configuring User Features, Part 2
- Configuring User Features, Part 2
- Cisco CallManager Extension Mobility
- Client Matter Codes and Forced Authentication Codes
- Call Display Restrictions
- Malicious Call Identification
- Multilevel Precedence and Preemption
- Summary
- Review Questions
Configuring Cisco Unified CallManager Attendant Console
- Configuring Cisco Unified CallManager Attendant Console
- Introduction to Cisco CallManager Attendant Console
- Call Routing and Call Queuing
- Server and Administration Configuration
- Cisco Attendant Console Features
- Summary
- Review Questions
Configuring Cisco IP Manager Assistant
- Configuring Cisco IP Manager Assistant
- Cisco IP Manager Assistant Overview
- Cisco IP Manager Assistant Architecture
- Configuring Cisco IPMA for Shared-Line Support
- Summary
- Review Questions
Part V: IPT Security
Securing the Windows Operating System
- Securing the Windows Operating System
- Threats Targeting the Operating System
- Security and Hot Fix Policy
- Operating System Hardening
- Antivirus Protection
- Cisco Security Agent
- Administrator Password Policy
- Common Windows Exploits
- Security Taboos
- Summary
- Review Questions
Securing Cisco Unified CallManager Administration
- Securing Cisco Unified CallManager Administration
- Threats Targeting Remote Administration
- Securing CallManager Communications Using HTTPS
- Multilevel Administration
- Summary
- Review Questions
Preventing Toll Fraud
- Preventing Toll Fraud
- Toll Fraud Exploits
- Preventing Call Forward and Voice-Mail Toll Fraud Using Calling Search Spaces
- Blocking Commonly Exploited Area Codes
- Using Time-of-Day Routing
- Using FAC and CMC
- Restricting External Transfers
- Dropping Conference Calls
- Summary
- Review Questions
Hardening the IP Phone
Understanding Cryptographic Fundamentals
- Understanding Cryptographic Fundamentals
- What Is Cryptography?
- Symmetric Encryption
- Asymmetric Encryption
- Hash Functions
- Digital Signatures
- Summary
- Review Questions
Understanding the Public Key Infrastructure
- Understanding the Public Key Infrastructure
- The Need for a PKI
- PKI as a Trusted Third-Party Protocol
- PKI Entities
- PKI Enrollment
- PKI Revocation and Key Storage
- PKI Example
- Summary
- Review Questions
Understanding Cisco IP Telephony Authentication and Encryption Fundamentals
- Understanding Cisco IP Telephony Authentication and Encryption Fundamentals
- Threats Targeting the IP Telephony System
- How CallManager Protects Against Threats
- PKI Topologies in Cisco IP Telephony
- PKI Enrollment in Cisco IP Telephony
- Keys and Certificate Storage in Cisco IP Telephony
- Authentication and Integrity
- Encryption
- Summary
- Review Questions
Configuring Cisco IP Telephony Authentication and Encryption
- Configuring Cisco IP Telephony Authentication and Encryption
- Authentication and Encryption Configuration Overview
- Enabling Services Required for Security
- Using the CTL Client
- Working with Locally Significant Certificates
- Configuring the Device Security Mode
- Negotiating Device Security Mode
- Generating a CAPF Report
- Summary
- Review Questions
Part VI: IP Video
Introducing IP Video Telephony
- Introducing IP Video Telephony
- IP Video Telephony Solution Components
- Video Call Concepts
- Video Protocols Supported in Cisco CallManager
- Bandwidth Management
- Call Admission Control Within a Cluster
- Call Admission Control Between Clusters
- Summary
- Review Questions
Configuring Cisco VT Advantage
- Configuring Cisco VT Advantage
- Cisco VT Advantage Overview
- How Calls Work with Cisco VT Advantage
- Configuring Cisco CallManager for Video
- Configuring Cisco IP Phones for Cisco VT Advantage
- Installing Cisco VT Advantage on a Client
- Summary
- Review Questions
Part VII: IPT Management
Introducing Database Tools and Cisco Unified CallManager Serviceability
- Introducing Database Tools and Cisco Unified CallManager Serviceability
- Database Management Tools
- Cisco CallManager Serviceability Overview
- Tools Overview
- Summary
- Review Questions
Monitoring Performance
- Monitoring Performance
- Performance Counters
- Microsoft Event Viewer
- Microsoft Performance Monitor
- Real-Time Monitoring Tool Overview
- Summary
- Review Questions
Configuring Alarms and Traces
- Configuring Alarms and Traces
- Alarm Overview
- Alarm Configuration
- Trace Configuration
- Trace Analysis
- Trace Collection
- Bulk Trace Analysis
- Additional Trace Tools
- Summary
- Review Questions
Configuring CAR
- Configuring CAR
- CAR Overview
- CAR Configuration
- Report Scheduling
- System Database Configuration
- User Report Configuration
- Summary
- Review Questions
Using Additional Management and Monitoring Tools
- Using Additional Management and Monitoring Tools
- Remote Management Tools
- Dependency Records
- Password Changer Tool
- Cisco Dialed Number Analyzer
- Quality Report Tool
- Summary
- Review Questions
Part VIII: Appendix
Appendix A. Answers to Review Questions
Index
EAN: 2147483647
Pages: 329
- Enterprise Application Integration: New Solutions for a Solved Problem or a Challenging Research Field?
- The Effects of an Enterprise Resource Planning System (ERP) Implementation on Job Characteristics – A Study using the Hackman and Oldham Job Characteristics Model
- Context Management of ERP Processes in Virtual Communities
- Data Mining for Business Process Reengineering
- Healthcare Information: From Administrative to Practice Databases
- Article 352 Rigid Nonmetallic Conduit Type RNC
- Article 392 Cable Trays
- Article 408: Switchboards and Panelboards
- Example No. D1(a) One-Family Dwelling
- Example No. D10 Feeder Ampacity Determination for Adjustable-Speed Drive Control [See 215.2, 430.24, 620.13, 620.14, 620.61, Tables 430.22(E), and 620.14]
