THE DFT FREQUENCY RESPONSE TO A COMPLEX INPUT
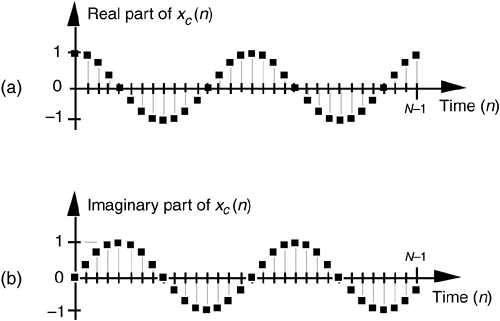
In this section, we'll determine the frequency response to an N-point DFT when its input is a discrete sequence representing a complex sinusoid expressed as xc(n). By frequency response we mean the DFT output samples when a complex sinusoidal sequence is applied to the DFT. We begin by depicting an xc(n) input sequence in Figure 3-40. This time sequence is of the form
Figure 3-40. Complex time-domain sequence xc(n) = ej2pnk/N having two complete cycles (k = 2) over N samples: (a) real part of xc(n); (b) imaginary part of xc(n).


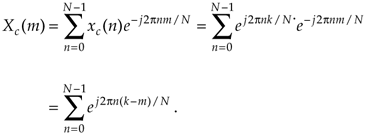
where k is the number of complete cycles occurring in the N samples. Figure 3-40 shows xc(n) if we happen to let k = 2. If we denote our DFT output sequence as Xc(m), and apply our xc(n) input to the DFT expression in Eq. (3-2) we have
Equation 3-61

If we let N = K, n = p, and q = –2p(k–m)/N, Eq. (3-61) becomes
Equation 3-62

Why did we make the substitutions in Eq. (3-61) to get Eq. (3-62)? Because, happily, we've already solved Eq. (3-62) when it was Eq. (3-39). That closed form solution was Eq. (3-41) that we repeat here as
Equation 3-63

Replacing our original variables from Eq. (3-61), we have our answer:
Equation 3-64

Like the Dirichlet kernel in Eq. (3-43), the Xc(m) in Eq. (3-64) is a complex expression where a ratio of sine terms is the amplitude of Xc(m) and the exponential term is the phase angle of Xc(m). At this point, we're interested only in the ratio of sines factor in Eq. (3-64). Its magnitude is shown in Figure 3-41. Notice that, because xc(n) is complex, there are no negative frequency components in Xc(m). Let's think about the shaded curve in Figure 3-41 for a moment. That curve is the continuous Fourier transform of the complex xc(n) and can be thought of as the continuous spectrum of the xc(n) sequence.[] By continuous spectrum we mean a spectrum that's defined at all frequencies, not just at the periodic fs/N analysis frequencies of an N-point DFT. The shape of this spectrum with its main lobe and sidelobes is a direct and unavoidable effect of analyzing any finite-length time sequence, such as our xc(n) in Figure 3-40.
[] Just as we used L'Hopital's rule to find the peak value of the Dirichlet kernel in Eq. (3-44), we could also evaluate Eq. (3-64) to show that the peak of Xc(m) is N when m = k.
Figure 3-41. N-point DFT frequency magnitude response to a complex sinusoid having integral k cycles in the N-point time sequence xc(n) = ej2pnk/N.

We can conceive of obtaining this continuous spectrum analytically by taking the continuous Fourier transform of our discrete xc(n) sequence, a process some authors call the discrete-time Fourier transform (DTFT), but we can't actually calculate the continuous spectrum on a computer. That's because the DTFT is defined only for infinitely long time sequences, and the DTFT's frequency variable is continuous with infinitely fine-grained resolution. What we can do, however, is use the DFT to calculate an approximation of xc(n)'s continuous spectrum. The DFT outputs represented by the dots in Figure 3-41 are a discrete sampled version of xc(n)'s continuous spectrum. We could have sampled that continuous spectrum more often, i.e., approximated it more closely, with a larger DFT by appending additional zeros to the original xc(n) sequence. We actually did that in Figure 3-21.
Figure 3-41 shows us why, when an input sequence's frequency is exactly at the m = k bin center, the DFT output is zero for all bins except where m = k. If our input sequence frequency was k+0.25 cycles in the sample interval, the DFT will sample the continuous spectrum shown in Figure 3-42, where all of the DFT output bins would be nonzero. This effect is a demonstration of DFT leakage described in Section 3.8.
Figure 3-42. N-point DFT frequency magnitude response showing spectral leakage of a complex sinusoid having k+0.25 cycles in the N-point time sequence xc(n).

Again, just as there are several different expressions for the DFT of a rectangular function that we listed in Table 3-2, we can express the amplitude response of the DFT to a complex input sinusoid in different ways to arrive at Table 3-3.
At this point, the thoughtful reader may notice that the DFT's response to a complex input of k cycles per sample interval in Figure 3-41 looks suspiciously like the DFT's response to an all ones rectangular function in Figure 3-32(c). The reason the shapes of those two response curves look the same is because their shapes are the same. If our DFT input sequence was a complex sinusoid of k = 0 cycles, i.e., a sequence of identical constant values, the ratio of sines term in Eq. (3-64) becomes
which is identical to the all ones form of the Dirichlet kernel in Eq. (3-48). The shape of our Xc(m) DFT response is the sinc function of the Dirichlet kernel.

Table 3-3. Various Forms of the Amplitude Response of the DFT to a Complex Input Sinusoid Having k Cycles in the Sample Interval
|
Description |
Expression |
|---|---|
|
Complex input DFT amplitude response in terms of the integral frequency variable m [From Eq. (3-64)] |
Equation 3-65
|
|
Alternate form of the complex input DFT amplitude response in terms of the integral frequency variable m [based on Eq. (3-49)] |
Equation 3-66
|
|
Amplitude normalized complex input DFT response in terms of the integral frequency variable m |
Equation 3-67
|
|
Complex input DFT response in terms of the sample rate fs in Hz |
Equation 3-68
|
|
Amplitude normalized complex input DFT response in terms of the sample rate fs in Hz |
Equation 3-69
|
|
Amplitude normalized complex input DFT response in terms of the sample rate ws |
Equation 3-70
|
URL http://proquest.safaribooksonline.com/0131089897/ch03lev1sec14
 |
Amazon |  |


