Appendix D. Accuracy of Pi Model
The transfer function H for a transmission line may be expressed in terms of the Taylor-series approximation for the exponential function.
Equation D.1
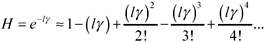
|
where |
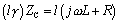
g is the propagation coefficient for the transmission line (complex nepers/m), and |
|
l is the length of the line (m). |
The inverse of this function is similarly defined for negative exponents:
Equation D.2
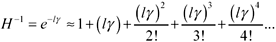
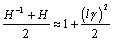
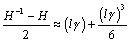
Taking only the first four terms of each expression, you can derive approximate formulas for the forms of H used in the calculation of system gain (Appendix C).
Equation D.3
Equation D.4
Now substitute approximations [D.3] and [D.4] into the expression for the gain of a fully configured transmission system [C.17].
Equation D.5
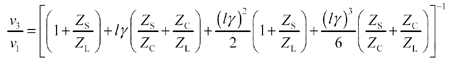
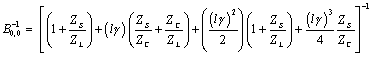
The next calculations compare [D.5] with the expression for the gain of a pi-model circuit in Section 3.4.2, Figure 3.4. The two-port transmission matrix for the pi-model circuit, fully configured with source and load impedances Z S and Z L respectively, is a composite of five two-port mini-models. The first (leftmost) matrix represents the series-connected source impedance. The next three represent the components in the pi-model. The last matrix represents the shunt-connected load impedance.
Equation D.6
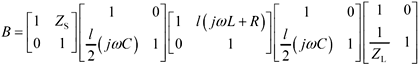
The expression for the circuit gain follows :
Equation D.7
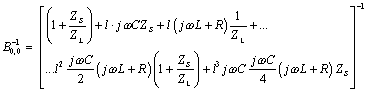
Next use the definitions of 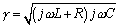 and
and 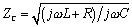 to derive the following substitutions:
Equation D.8
Equation D.9

Plugging these new substitutions back into [D.7] leads to the following expression for the gain of the pi-model circuit.
Equation D.10
Comparing [D.10] with [D.5] reveals a perfect match of all zero-, first-, and second-order terms, with the lowest -order difference showing up in the third-order part of the expression. Assuming a small value of the propagation coefficient l g < 1/4, and thereby an overall gain somewhere near unity, you might reasonably conclude that the modeling error should not exceed the difference between [D.5] and [D.10]
Equation D.11
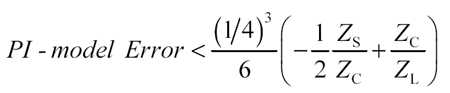
Further assuming the ratios Z S /(2 Z C ) and Z C / Z L to each be less than 3.8, the resulting pi-model error (measured as a function of frequency) should remain less than 1%.
As the coefficient l g grows, so grows the error in proportion to (at least) the third power of l g . At a value of l g < 1/2, you should expect a modeling accuracy no better than 1 part in 10.
Fundamentals
- Impedance of Linear, Time-Invariant, Lumped-Element Circuits
- Power Ratios
- Rules of Scaling
- The Concept of Resonance
- Extra for Experts: Maximal Linear System Response to a Digital Input
Transmission Line Parameters
- Transmission Line Parameters
- Telegraphers Equations
- Derivation of Telegraphers Equations
- Ideal Transmission Line
- DC Resistance
- DC Conductance
- Skin Effect
- Skin-Effect Inductance
- Modeling Internal Impedance
- Concentric-Ring Skin-Effect Model
- Proximity Effect
- Surface Roughness
- Dielectric Effects
- Impedance in Series with the Return Path
- Slow-Wave Mode On-Chip
Performance Regions
- Performance Regions
- Signal Propagation Model
- Hierarchy of Regions
- Necessary Mathematics: Input Impedance and Transfer Function
- Lumped-Element Region
- RC Region
- LC Region (Constant-Loss Region)
- Skin-Effect Region
- Dielectric Loss Region
- Waveguide Dispersion Region
- Summary of Breakpoints Between Regions
- Equivalence Principle for Transmission Media
- Scaling Copper Transmission Media
- Scaling Multimode Fiber-Optic Cables
- Linear Equalization: Long Backplane Trace Example
- Adaptive Equalization: Accelerant Networks Transceiver
Frequency-Domain Modeling
- Frequency-Domain Modeling
- Going Nonlinear
- Approximations to the Fourier Transform
- Discrete Time Mapping
- Other Limitations of the FFT
- Normalizing the Output of an FFT Routine
- Useful Fourier Transform-Pairs
- Effect of Inadequate Sampling Rate
- Implementation of Frequency-Domain Simulation
- Embellishments
- Checking the Output of Your FFT Routine
Pcb (printed-circuit board) Traces
- Pcb (printed-circuit board) Traces
- Pcb Signal Propagation
- Limits to Attainable Distance
- Pcb Noise and Interference
- Pcb Connectors
- Modeling Vias
- The Future of On-Chip Interconnections
Differential Signaling
- Differential Signaling
- Single-Ended Circuits
- Two-Wire Circuits
- Differential Signaling
- Differential and Common-Mode Voltages and Currents
- Differential and Common-Mode Velocity
- Common-Mode Balance
- Common-Mode Range
- Differential to Common-Mode Conversion
- Differential Impedance
- Pcb Configurations
- Pcb Applications
- Intercabinet Applications
- LVDS Signaling
Generic Building-Cabling Standards
- Generic Building-Cabling Standards
- Generic Cabling Architecture
- SNR Budgeting
- Glossary of Cabling Terms
- Preferred Cable Combinations
- FAQ: Building-Cabling Practices
- Crossover Wiring
- Plenum-Rated Cables
- Laying Cables in an Uncooled Attic Space
- FAQ: Older Cable Types
100-Ohm Balanced Twisted-Pair Cabling
- 100-Ohm Balanced Twisted-Pair Cabling
- UTP Signal Propagation
- UTP Transmission Example: 10BASE-T
- UTP Noise and Interference
- UTP Connectors
- Issues with Screening
- Category-3 UTP at Elevated Temperature
150-Ohm STP-A Cabling
- 150-Ohm STP-A Cabling
- 150- W STP-A Signal Propagation
- 150- W STP-A Noise and Interference
- 150- W STP-A: Skew
- 150- W STP-A: Radiation and Safety
- 150- W STP-A: Comparison with UTP
- 150- W STP-A Connectors
Coaxial Cabling
- Coaxial Cabling
- Coaxial Signal Propagation
- Coaxial Cable Noise and Interference
- Coaxial Cable Connectors
Fiber-Optic Cabling
- Fiber-Optic Cabling
- Making Glass Fiber
- Finished Core Specifications
- Cabling the Fiber
- Wavelengths of Operation
- Multimode Glass Fiber-Optic Cabling
- Single-Mode Fiber-Optic Cabling
Clock Distribution
- Clock Distribution
- Extra Fries, Please
- Arithmetic of Clock Skew
- Clock Repeaters
- Stripline vs. Microstrip Delay
- Importance of Terminating Clock Lines
- Effect of Clock Receiver Thresholds
- Effect of Split Termination
- Intentional Delay Adjustments
- Driving Multiple Loads with Source Termination
- Daisy-Chain Clock Distribution
- The Jitters
- Power Supply Filtering for Clock Sources, Repeaters, and PLL Circuits
- Intentional Clock Modulation
- Reduced-Voltage Signaling
- Controlling Crosstalk on Clock Lines
- Reducing Emissions
Time-Domain Simulation Tools and Methods
- Ringing in a New Era
- Signal Integrity Simulation Process
- The Underlying Simulation Engine
- IBIS (I/O Buffer Information Specification)
- IBIS: History and Future Direction
- IBIS: Issues with Interpolation
- IBIS: Issues with SSO Noise
- Nature of EMC Work
- Power and Ground Resonance
Points to Remember
Appendix A. Building a Signal Integrity Department
Appendix B. Calculation of Loss Slope
Appendix C. Two-Port Analysis
- Appendix C. Two-Port Analysis
- Simple Cases Involving Transmission Lines
- Fully Configured Transmission Line
- Complicated Configurations
Appendix D. Accuracy of Pi Model
Appendix E. erf( )
Notes
EAN: N/A
Pages: 163
