Troubleshooting Scripts and Calculations
There are many specific areas of potential trouble in FileMaker, and we'll get to those in the next section. Here, though, we want to discuss some general principles for dealing with errors in scripts and calculations.
Handling Errors in Scripts
Many FileMaker actions can result in an error. Error in this context can mean any exceptional condition that needs to be reported to the user. This can be something as simple as a search that returns no records or a field that fails to pass validation, or it can be a more esoteric error involving something like a missing key field. In general, in the normal operation of FileMaker, these errors get reported to the user via a dialog box of some kind, often with some sort of choice as to how to proceed.
For example, as shown in Figure 17.3, if a user performs a search that finds no records, she gets a dialog alerting her to the error and she has the option to go back and redefine her search.
Figure 17.3. FileMaker generally provides a lot of feedback on error conditions, such as this "no records found" message.
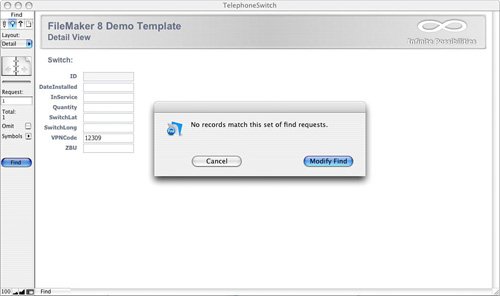
This is fine, up to a point. But you, the developer, may not want the user to see this default FileMaker dialog. You may want to present a different message, or none at all. Well, if your user performs her searches by dropping into Find mode, filling in some search criteria, and clicking the Find button, there's not much you can do. But if your user is performing a find via a script that you've written, you can intervene in such situations.
Note
 |
Using the Custom Menus feature of FileMaker Pro 8 Advanced, you can now bridge the gap between applications that rely mostly on the native, menu-driven functionality of FileMaker and those that provide much of their functionality through scripts. Using Custom Menus, you can override selected menu items from the regular FileMaker menu set and attach your own scripted functionality to them. You could, for example, replace the generic Find command in FileMaker's View menu with a menu item called Find Customers, and tie that menu item to a specific, customized Find script of your own devising. |
|
For more on custom menus, see "Working with Custom Menus," p. 373. |
There's a very important script step called Set Error Capture. It's worth your while to become familiar with it. This step allows you to tell FileMaker whether or not to suppress error messages while your script is running. The use of the step is shown in Figure 17.4.
Figure 17.4. The Set Error Capture script script step is useful for controlling how FileMaker errors are displayed to the user.
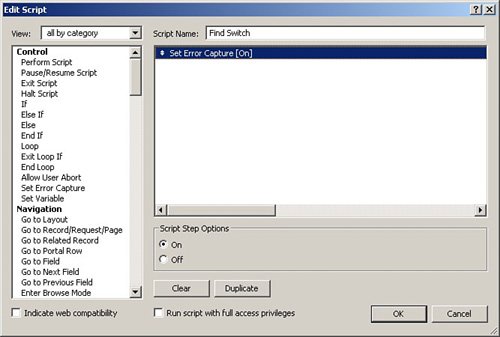
If this step is not present in a script, or if it's present and set to "off," FileMaker reports errors to the user directly. If your script performs a search, and no records are found, your users see the usual FileMaker dialog box for that situation (shown in Figure 17.3). However, if you have error capture set to "on," the user sees no visible response of any kind. After you've set the error capture state (on or off), this setting is carried down through all subscripts as well, unless you explicitly disable it by using Set Error Capture [Off] somewhere down in a subscript.
In general, you don't just turn error capture on and walk away. In fact, error capture obliges you to do a lot more work than you normally might. With error capture on, FileMaker error dialogs are suppressed, so it's up to you to check for errors and either handle them or inform the user of those that are important.
As an example of custom error handling, suppose that you've built a system that primarily stores text content in a variety of forms: press releases, biographies, articles, and so on. If a user does a search in one area and finds no results, you'd like to offer the option to search in other areas as well. Rather than let FileMaker intervene and show the standard No Records Found dialog, you want to pop up a custom dialog that allows the user to run a different scripted search on a different table or just give up. The script might look like the one in Figure 17.5.
Figure 17.5. Within a script, you can use Set Error Capture to hide the usual error messages and display custom feedback to the user.
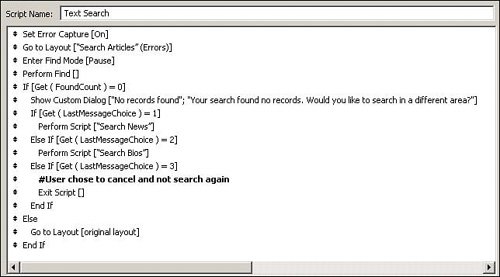
Here, Set Error Capture is turned on and the script is configured to check whether the user's search found any records. If so, he's sent to the article list. If not, the custom dialog with other search choices is offered. If he picks a different type of search, the appropriate script runs; otherwise the script is exited and he is left where he was.
In addition to checking for specific conditions (such as a found count of zero), it's also possible to check more generically to determine whether the previous script step produced an error. This technique was shown in Listing 17.1, which used the Get(LastError) function. This function returns whatever error code was produced by the most recent operation. An error code of 0 means "no error." Otherwise, an error of some kind has occurred. In Listing 17.1, as written, it didn't matter too much exactly which error had occurredit was enough to know that some error had happened.
|
For a complete listing and description of FileMaker error codes, see Chapter 11, "FileMaker Error Codes," in FileMaker 8 Functions & Scripts Desk Reference. |
Get(LastError) can be tricky. It reports on the most recent action taken no matter whether the action was triggered directly by a user or by a script. Let's say you have the following script fragment:
Set Error Capture [On]
Perform Find[]
Go To Layout ["Search Results"]
If[ Get(LastError)<>0 ]
 Show Message ["An error has occurred"]
End If
This is not going to do quite what you would hope. If the Perform Find script step found no records, at that point the "last error" would be 401 (the code for "no records found"). But after the Go To Layout step runs, that error code no longer applies. If that step runs successfully (which it might not if, for example, the particular user didn't have privileges to view that layout), the last error code would now be 0. So, if you want to check for errors, check for them at the exact point of possible failure, not a couple of steps down the road.
Note also that the concept of "last error" is specific to each client session. This means that if another user, in his session, generates an error, this has no effect on the "last error" status in other sessions.
Tracking Down Errors
Suppose that, despite your best efforts at defensive programming, some aspect of your system just doesn't work right. (Actually, you don't need to suppose. This will happen, and what's more, it'll happen after the software is delivered. That's not cynicism; it's just reality.) When this happens, of course, you'll want to track the problem down and fix it. There are a couple of verbs you'll want to keep in mind: reproduce and isolate.
Reproducing Errors
The first thing to do with any problem is to render it reproducible. Bugs that occur only occasionally are a programmer's worst nightmare. Often the circumstances are clear and entirely reproducible: "If I hit Cancel in the search script, I end up on some goofy-looking utility layout, instead of back at the main search screen." At other times, the problem is more slippery: "Sometimes, when I mark an invoice as closed, the system creates a duplicate of that invoice!"
If the bug is not transparently reproducible, you need to gather as much data on the bug as you can. Who experienced it? What type of computer and what operating system? Has it been experienced by one user, or several? Does it appear consistently? Look for hidden patterns. Does it occur more at certain times of day? Only from specific computers? Only for a particular account or privilege set? Only during the last week of the fiscal quarter? And so on.
Reproducing the bug should be your first priority because you can't isolate it until it's reproducible, and isolating it is your best means of fixing it.
You might find that you, yourself, are unable to make the bug happen. This may be a sign that you are using the software differently from your users. Your usage pattern may never cause the bug to happen. One way to leap this hurdle is just to sit down with a user and watch him work. You might find that he's using a feature of the software differently than you had intended or expected, or that he performs functions in a different order. This may give you the clue you need.
What if, despite all these efforts, the bug remains elusive? You can see its tracks but can't catch it. Well, you have a few choices. One is to program around it. If users report that, very occasionally, they get duplicate invoices when they close an invoice, you can rewrite the invoice-closing script to check for duplicates and eliminate an extra one when it appears. This doesn't eliminate the bug, but it does repair the effects. This is a distinctly less-than-perfect solution, but if it solves the problem and makes the system work again, that's what counts. But the bug is still in there, possibly causing other mischief.
Another possibility is to try to do some kind of logging. For example, in the duplicate invoice case, you could add some logic to the Close Invoice script. In addition to all the work it normally does, it would also create an entry in a new Log table. It would write out the time the script was run, the username, the system IP address, and the platform. Then, at the end of the script, it would check for duplication and log the findings. Even if you were programming around the bug at this point, to buy time, you could still use this log information to try to pin down the bug. Let the system run for a month, and then look at the log and try to pick out any patterns in when the bug happens.
Debugging Calculations
After you've reproduced the bug (you hope), it's time to isolate it. Let's think about calculations for a moment. Suppose that you have a complex calculation like the one in Listing 17.2. This calculation expresses a person's age (the DOB field) as something like "38 years, 5 months, 9 days."
Listing 17.2. Complex Calculation Example
|
[View full width] Let( [ Today = Get(CurrentDate); DOBDay=Day(DOB); TodayDay = Day(Today) ] ; GetAsText(Year(Today) - Year(DOB) - Case(Today< Date(Month(DOB); DOBDay; Year(Today)); 1; |
Actually, as written, the calculation does have a bug, and will generally give the wrong value for the Days element. How do you debug this lengthy calculation?
Note
Lengthy though this calculation is, FileMaker's Let statement makes the formula much more readable, and hence easier to debug.
One nice thing about this calculation is that it's actually three smaller calculations merged into one. To isolate the problem in this calculation, you need to examine each individual piece and see whether it gives the expected result. Here you could pull out just the piece that computes the Days value, like so:
[View full width]
Let( [ Today = Get(CurrentDate); DOBDay=Day(DOB); TodayDay = Day(Today) ] ; /* GetAsText(Year(Today) - Year(DOB) - Case(Today< Date(Month(DOB); DOBDay; Year(Today)); 1;  0)) & "Years," & GetAsText(Mod(Month(Today) - Month(DOB) + 12 - Case(TodayDay <> DOBDay; 1; 0); 12)) & "Months," & */ GetAsText(TodayDay - DOBDay + Case(TodayDay >= DOBDay; 0; Day(Today- TodayDay) < DOBDay; DOBDay; Day(Today - TodayDay))) & "Days")
In the preceding example, two subunits of logic have been commented out so that the calculation now performs only the logic of the third unit, relative to the Days figure. Selective commenting like this is a powerful debugging technique, especially if your calculations are nicely modularized using the Let function.
You'll find this subunit behaves the same way when isolated from the rest of the calculation, and now your problem has shrunk in size. It shouldn't take you long to find that the <> (not equals) in the second line is a slip of the hand, and should just be < (less than).
As a general rule, we recommend that you debug complex calculations by breaking them down into smaller pieces and using techniques like those above to test subunits of the calculation code. This suggestion contains a strong implication for how you should build complex calculations in the first place: Define and test the smaller pieces of functionality first, and then add additional pieces to the calculation. Or, if there's anything at all reusable in the smaller pieces, don't just fold them into a larger calculation, but define them as custom functions instead.
Tip
For easy debugging of calculation fragments like the one shown previously, you have a couple of choices. If you're not using FileMaker Pro Advanced (and you probably should be!), you can define two new fields in the problem table: a CalcSource field (which holds a calculation fragment), and a CalcEval field (well, the names can be whatever you like) that's a calculation defined as Evaluate(CalcSource). Anything you cut and paste from the problem calc into the CalcSource field will be evaluated by the CalcEval field. This beats defining entirely new fields to hold your calculation fragments.
|
If you're using FileMaker Pro Advanced, the Evaluate Now feature of the FileMaker Advanced Data Viewer will let you evaluate any calculation or expression on the fly, and it can act as a kind of scratchpad for calculation testing. |
The key to the idea of isolation is specifically to isolate the broken part. Pull out the pieces that are known to work. As you test each piece, remove it if it tests out correctly. As you do this, the area that contains the problem grows smaller and smaller.
Debugging Scripts
|
The principle of isolation applies to scripts as well as to calculations. Your problem may lie inside one script, or you might have a complex chain of scripts and subscripts that's exhibiting failure. By far the best tools available for this are the Script Debugger and the Data Viewer, which are part of FileMaker Pro 8 Advanced. The Data Viewer is an extremely handy addition in FileMaker 8. |
The Script Debugger vastly simplifies the process of script debugging, which once upon a time (prior to FileMaker 7) relied chiefly on the insertion of numerous Pause Script and Show Message script steps! But debugging scripts is still not an automatic process. In this section, we'll walk you through the tools and how to use them.
About the Script Debugger
The Script Debugger (and its close companion the Data Viewer) are tools that are available only in FileMaker Pro Advanced. This alone is reason enough to invest in Advanced. Trying to troubleshoot a complex script without reasonable debugging tools is a bit like trying to assemble a jigsaw puzzle with your eyes closed. It's not strictly impossible, but it's much harder than it needs to be.
Script debugging can be enabled or disabled from within FileMaker Advanced at any time by choosing Debug Scripts from the Tools menu. The next time a script is triggered, whether by clicking a button, opening a file, or some other means, the Script Debugger will appear. The Script Debugger interface is shown in Figure 17.6.
Figure 17.6. The Script Debugger enables you to watch and control the flow of a script.
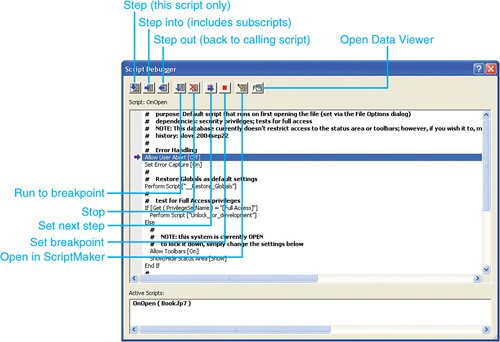
Using the Script Debugger, you can step through a script line by line as it executes. You can see when and whether it follows a certain logical path (which branch gets followed when it encounters an If statement, for example), when and how it breaks out of a loop, and which subscripts it calls, for example. Using the Data Viewer, you can see how record and calculation data change as the script runs (we'll say more about the Data Viewer later on).
Figure 17.6 shows the tools available in the Script Debugger. Most of them have to do with controlling the flow of the script. In general, you'll want to step through the script line by line (using the Step command), but you'll also often want to follow the execution path into subscripts (the Step Into command). Sometimes, when you're inside a subscript, you might want to finish with the subscript and start debugging step-by-step again back in the parent script (the Step Out command).
You can also stop the script altogether, open it in ScriptMaker, or use the breakpoint features to allow even more precise control over script execution. We discuss breakpoints in the following section.
Placing Breakpoints
The Script Debugger enables you to place a breakpoint in a script so that execution stops there and you can see what's happening. In theory, if you have a troublesome script or script chain, you could place a breakpoint at the very start and step through the script. But if this is a lengthy script chain, or one than contains a loop that might run many times, this may not be very time effective.
Consider a case where you have a complex set of scripts that call each otherlet's say that there are three scripts total. Somewhere in the middle of that script, a date field on the current record is getting wiped out, but you don't know where.
In a case like this, you can use a classic isolation technique called binary search. If you have no idea where the problem is happening, place a breakpoint more or less in the middle of everything, say halfway through script #2. Turn on the Script Debugger, let the script run, and see whether the field has been wiped out by the time you stop at the breakpoint. If the problem has already occurred, move the breakpoint to around the midpoint of the first half of the script chain (that is, 25%) and try again. If it hasn't happened by the 50% mark, move the breakpoint to 75%. Repeat until you narrow the possible range to one or two lines. This may sound like it's not much of a time-saver, but using this technique can find the error in a script of over 1,000 lines using at most ten of these check-and-move operations.
Tip
If you have to a debug a looping script, it's worthwhile to try to reduce the number of records on which the script runs. In general, if you need to debug the loop itself, one internal breakpoint should suffice at first, either at the beginning or end of the loop.
Inspecting Values
One of the most important uses of a debugger is to watch certain values and see how they change. These could be database fields, global variables, or aspects of FileMaker state such as the current layout.
|
FileMaker Pro 8 Advanced adds a new debugging tool called the Data Viewer. Using this tool, you can monitor any number of data values at a time. Previously, you might have had to create special debugging layouts to display the information you wanted, but the Data Viewer makes all that go away. You can display the Data Viewer at any time, though you'll probably use it most often while debugging scripts. |
Like the Debug Scripts option, you can find the Data Viewer in the Tools menu of FileMaker Pro Advanced. The Data Viewer presents a list of expressions, along with the current value of each expression. This view is shown in Figure 17.7.
Figure 17.7. FileMaker's Data Viewer, with a list of expressions being monitored.
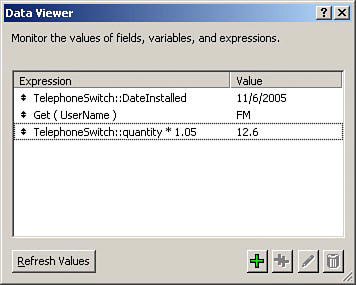
So, what's an expression? Probably the best way to think of it is anything you can type into a calculation dialog box. If you can type it into a calculation dialog window, click OK, and have FileMaker accept it without warning of any errors, it's a valid expression. For example, the following are all expressions:
CustomerID // the name of a field

Product::ProductID // the name of a related field

MyHighlight(InvoiceDate) // a call to a custom function

Quantity * 1.05 // a math expression involving a field
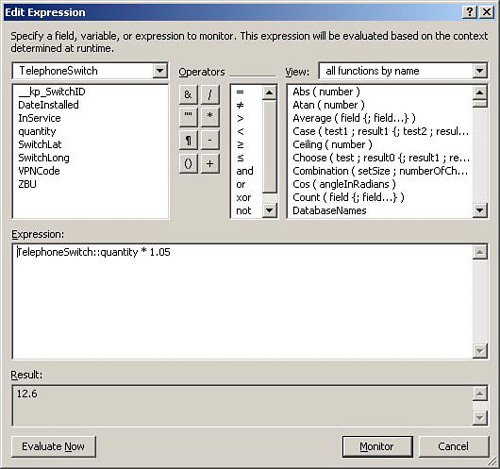
The Data Viewer has its own interface for defining expressions, shown in Figure 17.8. It's almost identical to the regular calculation dialog box but adds the button called Evaluate Now. Clicking it will put the expression's result into the Result box down below. This is quite a nifty "sleeper" feature. If you are trying to build a complex calculation, you can use the Data Viewer's Evaluate Now feature to test the calculation, or pieces of it, very rapidlyno need to define a custom function or calculation field, save the changes, and go look at data on a record layout. Like the Script Debugger, the Data Viewer is a floating window that will hover above your other windows as you work.
Figure 17.8. The Data Viewer's expression builder presents an interface very similar to the Define Calculation dialog box.
Tip
Use the Evaluate Now feature of the Data Viewer (available only in FileMaker Pro 8 Advanced) as a calculation scratch pad for testing calculations or calculation expressions before reusing them in custom functions or calculation fields.
As an example of a typical use of the Data Viewer, consider the example of a script that mysteriously clears out a field. You'd like to step through the script line by line and find out when that happens. Your first step is to bring up the Data Viewer, create a new expression, and type the name of the field in question as your expression. When the expression appears in the Data Viewer window, it's being monitored, and you can turn on Debug Scripts (if it's not on already) and run your script. Using the various stepping operations, you can move slowly through the script, watching the expressions you're monitoring and seeing how they change. In this case, you can watch the field expression and pin down the exact step where the field gets cleared.
The Data Viewer is a critical tool in FileMaker troubleshooting, and we heartily recommend you become familiar with it.
Interactive Call Stack
|
There's one more convenient addition to the Script Debugger in FileMaker 8. It's sometimes called the interactive call stack. It's always been the case that, if you're debugging a script that in turn calls other scripts, the Script Debugger will show you any parent or grandparent that might have called the current script. This call chain, or call stack, as it's sometimes known, is shown near the bottom of the Script Debugger. Figure 17.9 shows this tool in use. |
Figure 17.9. The interactive call stack enables you to flip backward to previous scripts in the call chain.
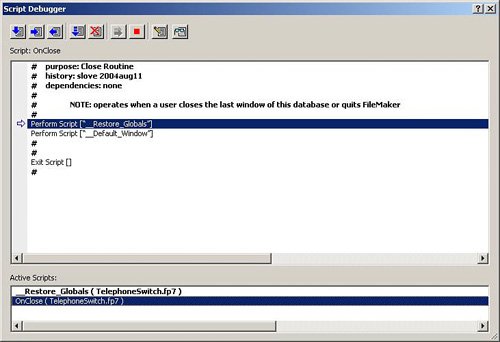
In FileMaker Pro 8 Advanced, not only can you see the call chain, but if you click on a script further up the call chain, the script will now display that script in the main window, along with a marker that shows where the flow of control left that script (usually at a Perform Script step). This is a handy convenience if you need to be reminded of what steps brought you to the current location in the current script.
Troubleshooting in Specific Areas Performance, Context, Connectivity, and Globals |
Part I: Getting Started with FileMaker 8
FileMaker Overview
- FileMaker Overview
- FileMaker and Its Marketplace
- Introduction to Database Software
- FileMaker Deployment Options
- Whats New in FileMaker Pro 8
Using FileMaker Pro
- Getting Started
- Working in FileMaker Pro
- Troubleshooting
- FileMaker Extra: Becoming a FileMaker Pro Power User
Defining and Working with Fields
- Defining and Working with Fields
- Working Under the Hood
- Working with Fields
- Working with Field Types
- Assigning Field Options
- Troubleshooting
- FileMaker Extra: Indexing in FileMaker
Working with Layouts
- Working with Layouts
- Whats a Layout?
- Creating and Managing Layouts
- Working with Parts
- Working with Objects on a Layout
- Working with the Tab Control Object
- Working with Fields
- Portals
- Troubleshooting
- FileMaker Extra: Designing Cross-PlatformFriendly Layouts
Part II: Developing Solutions with FileMaker
Relational Database Design
- Relational Database Design
- Understanding Database Design
- Database Analysis
- Working with Entities and Attributes
- Understanding Relationships
- Relationship Optionality
- Understanding the Role of Keys in Database Design
- Many-to-Many Relationships: Solving the Puzzle
- The Basics of Process Analysis
- FileMaker Extra: Complex Many-to-Many Relationships
Working with Multiple Tables
- Working with Multiple Tables
- Multitable Systems in FileMaker Pro
- Creating a One-to-Many Relationship in FileMaker
- Working with Keys and Match Fields
- Understanding Table Context
- Working with Related Data
- Creating a Many-to-Many Relationship
- Relational Integrity
- Rapid Multitable Development
- Troubleshooting
- FileMaker Extra: Building a Three-Way Join
Working with Relationships
- Working with Relationships
- Relationships Graphs and ERDs
- Relationships as Queries
- Creating Self-Relationships
- Creating Ranged Relationships
- Creating Cross-Product Relationships
- Working with Data from Distant Tables
- Working with Multiple Files
- How and When to Use Multiple Files
- Troubleshooting
- FileMaker Extra: Managing the Relationships Graph
Getting Started with Calculations
- Getting Started with Calculations
- Understanding How and Where Calculations Are Used
- Exploring the Calculation Dialog Box
- Essential Functions
- Using Conditional Functions
- Aggregate Functions
- Learning About the Environment
- Troubleshooting
- FileMaker Extra: Tips for Becoming a Calculation Master
Getting Started with Scripting
- Getting Started with Scripting
- Scripts in FileMaker Pro
- Creating Scripts
- Common Scripting Topics
- Triggering Scripts
- Working with Buttons on Layouts
- Troubleshooting
- FileMaker Extra: Creating a Script Library
Getting Started with Reporting
- Getting Started with Reporting
- Deriving Meaning from Data
- Working with Lists of Data
- Summarized Reports
- Delivering Reports
- Troubleshooting
- FileMaker Extra: Incorporating Reports into the Workflow
Part III: Developer Techniques
Developing for Multiuser Deployment
- Developing for Multiuser Deployment
- Developing for Multiple Users
- Sessions in FileMaker Pro
- Concurrency
- Audit Trails in FileMaker Pro
- Launch Files
- Troubleshooting
- FileMaker Extra: Development with a Team
Implementing Security
- Approaching Security
- User-Level Internal Security
- File-Level Access Security
- Troubleshooting
- FileMaker Extra: Working with Multiple Files
Advanced Interface Techniques
- Advanced Interface Techniques
- User Interfaces in FileMaker Pro
- Navigation
- Multiwindow Interfaces
- Working with Custom Menus
- Showing/Hiding Layout Elements
- Dedicated Find Layouts
- Data Presentation
- Working with Table View
- Troubleshooting
- FileMaker Extra: User Interface Heuristics
Advanced Calculation Techniques
- Advanced Calculation Techniques
- Whats an Advanced Calculation Technique?
- Logical Functions
- Text Formatting Functions
- Array Functions
- The Filter-ing Functions
- Custom Functions
- GetNthRecord
- Troubleshooting
- FileMaker Extra: Creating a Custom Function Library
Advanced Scripting Techniques
- Advanced Scripting Techniques
- What Is Advanced Scripting?
- Script Parameters and Script Results
- Script Variables
- Window Management Techniques
- Go to Related Record
- Troubleshooting
- FileMaker Extra: Recursive Scripts
Advanced Portal Techniques
- Advanced Portal Techniques
- Portals in FileMaker Pro
- Portal Basics
- New Record Only Relationships
- Horizontal Portals
- Using Portals to Create Calendars
- Selection Portals
- Filtered Portals
- Dynamic Portal Sorting
- Troubleshooting
- FileMaker Extra: Portals and Record Locking
Debugging and Troubleshooting
- Debugging and Troubleshooting
- What Is Troubleshooting?
- Staying Out of Trouble
- Planning for Trouble
- Troubleshooting Scripts and Calculations
- Troubleshooting in Specific Areas: Performance, Context, Connectivity, and Globals
- File Maintenance and Recovery
- FileMaker Extra: Other Tools of the Trade
Converting Systems from Previous Versions of FileMaker Pro
- Converting Systems from Previous Versions of FileMaker Pro
- Migration Choices
- Converting Files
- Pre-Conversion Tasks
- Post-Conversion Tasks
- Troubleshooting
- FileMaker Extra: Converting Web-Enabled Databases
Part IV: Data Integration and Publishing
Importing Data into FileMaker Pro
- Importing Data into FileMaker Pro
- Working with External Data
- Flat-File Data Sources
- Importing Multiple Files from a Folder
- Importing Photos from a Digital Camera
- Importing from an ODBC Data Source
- Importing from an XML Data Source
- Using a Script to Import Data
- Troubleshooting
- FileMaker Extra: Exploiting the FileMaker-to-FileMaker Import
Exporting Data from FileMaker
- Exporting Data from FileMaker
- Getting Out What You Put In
- The Basic Mechanics of Exporting
- Export File Formats
- Formatting Exported Data
- Exporting Related Fields
- Exporting Grouped Data
- Exporting to Fixed-Width Formats
- Working with Large Fields and Container Fields
- Scripted Exports
- Accessing FileMaker Data Using ODBC and JDBC
- Using FileMaker Pro as an ODBC Client
- Troubleshooting
- FileMaker Extra: Accessing FileMaker Data via JDBC
Instant Web Publishing
- Instant Web Publishing
- An Overview of Instant Web Publishing
- Enabling and Configuring IWP
- Designing for IWP Deployment
- Using an IWP Solution
- Troubleshooting
- FileMaker Extra: Building Your Own Next and Previous Page Buttons
FileMaker and Web Services
- FileMaker and Web Services
- About Web Services
- FileMaker and XML
- Transforming XML
- XML Import: Understanding Web Services
- Working with Web Services
- Troubleshooting
- FileMaker Extra: Write Your Own Web Services
Custom Web Publishing
- Custom Web Publishing
- About Custom Web Publishing
- Custom Web Publishing Versus Instant Web Publishing
- Custom Web Publishing Versus XML Export
- Getting Your Databases Ready for Custom Web Publishing
- Publishing FileMaker Data as XML
- Using XSLT with Custom Web Publishing
- Building Web Applications with XSLT-CWP
- Other Custom Web Publishing Commands and Parameters
- About the FileMaker XSLT Extensions
- Troubleshooting
- FileMaker Extra: About the Custom Web Publishing Tools
Part V: Deploying a FileMaker Solution
Deploying and Extending FileMaker
- Deploying and Extending FileMaker
- FileMaker Deployment Options
- Single User
- Peer-to-Peer Hosting
- FileMaker Server
- Web Publishing
- ODBC/JDBC
- Citrix/Terminal Services
- Runtime Solutions
- Deploying to Handheld Devices
- Customized Deployment Options
- Troubleshooting
- FileMaker Extra: The Limits of Customization
FileMaker Server and Server Advanced
- FileMaker Server and Server Advanced
- About FileMaker Server
- Installing FileMaker Server
- Running FileMaker Server
- Using the Server Administration Tool
- Configuring and Administering FileMaker Server Using the SAT
- Managing Clients
- Managing Databases
- Administration from the Command Line
- Working with External Services
- Automatically Updating Plug-ins
- Scheduled Tasks
- Monitoring FileMaker Server
- Troubleshooting
- FileMaker Extra: Best Practices Checklist
FileMaker Mobile
- FileMaker Mobile
- FileMaker Mobile 8 Overview
- Using FileMaker Mobile on Your Handheld Device
- Troubleshooting
- FileMaker Extra: Publishing Related Data
Documenting Your FileMaker Solutions
- Documenting Your FileMaker Solutions
- Why Is Documentation Important?
- Developing Naming Conventions
- Using Comments Effectively
- Documenting the Relationships Graph
- Using the Database Design Report
- Using Third-Party Documentation Tools
- Putting the Finishing Touches on Your Documentation
- Final Thoughts on Documentation
- FileMaker Extra: Soliant Development Standards
EAN: 2147483647
Pages: 296
