Plotting Time Series Data
Problem
You need to plot a set of time series data for further analysis.
Solution
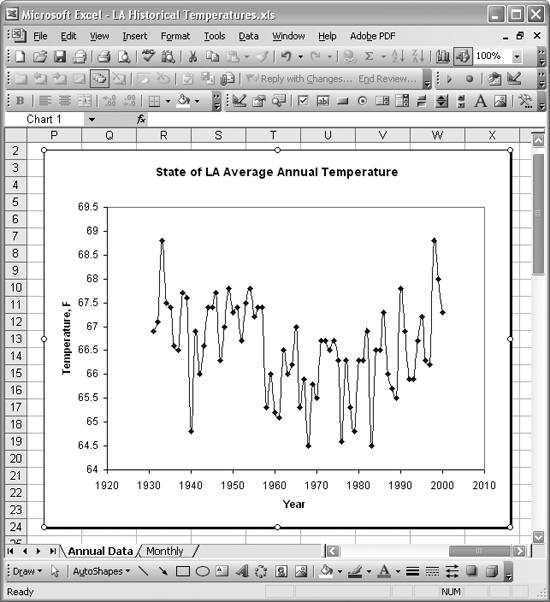
Time series charts, such as the one shown in Figure 6-1, are easy to create in Excel.
Select the data series (both x and y values) you want to chart and then press the Chart Wizard button on the Standard toolbar, or select Insert images/U2192.jpg border=0> Chart... from the main menu bar to open the Chart Wizard. The Chart Wizard allows you to select the chart style and customize charts in various ways. Read Chapter 4 to learn more about creating charts in Excel.
Figure 6-1. Time series chart
Using Excel
- Introduction
- Navigating the Interface
- Entering Data
- Setting Cell Data Types
- Selecting More Than a Single Cell
- Entering Formulas
- Exploring the R1C1 Cell Reference Style
- Referring to More Than a Single Cell
- Understanding Operator Precedence
- Using Exponents in Formulas
- Exploring Functions
- Formatting Your Spreadsheets
- Defining Custom Format Styles
- Leveraging Copy, Cut, Paste, and Paste Special
- Using Cell Names (Like Programming Variables)
- Validating Data
- Taking Advantage of Macros
- Adding Comments and Equation Notes
- Getting Help
Getting Acquainted with Visual Basic for Applications
- Introduction
- Navigating the VBA Editor
- Writing Functions and Subroutines
- Working with Data Types
- Defining Variables
- Defining Constants
- Using Arrays
- Commenting Code
- Spanning Long Statements over Multiple Lines
- Using Conditional Statements
- Using Loops
- Debugging VBA Code
- Exploring VBAs Built-in Functions
- Exploring Excel Objects
- Creating Your Own Objects in VBA
- VBA Help
Collecting and Cleaning Up Data
- Introduction
- Importing Data from Text Files
- Importing Data from Delimited Text Files
- Importing Data Using Drag-and-Drop
- Importing Data from Access Databases
- Importing Data from Web Pages
- Parsing Data
- Removing Weird Characters from Imported Text
- Converting Units
- Sorting Data
- Filtering Data
- Looking Up Values in Tables
- Retrieving Data from XML Files
Charting
- Introduction
- Creating Simple Charts
- Exploring Chart Styles
- Formatting Charts
- Customizing Chart Axes
- Setting Log or Semilog Scales
- Using Multiple Axes
- Changing the Type of an Existing Chart
- Combining Chart Types
- Building 3D Surface Plots
- Preparing Contour Plots
- Annotating Charts
- Saving Custom Chart Types
- Copying Charts to Word
- Recipe 4-14. Displaying Error Bars
Statistical Analysis
- Introduction
- Computing Summary Statistics
- Plotting Frequency Distributions
- Calculating Confidence Intervals
- Correlating Data
- Ranking and Percentiles
- Performing Statistical Tests
- Conducting ANOVA
- Generating Random Numbers
- Sampling Data
Time Series Analysis
- Introduction
- Plotting Time Series Data
- Adding Trendlines
- Computing Moving Averages
- Smoothing Data Using Weighted Averages
- Centering Data
- Detrending a Time Series
- Estimating Seasonal Indices
- Deseasonalization of a Time Series
- Forecasting
- Applying Discrete Fourier Transforms
Mathematical Functions
- Introduction
- Using Summation Functions
- Delving into Division
- Mastering Multiplication
- Exploring Exponential and Logarithmic Functions
- Using Trigonometry Functions
- Seeing Signs
- Getting to the Root of Things
- Rounding and Truncating Numbers
- Converting Between Number Systems
- Manipulating Matrices
- Building Support for Vectors
- Using Spreadsheet Functions in VBA Code
- Dealing with Complex Numbers
Curve Fitting and Regression
- Introduction
- Performing Linear Curve Fitting Using Excel Charts
- Constructing Your Own Linear Fit Using Spreadsheet Functions
- Using a Single Spreadsheet Function for Linear Curve Fitting
- Performing Multiple Linear Regression
- Generating Nonlinear Curve Fits Using Excel Charts
- Fitting Nonlinear Curves Using Solver
- Assessing Goodness of Fit
- Computing Confidence Intervals
Solving Equations
- Introduction
- Finding Roots Graphically
- Solving Nonlinear Equations Iteratively
- Automating Tedious Problems with VBA
- Solving Linear Systems
- Tackling Nonlinear Systems of Equations
- Using Classical Methods for Solving Equations
Numerical Integration and Differentiation
- Introduction
- Integrating a Definite Integral
- Implementing the Trapezoidal Rule in VBA
- Computing the Center of an Area Using Numerical Integration
- Calculating the Second Moment of an Area
- Dealing with Double Integrals
- Numerical Differentiation
Solving Ordinary Differential Equations
- Introduction
- Solving First-Order Initial Value Problems
- Applying the Runge-Kutta Method to Second-Order Initial Value Problems
- Tackling Coupled Equations
- Shooting Boundary Value Problems
Solving Partial Differential Equations
- Introduction
- Leveraging Excel to Directly Solve Finite Difference Equations
- Recruiting Solver to Iteratively Solve Finite Difference Equations
- Solving Initial Value Problems
- Using Excel to Help Solve Problems Formulated Using the Finite Element Method
Performing Optimization Analyses in Excel
- Introduction
- Using Excel for Traditional Linear Programming
- Exploring Resource Allocation Optimization Problems
- Getting More Realistic Results with Integer Constraints
- Tackling Troublesome Problems
- Optimizing Engineering Design Problems
- Understanding Solver Reports
- Programming a Genetic Algorithm for Optimization
Introduction to Financial Calculations
- Introduction
- Computing Present Value
- Calculating Future Value
- Figuring Out Required Rate of Return
- Doubling Your Money
- Determining Monthly Payments
- Considering Cash Flow Alternatives
- Achieving a Certain Future Value
- Assessing Net Present Worth
- Estimating Rate of Return
- Solving Inverse Problems
- Figuring a Break-Even Point
Index
EAN: 2147483647
Pages: 206
