Hack 38. Graph Your Wireless Performance


Comprehensively track the performance of your wireless links over time.
The monitoring tools mentioned so far give you a good instantaneous reading of received signal and noise levels for a given radio link. While useful for proving a link and installing your gear, remember that radio conditions change over time. Doing the occasional spot check doesn't really give you the full picture of what is going on.
For example, take a look at Figure 2-42. This displays radio data for a one-mile link, averaged over several days. You can see that in the middle of each day, the signal drops by as much as 6 dB, while the noise remains steady. Remember that these are really negative numbers, so in this graph, a smaller number is better for signal. The repeating pattern we see indicates the effect of thermal fade.
Figure 2-42. Thermal fade in the middle of the day
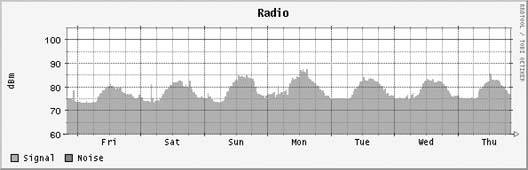
This particular link is a simple waveguide antenna mounted in the middle of a low, sloping roof. As the roof and the rest of the environment heats up, the perceived signal is apparently less. At night, when things cool down, the perceived signal increases. The effect of thermal fade in this installation was later mitigated (by about 2 or 3 dB) by relocating the antenna, placing it closer to the edge of the roof. With less hot roof in the path, the effect of the day's heat was reduced. Nothing can completely eliminate the effects of the sun on a long distance path, but without a historical graph, it would be difficult to account for the effect at all.
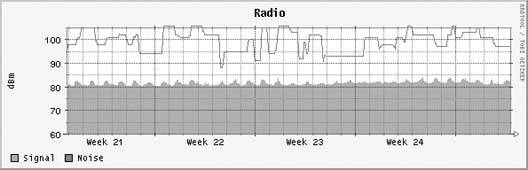
Figure 2-43 shows another interesting artifact, this time averaged over several weeks. This link is about a mile-and-a-half long, and still shows some of the effects of thermal fade. But look at the noise readings. They are all over the map, reading as high as -89 and jumping to well below -100. This most likely indicates the presence of other 2.4 GHz devices somewhere in the path between the two points. Since the noise remains steady for some time and then changes rapidly to another level, it is probably a device that uses channels rather than a frequency-hopping device. Given the wide variety of perceived noise, I would guess that the most likely culprit is a high-powered 2.4 GHz phone somewhere nearby. It is probably impossible to ever know for sure, but this data might warrant changing the radio to a different channel.
Figure 2-43. A link with a noisy environment
These graphs were generated using Linux and some freely available tools. A modest Linux server can monitor a large number of radio devices, and the requirements on each of the access points (APs) is quite small. I will assume that you are using a DIY AP running Linux [Hack #63], although similar techniques can be used for just about any kind of radio device.
You can monitor signal strength using any available TCP port above 1024 on the access points. We'll use port 10000 here, but you should choose your own port based on your setup. On each of the APs to be monitored, as well as on the machine doing the monitoring, add lines like these to /etc/services:
	mon0	10000/tcp
	mon1	10001/tcp
	mon2	10002/tcp
Then, add a line like this to the /etc/inetd.conf on the monitored machines:
mon0 stream tcp nowait nobody /usr/local/bin/iwconfig iwconfig eth1
Be sure to use the path to iwconfig for your system, and specify the device to be monitored at the end. You can add as many lines as you like, using a different port each time:
mon1 stream tcp nowait nobody /usr/local/bin/iwconfig iwconfig wlan0
If you need more ports, add more lines to your /etc/services. When all of your radio cards are set up, restart inetd. You can verify that the changes have taken effect by using telnet:
# telnet localhost mon0

		 Trying 127.0.0.1…
		 Connected to localhost.
		 Escape character is '^]'.
		 eth1		IEEE 802.11-DS ESSID:"NoCat" Nickname:"pebble"
				Mode:Managed Frequency:2.457GHz Access Point: 00:02:2D:1C:BC:CF
				Bit Rate:11Mb/s Tx-Power=15 dBm Sensitivity:1/3
				Retry limit:4 RTS thr:off Fragment thr:off
				Power Management:off
				Link Quality:14/92 Signal level:-83 dBm Noise level:-96 dBm
				Rx invalid nwid:0 Rx invalid crypt:0 Rx invalid frag:6176330
				Tx excessive retries:7880 Invalid misc:0 Missed beacon:0

		 Connection closed by foreign host.
		 #
To collect the radio data, you need Netcat installed on the machine that does the collection. Netcat is a free and insanely useful utility available at http://www.securityfocus.com/tools/137. Think of it as a scriptable telnet program that will handle just about any kind of network data you want to throw at it. I use Netcat to connect to each of the machines, and scrape the results with a Perl script.
With the Netcat binary (nc) installed on your system, use the wrapper script in Example 2-2 to collect the data.
Example 2-2. radio.pl, a wrapper script that collects Netcat data
#!/usr/bin/perl -w
use strict;

my $ip = shift;
my $port = shift;
($ip && $port) || die "Usage: $0 ip port
";

open(NC, "nc $ip $port |") || die "Couldn't spawn nc: $!
";

while() {
 if(/Signal level:-?(d+).*Noise level:-?(d+)/) {
	print "$1 $2
";
	exit;
 }
}

die "Warning: couldn't find signal and noise!
";
I put this script in /usr/local/sbin/ and invoke it with the IP address and port number on the command line. It simply returns two unsigned numbers representing the current signal and noise readings:
$ radio.pl 10.15.6.1 mon0

		 83 96
		 $
In case you haven't recognized it already from the graphs, the tool that actually stores the data and draws the pretty graphs is Tobi Oetiker's excellent Round Robin Database Tool (RRDtool); http://people.ee.ethz.ch/~oetiker/). Like many powerful tools, RRDtool can be imposing at first, sometimes to the point of frustration. Efficient data collection and accurate visual presentation isn't as simple as you might think. Of course, RRDtool will handle just about any data type you track, but getting it working can be tricky the first time.
Personally, I prefer to use a tool like Cacti (http://www.cacti.net) to manage my RRDtool graphs for me. It is fairly simple to install, has an easy to use web interface, and does the dirty work of managing your RRDtool databases. With Cacti installed, simply set up radio.pl (Example 2-2) as a data input script, and create a data source for each radio to be monitored. See the Cacti documentation for more details. Tutorials on how to set up and use Cacti are available at http://www.cacti.net/documentation.php. The Cacti pages also have an excellent web-based forum where you can get questions answered by developers and active users.
When properly configured, Cacti automatically generates Daily, Weekly, Monthly, and Yearly averages for all of your data sources.
If you prefer to roll your own RRDtool, use a command such as this to create your database:
	/usr/local/rrdtool/bin/rrdtool create
	/home/rob/radio/radio.rrd
	--step 300
	DS:signal:GAUGE:600:0:150
	DS:noise:GAUGE:600:0:150
	RRA:AVERAGE:0.5:1:600
	RRA:AVERAGE:0.5:6:700
	RRA:AVERAGE:0.5:24:775
	RRA:AVERAGE:0.5:288:797
	RRA:MAX:0.5:1:600
	RRA:MAX:0.5:6:700
	RRA:MAX:0.5:24:775
	RRA:MAX:0.5:288:797
Be sure that the rrdtool binary is in your PATH, and change the print "$1 $2 "; line in radio.pl to something like the following:
`rrdtool update /home/rob/radio/radio.rrd --template signal:noise N:$1:$2`;
Add radio.pl to a cron job that runs every five minutes or so to regularly collect the data:
*/5 * * * * /usr/local/sbin/radio.pl 10.15.6.1 mon0
Finally, once you have collected some data, you can generate a graph like the one shown in Figure 2-43 with this command:
	/usr/local/rrdtool/bin/rrdtool graph -
	 --imgformat=PNG
	 --start="-604800"
	 --title=" Radio"
	 --rigid
	 --base=1000
	 --height=120
	 --width=500
	 --upper-limit=105
	 --lower-limit=60
	 --vertical-label="dBm"
	 DEF:a="/home/rob/radio/ radio.rrd":signal:AVERAGE
	 DEF:b="/home/rob/radio/ radio.rrd":noise:AVERAGE
	 AREA:a#74C366:"Signal"
	 LINE1:b#FF0000:"Noise"
	 > graph.png
While the other tools mentioned in this chapter will give you a good instantaneous estimate of how well your link is doing, RRDtool, Netcat, and the script in Example 2-2 will give you impressive historical data that can be invaluable for troubleshooting your network. In addition to signal and noise, RRDtool can also track uptime, network traffic, associated clients, transmission errors, and any other data you can think of. The reward of having clear historical graphs is well worth learning to deal with the complexity of RRDtool.
Bluetooth, Mobile Phones, and GPS
- Hacks 122: Introduction
- Hack 1. Set Up Bluetooth on Linux
- Hack 2. Set Up Bluetooth on Windows XP
- Hack 3. Connect Mac OS X with a Bluetooth Phone
- Hack 4. Connect Linux with a Bluetooth Phone
- Hack 5. Connect Windows XP with a Bluetooth Phone
- Hack 6. Use Your Treo as a Modem
- Hack 7. Send SMS from a PowerBook
- Hack 8. Remote Control Mac OS X with Bluetooth Phones and PDAs
- Hack 9. Remote Control Linux with a Bluetooth Phone
- Hack 10. Control XMMS with Bluetooth
- Hack 11. Liven Up Parties with a Participatory Slideshow
- Hack 12. Send SMS from Linux
- Hack 13. Remote Control Windows with Bluetooth Phones and PDAs
- Hack 14. Control Your Bluetooth Phone with FMA
- Hack 15. Control Your Computer from Your Palm
- Hack 16. Control Your Home Theater from Your Palm
- Hack 17. Choose a Cellular Data Plan
- Hack 18. Blog from Your Mobile Phone
- Hack 19. Get Google Maps on Your Mobile Phone
- Hack 20. Share Your GPS
- Hack 21. Broadcast Your GPS Position
- Hack 22. Map Wi-Fi Networks with Kismet and GPSd
Network Discovery and Monitoring
- Hacks 2339: Introduction
- Hack 23. Find All Available Wireless Networks
- Hack 24. Discover Networks with NetStumbler
- Hack 25. Detect Networks with Handheld PCs
- Hack 26. Find and Join Wireless Networks with AP Radar
- Hack 27. Detect Networks on Mac OS X
- Hack 28. Scan Passively with KisMAC
- Hack 29. Detect Networks with Kismet
- Hack 30. Monitor Wireless Links in Linux with Wavemon
- Hack 31. Analyze Traffic with Ethereal
- Hack 32. Track 802.11 Frames in Ethereal
- Hack 33. Watch Network Traffic
- Hack 34. grep Your Network
- Hack 35. Check Wi-Fi Network Performance with Qcheck
- Hack 36. Estimate Network Performance
- Hack 37. Get Real-Time Network Stats
- Hack 38. Graph Your Wireless Performance
- Hack 39. Find Radio Manufacturers by MAC
Wireless Security
- Hacks 4051: Introduction
- Hack 40. Stop Moochers from Stealing Your Wi-Fi Bandwidth
- Hack 41. Visualize a Network
- Hack 42. Secure Your Linux Network with WPA
- Hack 43. Control Wireless Access by MAC
- Hack 44. Authenticate Wireless Users
- Hack 45. Forward Ports over SSH
- Hack 46. Proxy Web Traffic over SSH
- Hack 47. Securely Connect Two Networks
- Hack 48. Generate a Tunnel Configuration Automatically
- Hack 49. Poll Wireless Clients
- Hack 50. Interrogate the Network
- Hack 51. Track Wireless Users
Hardware Hacks
- Hacks 5262: Introduction
- Hack 52. Add an External Antenna
- Hack 53. Do-It-Yourself Access Point Hardware
- Hack 54. Boot from a Compact Flash Hard Drive
- Hack 55. Increase the Range of a PowerBook
- Hack 56. Send Power over Your Ethernet
- Hack 57. The NoCat Night Light
- Hack 58. Upgrade the Linksys WET11
- Hack 59. Scan for Wireless Networks Automatically
- Hack 60. Backlight Your Zipit
- Hack 61. Unwire Your Pistol Mouse
- Hack 62. Mobilize Your WRT54G with the WiFiCar
Software Hacks
- Hacks 6382: Introduction
- Hack 63. Build Your Own Access Point with Linux
- Hack 64. Bridge Your Linux AP
- Hack 65. Protect Your Bridge with a Firewall
- Hack 66. Filter MAC with HostAP and Madwifi
- Hack 67. Upgrade Your Wireless Router
- Hack 68. Set Up an OLSR Mesh Network
- Hack 69. Extend Your Wireless Network with WDS
- Hack 70. Pebble
- Hack 71. Wall Off Your Wireless
- Hack 72. Run Your Mac as an Access Point
- Hack 73. Run Linux on the Zipit Wireless Messenger
- Hack 74. Capture Wireless Users with NoCatAuth
- Hack 75. Capture Wireless Users on a Small Scale
- Hack 76. Build an Online Community in Your Offline Neighborhood
- Hack 77. Manage Multiple AirPort Base Stations
- Hack 78. Advertise Bonjour Services in Linux
- Hack 79. Advertise Any Service with Bonjour in Mac OS X
- Hack 80. Redirect Brought to you by Bonjour Ads
- Hack 81. Use a Windows-Only Wireless Card in Linux
- Hack 82. Use Your Orinoco Card with Hermes AP
Do-It-Yourself Antennas
- Hacks 8393: Introduction
- Hack 83. Make a Deep Dish Cylindrical Parabolic Reflector
- Hack 84. Spider Omni Antenna
- Hack 85. Pringles Can Waveguide
- Hack 86. Pirouette Can Waveguide
- Hack 87. Primestar Dish with Waveguide Feed
- Hack 88. Primestar Dish with Biquad Feed
- Hack 89. Cut a Cable Omni Antenna
- Hack 90. Build a Slotted Waveguide Antenna
- Hack 91. The Passive Repeater
- Hack 92. Determine Your Antenna Gain
- Hack 93. Build Cheap, Effective Roof Mounts
Wireless Network Design
- Hacks 94100: Introduction
- Hack 94. Analyze Elevation Profiles for Better Long-Range Wireless Networking
- Hack 95. Build a Wireless Network for the Large House
- Hack 96. Establish Line of Sight
- Hack 97. Calculate the Link Budget
- Hack 98. Align Antennas at Long Distances
- Hack 99. Slow Down to Speed Up
- Hack 100. Take Advantage of Antenna Polarization
Appendix A. Wireless Standards
- Appendix A. Wireless Standards
- Section A.1. 802.11: The Mother of All IEEE Wireless Ethernet
- Section A.2. 802.11a: The Betamax of the 802.11 Family
- Section A.3. 802.11b: The De Facto Standard
- Section A.4. 802.11g: Like 802.11b, only Faster
- Section A.5. 802.16: WiMAX Long Distance Wireless Infrastructure
- Section A.6. Bluetooth: Cable Replacement for Devices
- Section A.7. 900 MHz: Low Speed, Better Coverage
- Section A.8. CDPD, 1xRTT, and GPRS: Cellular Data Networks
- Section A.9. FRS and GMRS: Super Walkie-Talkies
- Section A.10. 802.1x: Port Security for Network Communications
- Section A.11. WPA & 802.11i
- Section A.12. BSS Versus IBSS
Appendix B. Wireless Hardware Guide
EAN: 2147483647
Pages: 178
