Video Standards
The reading of the data generated by a CCD sensor is influenced by the signal that is used for the transfer of the image content. Mostly, video signals are used to display the data on an analog video monitor; this leads to a number of requirements:
- The data must be divided into a standardized number of lines and pixels.
- The display refresh rate must be high enough to prevent flickering of the monitor.
- The timing of the signal should be standardized.
Currently, two standards are established worldwide: the European International Radio Consultative Committee (Comit Consultatif International des Radiocommunications, or CCIR) standard and the U.S. standard RS 170. In both standards, the full video image (called frame ) is divided into two parts (called fields ), which are displayed with a half-line offset, in order to double the picture refresh rate. Figure 2.24 shows this principle, which is called interlacing , using the European CCIR standard.
Figure 2.24. Video Frames (European CCIR Standard)
Here, each frame consists of 312.5 video lines, but only 287 of them are visible. [6] Table 2.2 shows some data for both the CCIR and the RS 170 standard; you can see that the vertical sampling frequency (which is also the refresh rate of the fields) obviously is derived from the power frequency in the respective geographic areas. A power frequency of 50 Hz (for Europe) leads to a frame refresh rate of 25 Hz, which is sufficient for movies. [7] With the RS 170 standard, the refresh rate is even higher.
[6] Some of these lines are necessary for the flyback of the electron beam; the rest can be used for transmitting additional information.
[7] In comparison, cinema movies usually have a refresh rate of 24 images per second.
Table 2.2. Comparison of CCIR and RS 170 Video Standards
|
Standard: |
CCIR (Europe) |
RS 170 (U.S.) |
|---|---|---|
|
Vertical sampling frequency: |
50 Hz |
59.9 Hz |
|
Vertical sampling time: |
20 ms |
16.68 ms |
|
Vertical flyback time: |
1.536 ms |
1.271 ms |
|
Horizontal sampling frequency: |
15.625 kHz |
15.734 kHz |
|
Horizontal sampling time: |
64 m s |
63.55 m s |
|
Horizontal flyback time: |
11.52 m s |
10.76 m s |
|
Number of lines: |
625 |
525 |
|
Visible lines: |
574 |
485 |
Figures 2.25 and 2.26 show the video timing diagrams for the CCIR and the RS 170 standards, respectively. A major difference between these two is that the numbering of field 2 in the RS 170 standard starts again at 1, whereas the numbering in CCIR is continuous. Table 2.3 shows the line numbering scheme in both standards.
Figure 2.25. CCIR Standard Timing Diagram
Figure 2.26. RS 170 Standard Timing Diagram
Table 2.3. Line Numbering in CCIR and RS 170 Video Standards
|
Standard: |
CCIR (Europe) |
RS 170 (U.S.) |
||
|---|---|---|---|---|
|
Line numbering: |
Field 1: |
1...312 |
Field 1 (odd): |
1...262 |
|
Field 2: |
312.5...625 |
Field 2 (even): |
1...263 |
|
|
Visible lines: |
Field 1: |
23...310 |
Field 1 (odd): |
23...262 |
|
Field 2: |
336...623 |
Field 2 (even): |
20.5...263 |
Considering these techniques, especially interlacing, it is evident that the linear reading of the contents of a CCD sensor chip leads to complications. It would make more sense to read every second pixel for the generation of field 1, and afterwards the rest of the pixels for field 2.
Actually, CCD sensors for specific video standards may include this functionality for the generation of images consisting of two fields. Here, a sensor element consists of two photoelements, one for the odd and one for the even pixel, and four CCD cells (see also Figure 2.27). Generating field 1, the odd pixels are read and transferred to the sensor output; field 2 uses the even pixels.
Figure 2.27. Interlaced Mode of a CCD Video Sensor
The same sensor can be used for noninterlaced mode, in which both pixel sensors are read, both fields are displayed in the same area, and the refresh rate is doubled ; Figure 2.28 shows this principle.
Figure 2.28. Noninterlaced Mode and Progressive Scan Sensor
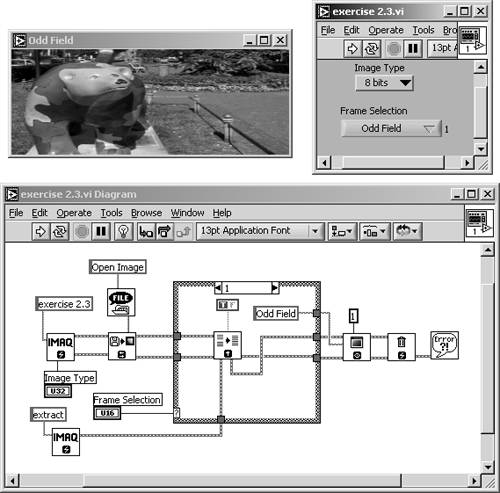
Exercise 2.3: Deinterlacing Images:
IMAQ Vision contains a function that performs functions such as interlacing and deinterlacing: IMAQ Interlace . With this SubVI, it is possible either to extract the odd or even field areas from an image or to build an image, using the odd and even fields of previously acquired image data. Figure 2.29 shows an example exercise.
"Odd field" and "even field" mean that the odd field contains all of the odd lines and the even field contains all of the even lines of an image, as described in Table 2.3 and Figure 2.27. If the captured image contains fast moving objects, the even and the odd field might differ ; in some cases it makes sense to remove one of them and duplicate or interpolate the missing lines.
Figure 2.29. Image Reduction with IMAQ's Interlace Function
Finally, newer cameras , which generally allow for higher picture refresh rates, use progressive scan sensors , where the full image resolution is used. Typical resolutions are, for example, 640 x 480 or 1280 x 1024. As shown in Figure 2.28, the sensor consists only of a single photoelement and three CCD cells per sensor element, which makes a higher integration of the sensor possible.
Color Images |
Introduction and Definitions
- Introduction
- Some Definitions
- Introduction to IMAQ Vision Builder
- NI Vision Builder for Automated Inspection
Image Acquisition
- Image Acquisition
- Charge-Coupled Devices
- Line-Scan Cameras
- CMOS Image Sensors
- Video Standards
- Color Images
- Other Image Sources
Image Distribution
- Image Distribution
- Frame Grabbing
- Camera Interfaces and Protocols
- Compression Techniques
- Image Standards
- Digital Imaging and Communication in Medicine (DICOM)
Image Processing
Image Analysis
- Image Analysis
- Pixel Value Analysis
- Quantitative Analysis
- Shape Matching
- Pattern Matching
- Reading Instrument Displays
- Character Recognition
- Image Focus Quality
- Application Examples
About the CD-ROM
EAN: 2147483647
Pages: 55
