Image Focus Quality
The idea for this example section came to me when I visited NIWeek 2001 and listened to a presentation called "Emerging Technologies in Vision," which contained a section about autofocusing algorithms; with the following example we can try them ourselves .
Autofocusing (the adjustment of camera focus to obtain optimal image focus) can be divided into two more or less independent tasks :
- determine the optimum focus by analyzing image quality (for example, Figure 5.66);
Figure 5.66. Focus Quality Rating with Edge Detection
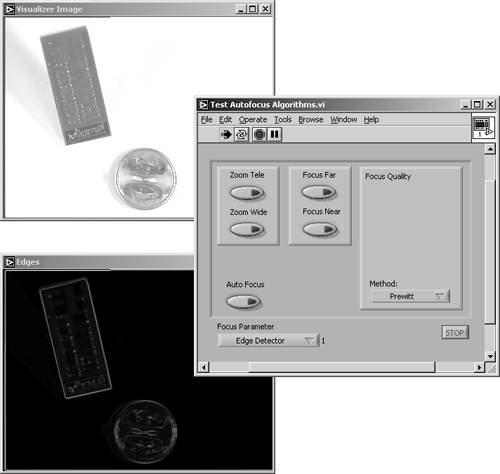
- adjust the camera focus setting. We do not talk about this part, but if you look at one of the diagrams (for example, Figure 5.67), you will notice zoom and focus setting controls, which are inputs of a subVI called Elmo Remote. You can use your own routines instead.
Figure 5.67. Focus Quality Diagram (Edge Detection)
Back to the first task: focus quality is defined by sharp differences between object edges and the background. Therefore, the simplest method for quantifying the image focus is obviously a classic edge detection, for example, with a Sobel or a Prewitt filter kernel. Figure 5.66 shows a result, and Figure 5.67 shows the corresponding diagram. It turns out that the classic edge detection method is quite accurate and fast. The sum of all pixel values of the filtered image can be used to specify a value for the focus quality; it gets a maximum at optimal focus.
Note that the example program is designed for the testing of three (or more) methods ; a case structure selects the method and enables active controls or disables elements that are not required by the current method. All cases are prepared for further programming.
Figure 5.68 shows the result of another possible method. Here, the standard deviation of the image histogram is used as an indicator of focus quality. At optimum focus, the value of the standard deviation gets a maximum.
Figure 5.68. Focus Quality Rating with Histogram Analysis
The corresponding block diagram can be seen in Figure 5.69. The function IMAQ Histogram is used to calculate the standard deviation of the image's pixel values. Although this method is very fast, it is less accurate than the edge detector.
Figure 5.69. Focus Quality Diagram (Histogram Analysis)
The third method we discuss here is based on the frequency domain of the image. Remember that sharp edges in images are represented by medium to high frequencies in the frequency domain image. Figure 5.70 shows the calculated FFT (fast Fourier transform) of our test image.
You already know how to build the diagram shown in Figure 5.71: Simply use the function IMAQ FFT to display the fast Fourier transform; you have to add functions to quantify the amount of high-frequency components yourself.
Another approach for the frequency domain could be the use of wavelets, as discussed in Chapter 3. All frequency domain methods are very accurate, but also very time consuming (wavelet methods are a little faster than FFT methods). Table 5.1 compares the discussed methods; obviously each of them has its advantages and drawbacks.
Figure 5.70. Focus Quality Rating with FFT
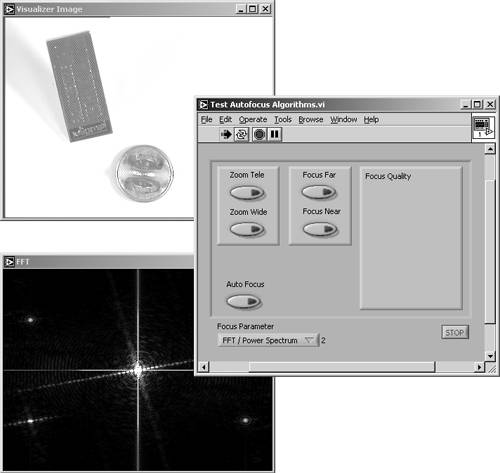
Figure 5.71. Focus Quality Diagram (FFT)
Table 5.1. Comparison of Focus Quality Rating Metods
|
Method |
Accuracy |
Speed |
|---|---|---|
|
Classic edge detector: |
+ |
+ |
|
Statistical (standard deviation): |
o |
++ |
|
Frequency domain (FFT): |
++ |
o |
Application Examples |
Introduction and Definitions
- Introduction
- Some Definitions
- Introduction to IMAQ Vision Builder
- NI Vision Builder for Automated Inspection
Image Acquisition
- Image Acquisition
- Charge-Coupled Devices
- Line-Scan Cameras
- CMOS Image Sensors
- Video Standards
- Color Images
- Other Image Sources
Image Distribution
- Image Distribution
- Frame Grabbing
- Camera Interfaces and Protocols
- Compression Techniques
- Image Standards
- Digital Imaging and Communication in Medicine (DICOM)
Image Processing
Image Analysis
- Image Analysis
- Pixel Value Analysis
- Quantitative Analysis
- Shape Matching
- Pattern Matching
- Reading Instrument Displays
- Character Recognition
- Image Focus Quality
- Application Examples
About the CD-ROM
EAN: 2147483647
Pages: 55
- ERP Systems Impact on Organizations
- The Second Wave ERP Market: An Australian Viewpoint
- Enterprise Application Integration: New Solutions for a Solved Problem or a Challenging Research Field?
- Context Management of ERP Processes in Virtual Communities
- A Hybrid Clustering Technique to Improve Patient Data Quality
- An Emerging Strategy for E-Business IT Governance
- Assessing Business-IT Alignment Maturity
- Linking the IT Balanced Scorecard to the Business Objectives at a Major Canadian Financial Group
- A View on Knowledge Management: Utilizing a Balanced Scorecard Methodology for Analyzing Knowledge Metrics
- The Evolution of IT Governance at NB Power
