Application Examples
The following examples show some applications my colleagues and I developed over the past few years . They were papers we presented at various NI conferences (mostly NIWeek, but also VIP conferences in Europe); that is why you will find some redundancies, especially regarding FireWire. These papers are reproduced by permission of National Instruments.
You can find related software on the attached CD; when certain hardware is needed, parts of the application or demo samples of the software are available.
Moving Camera Supports EMC Test Automation
by Thomas KLINGER, Christian MADRITSCH, and Hermann STERNER (Paper presented at NIWeek 1999) [40]
Category
- Industrial Automation
Products Used
- LabVIEW Version 5.0
- IMAQ Vision for LabVIEW
The Challenge
EMC testing is usually a long and intensive procedure. The test object has to be visually checked and supervised by a test engineer, who has to record the time when the test object fails to operate .
The Solution
A Moving Camera, controlled by a LabVIEW application, using IEEE 1394 (FireWire) technology for video transmission and control signals, is able to detect test object failures by means of image processing.
Introduction
CTI (Carinthia Tech Institute, or Technikum Kaernten) is an educational institute with several research projects supported by the Austrian government. Two of the main topics of CTI are serial bus systems (with focus on the IEEE 1394 technology) and EMC. The Moving Camera project gave us the opportunity to combine these two topics.
Normally, a camera is installed inside an EMI anechoic chamber to monitor the test object during the test period. Current solutions use a video monitor in combination with a VCR, but by using a digital video camera with IEEE 1394 bus, the video can be displayed on a PC.
The Moving Camera system described in this paper allows not only setting the camera properties (e.g. brightness, focus, zoom), but also tilt and pan adjustment of the camera.
Figure 5.72. Block Diagram of the Moving Camera System
IEEE 1394 (FireWire)
IEEE 1394 is a serial bus system invented by Apple in 1985 (at this time known as ADB; Apple Desktop Bus) with the goal to have a standard for a high-speed serial bus that is able to replace all existing interfaces on PC or multimedia environments. In 1995 the bus was standardized under the name IEEE 1394-1995.
The primary features of FireWire are:
- Transfer rates of 100 Mb/s, 200 Mb/s, and 400 Mb/s (up to 3.2 Gb/s planned).
- Support for isochronous applications (guaranteed bandwidth) as well as asynchronous applications ( guaranteed delivery).
- Hot plugging: Devices can be attached to or removed from the bus dynamically.
- Cable power: Power available from the bus can be either sourced or sinked by a given node.
- Daisy-chaining: The serial bus can be extended by connecting new serial devices to ports provided by serial bus nodes.
Currently, FireWire is becoming common for high-end multimedia applications, such as digital camcorders or VCRs. On the other hand, the features mentioned above enable FireWire to establish itself as a standard for industrial automation applications.
Figure 5.73. Prototype of the Moving Camera Unit
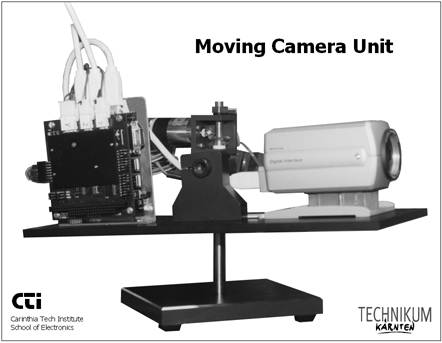
The Moving Camera System
Figure 5.72 shows a block diagram of the whole system. The left hand part of the figure represents the Moving Camera unit, which is located inside the EMI chamber and connected via one single serial IEEE 1394 cable with a PC equipped with an IEEE 1394 PCI interface board. The IEEE 1394 cable provides the digital video signal as well as the motor control signals and the power supply for both the camera and the DC motors.
The hardware is controlled by two ActiveX controls; one for displaying the video data on the PC screen and the other for positioning the digital camera using the motor controller and the DC motors.
Moving Camera Hardware
The Moving Camera unit (inside the anechoic chamber) is shown in Figure 5.73 and consists of
- a digital IEEE 1394 video camera (Sony) with a resolution of 640 x 480 pixels;
- a PC104 microcontroller board (386SX microprocessor, 24 MHz clock, 1 MB DRAM);
- a PC104 IEEE 1394 node for asynchronous transfers (200 Mb/s, developed by CTI);
- a PC104 Motion Controller board (developed by CTI) driving two DC motors for horizontal and vertical movement;
- aluminum ground plate and DC motor support with gear units (prototype in Figure 5.73 shown without housing).
The PC104 bus allows for a modular design of the system. For further upgrading, it is possible to add other components , e.g., ADC- boards .
Figure 5.74. Screenshot of a Typical Image Processing Application
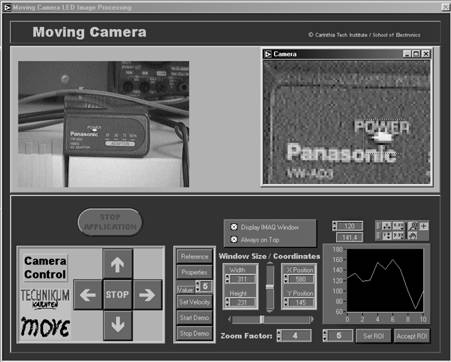
Moving Camera Software
The Moving Camera software structure is shown on the right hand side of Figure 5.72. The software base is two ActiveX controls, which are layered above the driver for the IEEE 1394 PCI card.
The first ActiveX, called Camera Control, provides the functionality to control the camera properties and to display the video stream. The second is called Motion Control and provides the functionality to control the movement unit. Both controls are embedded within a LabVIEW application. For example, the Motion Control ActiveX exposes in its COM interface the methods MoveRight, MoveLeft, MoveUp, MoveDown. These methods can be invoked by pressing a control element of the LabVIEW GUI, using LabVIEW's ActiveX capabilities.
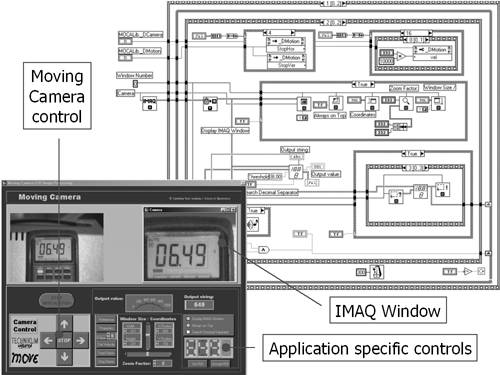
Figure 5.74 shows the screenshot of a typical LabVIEW user interface. The upper part of the screen displays the live video on the left and the IMAQ window used for further image processing on the right. The lower half consists of the control elements for the moving camera, position and zoom elements for the IMAQ window, and application specific controls (shown in Figure 5.75).
One of our sample applications detects the change of brightness in a previously specified region. For example, this feature allows for the detection of LED failure (Figure 5.74). In Figure 5.75 the value of a digital display is being read and certain values can be detected .
Figure 5.75. LabVIEW Diagram and Front Panel Details
Conclusion
Due to the ActiveX capability of LabVIEW, it is very easy to enhance the functionality of LabVIEW with custom-made functions and as a result, it is possible to include digital video functions, DC motor control, IEEE 1394 bus handling, and image processing in a single application.
Object Detection and Counting in Public Places
by Thomas KLINGER, Christian MADRITSCH, and Hermann STERNER
(Paper presented at NIWeek 2000) [41]
(similar paper presented at VIP 2000, Munich)
Category
- R&D
Products Used
- LabVIEW Version 5.1
- IMAQ Vision for LabVIEW
- AT-485/2 RS-485 Serial Interface
- 6B Series Distributed Signal Conditioning and I/O Modules
The Challenge
The new fountain in the Villach city hall square should be a "situative reflection" of the urban situation of the square and the surrounding area; the presence and the movement of people in the square should result in variations of the fountain water height.
The Solution
Using two digital video cameras , image processing algorithms, and a LabVIEW control program, it is possible to determine the number of persons as well as their speed vectors and to control the fountain height by an analog output voltage.
Introduction
The definite detection of objects (here, people) in public places is quite challenging. The processed image is affected by the variation of shadows, vehicles, and other large objects, which normally cause a significantly higher detection rate than the objects of interests. This paper shows how specific IMAQ Vision image processing algorithms provide the separation of the desired information. The two digital video cameras are connected to a PC using the serial bus system IEEE 1394 via plastic optical fiber. Due to the relatively large distance between the PC and the fountain control, 6B modules were used for the voltage output.
Fountain Control Hardware
Figure 5.76 shows the Villach city hall square with the new interactive fountain in the front. The position of the two FireWire cameras is indicated by the circles; one of them has its focus on the surrounding of the fountain, the other one is able to watch the activities on the whole square (see also Figure 5.79).
Figure 5.76. Villach City Hall Square with Interactive Fountain
The hardware used for the interactive fountain control consists of:
- the two 1394 digital cameras (Sony DFW-VL500), including cables and repeaters (wire and plastic optical fibre);
- a PC (Pentium III/550) equipped with a 1394 FireBoard 400 (Unibrain) and an AT-485/2 RS-485 serial interface card (National Instruments);
- a 6B 4-channel backplane with RS-485 interface for the two required 6B modules:
- a 6B21 current output module provides the control output signal for the fountain;
- a 6B12 voltage and current input module. This module is used as input for a wind sensor; in case of strong wind, the software reduces the fountain water height.
Figure 5.77 shows the fountain control box with the control unit itself on the left side (installed by a third company). The current output of the 6B21 (0 ... 20 mA) is converted into a 0 ... 10 V voltage by means of a 500 m m resistor and connected to the control unit. Also shown in Figure 5.77 is the wind sensor connected to the 6B12 module.
The camera pictures are imported into IMAQ Vision by a 1394 ActiveX control (version 1.4) written by CTI. In case the PC is equipped with 1394 functionality, no further hardware is required for the capturing of the live images.
Figure 5.77. Fountain Control and NI 6B Modules
Object Detection Algorithms
The software part of the project solution has to fulfill the following requirements:
- supervision of the Villach city hall square (two focus areas);
- detection and counting of "objects" (people) on the square;
- calculation of their speed vectors;
- electrical output of values representing the number of people on the square (absolute fountain water height) and their movement (frequency of fountain water height variation).
Figure 5.78 shows the principle of the object detection algorithm. The actual picture (top-left side of Figure 5.78) is subtracted from a so called "idle picture" using the function IMAQ Subtract twice, in order to get significant difference values for light and dark areas of the image. The two differences are added to one single picture using the IMAQ Add function.
The idle picture, representing the empty city hall square, is generated by calculating the mean pixel value out of a number (here, 8) of actual pictures, taken in distances from some seconds up to a few minutes. This algorithm guarantees a dynamic generation of the idle picture, resulting in insensitiveness to moving shadows, parking vehicles, and other large objects, which otherwise would cause a significantly higher detection rate than the objects of interests.
Further image processing is done by using the functions IMAQ Threshold (creates a binary image) and IMAQ RemoveParticle (keeps particles resistant to a specified number of 3 x 3 erosions). The remaining particles are marked in the original picture (see also Figure 5.79).
Figure 5.78. Principle of the Object Detection Algorithm
Another possibility is the use of the function IMAQ BCGLookup instead of IMAQ Threshold and further processing with the appropriate IMAQ GrayMorphology functions. This will keep particles more consistent because the image is not converted to binary values.
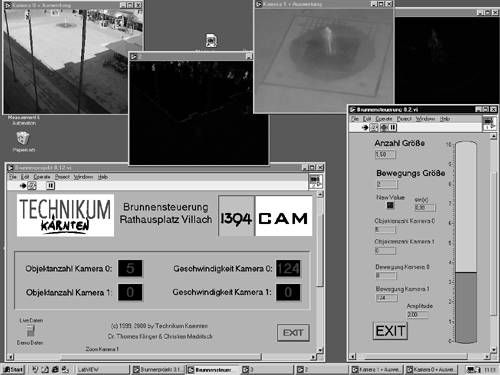
Figure 5.79 shows the user interface of the fountain control software. Two VIs are running; one of them (left side of Figure 5.79) displays the images, executes the detection algorithms, and calculates the values for the number of objects and for their speed, respectively. The other one (right side of Figure 5.79) determines the fountain height value (represented by the tank indicator) and controls the 6B modules.
Figure 5.79. User Interface of the Fountain Control Software
Extracting GIS Data for Telecom Networks from City Maps
by Thomas KLINGER, Peter BACHHIESL, Gernot PAULUS, Joachim WERNER, and Herbert STOEGNER
(Paper presented at NIWeek 2002) [45]
(similar paper presented at VIP 2003, Munich)
Category
- Communication
Products Used
- LabVIEW Version 6i
- IMAQ Vision for LabVIEW Version 6.0.1
The Challenge
For the use of a previously developed tool (NETQUEST), which represents a digital workflow for the computation of cost-optimized layouts for fiber optic access networks, very little geographic data is present. A tool was needed which extracts rough geodata out of city maps.
The Solution
We developed an IMAQ Vision program that is able to read in city maps (from paper scans or the World Wide Web), to extract relevant classes ( streets , buildings , or similar), and to transfer the result into an output format which can be used by NETQUEST.
Motivation
During the last two years, European network- carriers have invested 7.5 billion Euro in the implementation of fiber optic networks mainly in the expansion of the core and the distribution net domain (backbones, city backbones, and metropolitan area networks). Investigations have shown that about 95 percent of the total costs for the implementation of a three-layer fiber optic network may be expected for the areawide realization of the last mile (access networks). Therefore, the expansion of the access net domain represents the bottleneck of modern network architectures. In order to achieve a return on investment, carriers will be forced to link access net nodes, like corporate clients , private customers, or communication nodes for modern mobile services (e.g., UMTS) to their city backbones.
In this context we have focused on the cost-intensive underground work for the implementation of fiber optic cables under real-world conditions. The two stage planning tool NETQUEST represents a full digital workflow for the computation of cost-optimized layouts for fiber optic access networks. This tool combines real-world geo-information data (land-use classes and the according specific implementation costs per meter) with sophisticated methods from mathematical optimization.
NETQUEST is based on digital geodata representing land-use classes (i.e., street network, parcels, buildings, rivers, etc.) which are relevant for network planning. NETQUEST uses this geodata for an appropriate network optimization in two representations: as vector and image format as well.
High-resolution digital geodata is not always available. For any large network domain, high resolution data capture using ground surveying techniques is extremely expensive. On the other hand, raster maps like digital city guide maps are available at comparable low cost and can be used for strategic planning purposes on a general level.
Using the image processing functionality of LabVIEW and IMAQ Vision, we have developed an efficient workflow to extract land-use classes relevant for network planning from low-cost image data sources. These data sets provide an important, cost-efficient input for a GIS in order to assign real-world construction costs ($/m) to each of the land classes. A case study from Leipzig, Germany is presented.
The Layer Extraction Algorithm
In our algorithm, each land-use class is described by a layer represented by a binary bitmap file or a corresponding text file, respectively. The algorithm itself contains the following steps:
- Reduce the map image to a single color plane (hue plane; IMAQ function IMAQ ExtractSingleColorPlane );
- Extract a single color using threshold functions ( IMAQ Threshold , IMAQ Cast Image );
- Remove small objects, which may be unwanted results of thresholding (IMAQ function IMAQ RemoveParticle );
- Close resulting areas, especially holes resulting from map text (IMAQ function IMAQ Morphology /Close);
- (optional) Extract object borders (IMAQ function IMAQ Morphology / Gradient in).
The LabVIEW VI is intended for use in presentations, too; this is why every step of the algorithm can be executed separately. In step 1 it is absolutely necessary to use the hue plane of the image and not the intensity or brightness information. The hue information can be calculated from the RGB values using the following formula:
and is represented by a color angle starting from the red axis.
The threshold function (step 2) can be executed in two different ways; if the color scheme of the city map is always the same, fixed values can be used for the extraction of land-use classes. If the city map uses different colors for land classes, it is possible to define the upper and lower threshold values manually, using cursors in a histogram display. The threshold step of the algorithm is exemplarily shown in Figure 5.80.
Postprocessing Using NETQUEST
In an additional sixth step, the layer is saved as a bitmap or text file. The (previously developed) tool NETQUEST combines all layers , assigning the respective costs per meter for the construction of a fiber optic network. In this case, the classes shown in Table 5.2 were used.
Figure 5.80. Diagram Window of the Layer Extraction Algorithm (Threshold Step)
Table 5.2. Classes Used in NETQUEST
|
Land Class |
Costs per m in Euro |
Map Color |
|---|---|---|
|
Built-up area |
5000 (infinity) |
Red |
|
Private property |
100 |
Green |
|
Public property |
50 |
Light green |
|
Main streets |
500 |
Yellow |
|
Minor streets |
300 |
White |
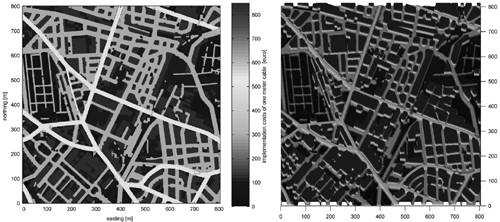
The visualization of this information can be displayed in 2D and 3D images, shown in Figure 5.81. For the final results, NETQUEST uses this information for the calculation of a cost-optimized fiber optic network.
Figure 5.81. Visualization of NETQUEST Results in 2D and 3D View
Feedback Form Reader Using IMAQ Vision
by Thomas KLINGER
(Paper presented at NIWeek 2002) [46]
(similar paper presented at VIP 2003, Munich)
Category
- Academic
Products Used
- LabVIEW Version 6i
- IMAQ Vision for LabVIEW Version 6.0
The Challenge
The students' feedback for the courses at the Carinthia Tech Institute is realized with a feedback form. The evaluation of this form is quite expendable, because it has to be done manually. Afterwards, these values have to be manually transferred into a PC software to get valuable statistical results.
Figure 5.82. Feedback Form Prepared for Automatic Reading
The Solution
A LabVIEW and IMAQ Vision program is able to read the images generated by a flat-bed scanner to extract the relevant data using color information, to measure the value of each answer, and to transfer the data into Microsoft Excel.
Students' Feedback Procedure
In each course at the Carinthia Tech Institute, the students have to fill in a feedback form consisting of ten questions dealing with the course itself and the lecturer. Figure 5.82 shows an example of a form sheet, which is already prepared for automatic reading and evaluation.
Formerly, the students as well as the lecturers had two possibilities:
- Fill out a feedback form on paper. Usually, the students' acceptance is very good for this method; however, manually obtaining a statistical result out of over 1,000 feedback forms is a lot of work to do.
- Use a computer program for the questions and the evaluation as well; this leads to statistical results immediately. On the other hand, students do not prefer this method, because it might be possible to identify the origin of the votes .
Therefore, the combination of both methods is ideal; if paper feedback forms can be read automatically, the students can fill in their feedback forms where- and whenever they want.
Modification of the Feedback Form
First of all, some modifications were made to the original feedback form:
- The area for the students' voting mark is indicated by a red frame (see also Figure 5.82). When the frame is read by the application, only the red plane of the color scan is used, in order to make the red frame disappear. This is the reason why the students are not allowed to use red pens or pencils.
- Three marks are positioned at the beginning of three voting areas, vertically distributed over the entire page; they are used for the location of a starting position, using pattern matching.
Functionality of the Form Reader Software
The results of the algorithm are displayed in the front panel of the Feedback Form Reader (shown in Figure 5.83) and afterwards written to a spreadsheet file, which later can be used for statistical evaluation. The 10 LEDs at the right side of Figure 5.83 indicate whether the mark detection algorithm was successful or not. In order to watch the entire process and to verify the results, a delay of some seconds can be adjusted with a slider control. If the delay is set to 0, it takes about 5 seconds for the scanning of 30 feedback forms.
Figure 5.83. Results of the Form Reader Compared with Original Values
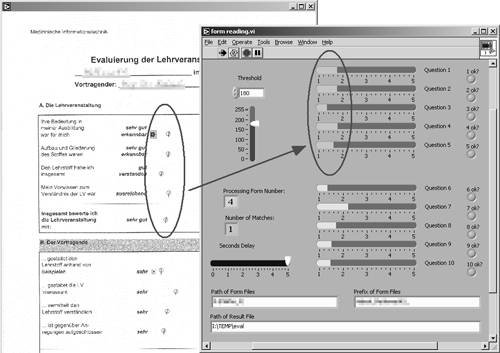
Figure 5.83 also shows the coherence of the marks in the feedback form with the obtained results of the Feedback Form Reader. If the results do not match at all because the marks cannot be detected, it is possible to adjust the threshold level for the edge detection function.
Mark Detection Algorithm
The software has to perform the following functions:
- Detect the exact position of the form sheet using pattern matching andif necessarycalculate a correction factor for the x coordinates of the mark areas.
- Using the x coordinate of the pattern and the correction factor, find out if there is a mark located in the mark area. If a mark is detected with a line profile edge detector, the distance can be calculated and transformed into a value from 1 (very good) to 5 (very bad).
- Collect the calculated values in a n x 10 array, where n is the number of feedback forms, and write this array to disk.
Figure 5.84 shows the diagram of the subroutine find mark.vi . This VI uses the x coordinate from the pattern matching algorithm as input and detects the mark line using the functions IMAQ ROIProfile and IMAQ SimpleEdge . If an edge is found, the Boolean output ok? is set to true.
Figure 5.84. Block Diagram of find mark.vi
The x coordinate of the mark and the x coordinate of the pattern are used for the calculation of the final value (see top-right corner of Figure 5.84). The x and y coordinates of the mark are used to draw a small green circle in the original image at the place the mark was detected (see also Figure 5.83).
Finally, Figure 5.85 shows the integration of find mark.vi into the main program. The entire block diagram is too big to show it here, so only the pattern matching (PM) function and one call of find mark.vi (the evaluation of one question) is shown.
Figure 5.85. Block Diagram of the Main Program
Conclusion
With this program, we found a nearly perfect solution for the combination of the use of handwritten feedback forms and automatic evaluation. Since Autumn 2001, this system is used at the Carinthia Tech Institute with success.
Bibliography |
Introduction and Definitions
- Introduction
- Some Definitions
- Introduction to IMAQ Vision Builder
- NI Vision Builder for Automated Inspection
Image Acquisition
- Image Acquisition
- Charge-Coupled Devices
- Line-Scan Cameras
- CMOS Image Sensors
- Video Standards
- Color Images
- Other Image Sources
Image Distribution
- Image Distribution
- Frame Grabbing
- Camera Interfaces and Protocols
- Compression Techniques
- Image Standards
- Digital Imaging and Communication in Medicine (DICOM)
Image Processing
Image Analysis
- Image Analysis
- Pixel Value Analysis
- Quantitative Analysis
- Shape Matching
- Pattern Matching
- Reading Instrument Displays
- Character Recognition
- Image Focus Quality
- Application Examples
About the CD-ROM
EAN: 2147483647
Pages: 55
