Reading Instrument Displays
A nice set of examples, prepared by National Instruments and almost ready for use, is the instrument-reading functions of IMAQ Vision. Two groups, the reading of an analog needle instrument and the reading of an LCD (liquid crystal display) meter, are provided.
These examples are really self-explaining, so we need not build our own exercises. However, I added some small modifications; you can add your own images to these example programs. If you look at the block diagrams, you will find out that adding images is not difficult.
Analog Instrument Displays
Reading analog needle instruments is an interesting and challenging task. Unlike modern digital instruments, these devices do not have a microcontroller and an interface to a PC, so it is usually impossible to export their measurement data. The IMAQ Vision functions IMAQ Get Meter and IMAQ Read Meter make it possible to convert the image of an analog instrument, using the information of the needle position, into a measurement value that can be further processed by a PC.
Figure 5.59 shows the (slightly modified) meter VI, which is part of the IMAQ Vision examples.
Figure 5.59. Reading an Analog Needle Instrument
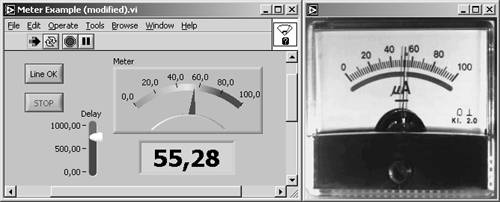
After the program is started, you have to run through the following procedure:
- One special image of the instrument with the needle in the minimum position is displayed. Draw a line on the image of the needle starting at the top and press the Line OK button.
- Another image with the needle in the maximum position is displayed. Repeat the previous step with this image.
The program is now ready to read various meter values if the scale range of the meter (the difference between maximum and minimum position) is provided. In the meter example, this value is hard-coded (see Figure 5.60).
Figure 5.60. Part of the Analog Meter Reading Diagram
A part of the diagram of the meter example, shown in Figure 5.60, illustrates the use of the function IMAQ Read Meter . You can, of course, also use your own images with this example; just put them in the subdirectory Meter and modify the value range in the diagram.
Digital Instrument Displays
Reading digital displays [3] requires different algorithms. An example is also part of one of the application papers (Moving Camera; page 289) [40].
[3] These are also known as liquid crystal displays (LCDs).
Again, I modified an IMAQ Vision example (see the front panel in Figure 5.61). The procedure the user has to go through is quite simple:
Figure 5.61. Reading a Digital LCD Instrument
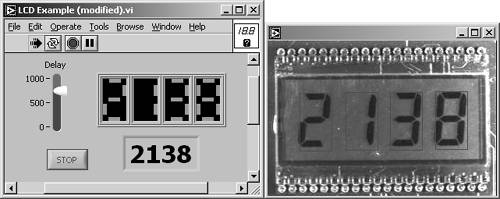
- After the program is started, a single image of an LCD is displayed. Draw a rectangle around all four digits of the LCD and click the OK button.
- The program now reads all available LCD values, which are stored as images in the subdirectory LCD. Again, you can run the VI with your own images.
The example VI uses the functions IMAQ Get LCD ROI and IMAQ Read LCD , similarly to the meter example described in the previous section. See a part of the example diagram in Figure 5.62.
Figure 5.62. Part of the Digital LCD Reading Diagram
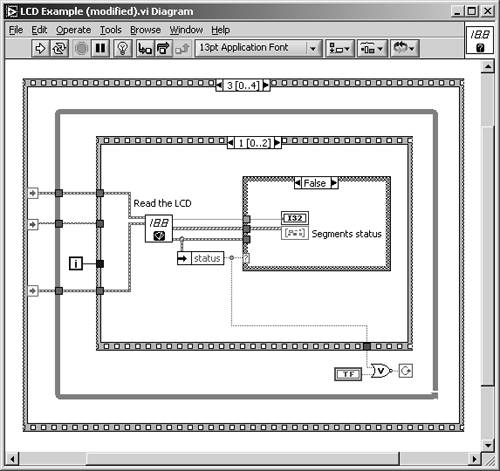
The VI works also with a light emitting diodes (LED) display, which means light segments on a dark background in opposition to the dark segments on a light background of an LCD. To distinguish between these two types of displays, a boolean constant (LCD/LED) is used.
Note also the insensitivity of both meter reading programs to brightness changes of the image. To help you visualize this, the example images show various lighting and intensity situations.
Character Recognition |
Introduction and Definitions
- Introduction
- Some Definitions
- Introduction to IMAQ Vision Builder
- NI Vision Builder for Automated Inspection
Image Acquisition
- Image Acquisition
- Charge-Coupled Devices
- Line-Scan Cameras
- CMOS Image Sensors
- Video Standards
- Color Images
- Other Image Sources
Image Distribution
- Image Distribution
- Frame Grabbing
- Camera Interfaces and Protocols
- Compression Techniques
- Image Standards
- Digital Imaging and Communication in Medicine (DICOM)
Image Processing
Image Analysis
- Image Analysis
- Pixel Value Analysis
- Quantitative Analysis
- Shape Matching
- Pattern Matching
- Reading Instrument Displays
- Character Recognition
- Image Focus Quality
- Application Examples
About the CD-ROM
EAN: 2147483647
Pages: 55
