Script Debugger
When you write a script using FileMaker Pro, your testing and troubleshooting routine is pretty simple. You perform the script and wait to see what happens at the end. In a simple script, like one that prints a report, it's easy enough to see what went wrong and fix it: Your script just went to the wrong layout, perhaps. But when you're creating a complex script that sets variables and works with different sets of records that you can't verify before the next script step whizzes past, it's devilishly hard to figure out where your script veers off course. Even simple scripts can go wrong in puzzling ways that you can't detect by reading over your steps. That's where Script Debugger comes in. When you run scripts with Script Debugger turned on, FileMaker performs scripts at human speed, so you can see exactly what's happening, each step of the way.
Note: To run Script Debugger, you must be logged into the file with a password that has script-editing privileges (Section 16.2.3.6). If a script for which you have editing privileges calls a subscript for which you don't, the subscript will execute but you won't be able to see the steps in the debugger.
19.1.1. The Script Debugger Window
To run a script using Script Debugger, choose Tools  Debug Scripts. Its a toggle command, so a checkmark appears when the debugger's on and disappears when it's off. While the debugger's on, FileMaker shows the Script Debugger window any time you run a script (Figure 19-1).
|
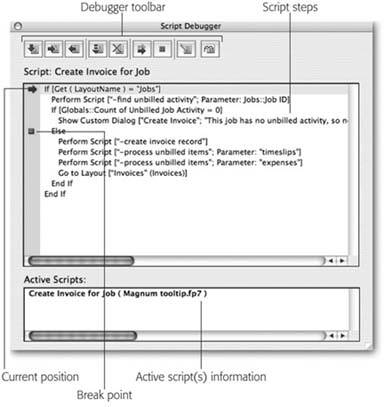
Unlike most dialog boxes, Script Debugger stays on top of your work while your script is running, giving you constant feedback. Because you often need to see what's happening on your layout, you may find yourself moving the debugger window around on your screen so you can keep tabs on data that's being created or edited, changing found sets and the context in which script steps are performed.
You may find that debugging is a whole lot easier on a desktop's monitor, preferably one with a whole lot of screen real estate. Often, you need to see two or more FileMaker windows and Debugger at the same time. (Now that most laptop computers have higher resolutions, though, you may be able to arrange a laptop's screen so that you can see at least one FileMaker window that's unobscured by Debugger.) For instance, when you're pushing or pulling data from one table to another (Section 15.5.6.3.3) you may need to see the layout for the source table as well as the target table, so you can see if the data's moving into the proper fields. Or, if you're using lots of Go to Related Record steps to create your found sets, one layout can show the parent records and another can show the child records. See the box on Section 19.3 for more debugger tips.
Tip: You can resize the debugger window by dragging the handle in the bottom right corner. Make it smaller so you can see more of your database in the background or make it larger if you have long script names, lots of indented If or Loop steps, or subscripts with script parameters.
19.1.1.1. Debugger toolbar
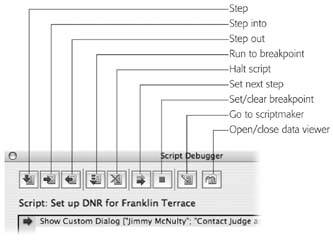
The most important part of the debugger is its toolbar: Its nine buttons give you all the control you could ever want over running scripts. Unfortunately, the buttons don't have names, so you have to either learn what each icon means, or spend a lot of time pointing at things and waiting for the little yellow tooltip to appear. For reference, Figure 19-2 shows the debugger's tools.
|
Stepping through a script. The first three buttons on the debugger toolbar all have "step" in their names. When you first start a script with the debugger, it doesn't start running. Instead, you see all the steps in the script, and the Current Position arrow (see Figure 19-1) points to the first step. This arrow always points to the next step that will run. If you just want to run that single step, click Step. The step runs, FileMaker moves the arrow to the next step in the list, and everything stops again, waiting for you to do something else. With this behavior in mind, you can easily step through the script line by line. You can see how your If and Loop steps work (by following the arrow), and you can watch things happen in your database windows while the script runs.
When the Current Position arrow points to a Perform Script step, the Step button runs the subscript as one unit. In other words, it run the whole subscript without stopping and then moves the arrow to the next line in this script. Click Step Into instead if you want to move into the subscript and step through it line by line. The last Step button is called Step Out. When you click this button, FileMaker finishes the current script, and returns you to the one that called it. Then you can step through that script line by line. If you click Step Out from a script that wasn't called by another script, FileMaker just finishes the script and closes the debugger window.
Breakpoints. If clicking a button for each step starts to wear on yousay you've got a looping script with a whole slew of stepsyou can use Run to Breakpoint instead. Often when you debug a script, you know the first several lines work fine, and you want to fast-forward to the part that seems to be broken. You can tell the debugger where to stop and pausea breakpoint. Just select the line you want to get to, and click Set/Clear Breakpoint (you can also just click the gray bar to the left of the script step). FileMaker adds a breakpoint symbol by the step name. (To remove a breakpoint, click it or select the step and click Set/Clear Breakpoint again.)
Then click Run to Breakpoint. FileMaker abandons the line-by-line approach and starts running through the script normally; that is, as fast as it can. The script runs until it ends, or until it hits a breakpoint. Once the breakpoint is reached, the debugger switches back to line-by-line mode.
Note: When you click Run to Breakpoint, FileMaker stops at the first breakpoint it finds. If your script calls other scripts, and they have breakpoints, it may stop inside another script before it gets back to your breakpoint. If that happens, click Run to Breakpoint again to move to the next one.
Skipping and repeating. If you want to completely skip a step (or a series of steps), simply select the next step you want to run, and then click Set Next Step. FileMaker moves the Current Position arrow down to the new step, but doesn't run any of the steps in between. You can also repeat steps you've already run by selecting a line higher up in the script before clicking Set Next Step. Either way, FileMaker stops at the new line so you can use the Step buttons to go line by line from there.
Stopping. If you get halfway through a script and then spot the problem, you can stop the script right away without stepping to the end. Just click Stop Execution and the debugger window disappears, leaving you wherever the script left off.
Once you've been debugging for a while, you may forget you have it on. To your chagrin, the debugger window pops up when you expect to see the script running. Don't feel badit happens to professional developers all the time. Just click Stop Execution right away, turn off the debugger, and then run the script again. When the debugger first appears, nothing has happened yet, so it's always safe to stop before you step. (If you have breakpoints set throughout your scripts, you can use Stop Execution rather than repeatedly clicking Run to Breakpoint to get to the end of the script.)
Editing. More often than not, you want to edit the script you're debugging once you've found the problem. Normally you'd have to switch to the right file, open ScriptMaker, and then scroll to the right script. But the Go to ScriptMaker button can do all this for you. Click it, and FileMaker opens ScriptMaker with the right script already selected.
The Go to ScriptMaker button is useful even when you don't necessarily need to debug. Suppose you have a button on a layout, and you want to edit the script it runs. Trouble is, you're not exactly sure which script that is. The quickest way to find outand get to the scriptis to turn on the debugger, click the Go to ScriptMaker button, and then click ScriptMaker's Edit button. You go directly to the script in just three clicks.
19.1.1.2. Script steps
Most of the debugger window is devoted to showing you the steps in the script that's running. You can't edit the steps here, but you can select them, and scroll up, down, right, or left to see more. The gray bar running along the left side of the list of steps is just a place for the Current Position arrow and breakpoints to live. You can click this bar to set or remove breakpoints directly. (This same bar appears in the Edit Script window when you're creating or editing scripts using FileMaker Advanced, so you can add breakpoints there, too.)
19.1.1.3. Active script(s) information
The bottom part of the window shows you detail about the active scriptin other words, the script that's running right now. It shows the name of the script, the file it lives in, and the value, if any, of the script parameter it had when it started.
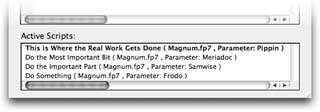
But why's this box so big if it just shows a few facts about one script? Because it can actually show a few bits about lots of scripts. Every time a script performs another script, it moves down in the list to make room for the new script's information. FileMaker puts the top-mostand currentscript in boldface at the top of the list. Below it, you see the script that came before. If that script was itself run by another script, that first script's then third in the list. You can see how this looks in Figure 19-3.
Click on a script in the list to switch the debugger's view to the new script. The Current Position arrow changes color (white with blue outline) to indicate that you're viewing a script that doesn't include the current script step.
|
19.1.1.4. Data Viewer
The last button on Script Debugger's toolbar shows you the Data Viewer, a handy little window that lets you see the current values in script variables, fields, and calculations. You create a list of values that you want to keep an eye ona watch listand then use this box to see exactly what happens to them as you debug. Make heavy use of this little gem and you may find that you rarely need to switch layouts while Debugger's running because you can monitor all your data through the Data Viewer. Before the viewer can show you any data, you have to tell it what to watch. Figure 19-4 shows you the Data Viewer window and its tools.
|
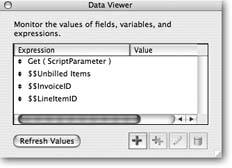
When you open the Data Viewer for the first time, there's nothing in its watch list yet. To add a watch item, click the + sign. In the window that opens, you tell FileMaker what fields and calculations you want to inspect. It works much like the Specify Calculation dialog box (Section 9.2), but with a few changes and a couple of extras:
- The Expression field is where you type your calculation.
- Click Evaluate Now to see a live evaluation of the calculation you're building in the Result field.
- The "OK" button says Monitor instead. When you click it, the new item appears in the watch list's Expressions column.
In all other respects, this dialog box works just like Specify Calculation. If you're using Data Viewer in conjunction with Script Debugger, you want it to monitor the fields and variables in the script you're troubleshooting. For example, if you wanted to troubleshoot the Create Invoice for Job script, you'd need to add its variables to the Data Viewer. The formula for watching a variable is just the variable's name. Since variables aren't tied to tables, they don't appear in the Fields list, so you have to manually type in the names. But if you want to monitor a function, like Get ( ScriptParameter ), you pick it from the function list.
Items in your watch list may or may not show values when you tell Data Viewer to monitor them. Their behavior is determined by what you're monitoring and when you add the item to the watch list. Here are some guidelines:
- Local script variables are usually blank when you first create them, since they're set only when a script step runs.
- Global variables set by scripts may or may not have values in them when they're created. You see a value if you run the script that sets a global variable after you open the file, but before you monitor the global variable. If you haven't run a script that sets the global variable since the last time the file was closed, the value's blank.
- Local and global variables set by calculations display their values upon creation.
- Functions that monitor continually evaluated processes (like Get ( Account-Name ) ) show their current value when you create them. These values don't update unless you click the Refresh Values button, though.
- Field values, like Customers::Last Name, have values based on the record that's active when you add the item to the watch list. Field values don't update automatically when you scroll through records. Like functions, click Refresh Values to see the updated value.
Once you've added all the items you want to monitor to Data Viewer's watch list, run your script with the debugger turned on. As a script steps sets a variable or runs a function, you see the updated value in the Value column. By watching your layouts, running Script Debugger, and monitoring Data Viewer, you've got plenty of help troubleshooting misbehaving scripts.
Warning: Anybody with FileMaker Pro Advanced can fire up Data Viewer and monitor the values in local and global variables, even if their privilege set doesn't allow them to peek into certain fields or layouts. Using local variables doesn't alleviate the security problem entirely, but it makes it a little harder for folks to peek at the data, since the script that sets a local variable has to be running in order to see the value in it.
Data Viewer isn't attached to any particular file, so its watch list contents don't change when you open and close files. The viewer can even be open while you have no databases open. Since all files and scripts share the same watch list, it can quickly get long and hard to monitor. Select items you aren't using, then click the trash can icon to delete them.
You can also use Data Viewer to test a calculation before you define a field for it, or add it to a testing step in a script. Click the Evaluate Now button to see the calculation's value, and then tweak the formula and reevaluate it until you get it working. Then just copy the formula and paste it into a field definition or script step.
| GEM IN THE ROUGH Unlooping the Loop |
|
If you're familiar with debuggers for other systems, you might have noticed that FileMaker's debugger is missing a conditional breakpoint. In other words, you can't set a breakpoint that stops the script sometimes but lets it continue other times. If you have a long script that does a lot of looping, and you want to see what's going wrong the 237th time through the loop, then you find yourself in debugger hell. If you set a breakpoint in the loop, you have to click Run to Breakpoint 236 times to get where you want to start stepping. If you put it outside the loop, then FileMaker runs right past the problem and you don't get a chance to see what's happening. To solve this problem, add an If step inside the loop with a comment inside. Make sure the comment is reached only when you want to stop, and then set a breakpoint on the comment itself, as pictured here. Now FileMaker runs through the loop until it gets right where you want, and only then does it find the breakpoint. 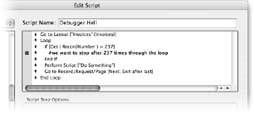 |
19.1.1.5. Debugging Controls submenu
If you prefer menus to toolbars, or keyboard shortcuts to mouse clicks, then the Tools Debugging Controls menu is tailor-made for you. This menus grayed out until you start running a script with the debugger. Then the menu becomes active, with all your tools (complete with shortcuts), represented in the submenu. Plus, you get a new command, Remove Breakpoints, which does just what it promises, removes all the breakpoints in the script that's currently running.
The ScriptMaker command in the Debugging Controls submenu is different from the ScriptMaker command on the Scripts menu, which does nothing but open ScriptMaker, with no scripts highlighted. Choosing ScriptMaker from the Debugging Controls submenu stops the script that's running in the debugger, closes the debugger window and opens ScriptMaker, with the now-stopped script highlighted. Just double-click the highlighted script to edit it.
Part I: Introduction to FileMaker Pro
Your First Database
- Your First Database
- An Very Quick Database Tour
- Creating a New Database
- Opening and Closing Database Files
- Saving Your Databases
- Adding Records to Your Database
- Navigating Your Database
- Same Database, Multiple Windows
Organizing and Editing Records
- Organizing and Editing Records
- Views
- Advanced Find Mode
- Changing Multiple Records
- Sorting Records
- Editing Whats in Your Fields
- Paragraph Formatting
- Beyond Text: Container Fields
- Checking Spelling
- Printing and Preview Mode
Building a New Database
- Building a New Database
- Tables and Fields
- Defining Fields
- Advanced Field Options
- Bringing It All Together
Part II: Layout Basics
Layout Basics
Creating Layouts
Advanced Layouts and Reports
- Advanced Layouts and Reports
- Setting up Field Controls
- Adding Field Controls to Layouts
- Field Behavior
- Tab Order
- Print-Related Layout Options
- Format the Number/Date/Time/Graphic
- Adding Buttons
- Tab Panels
- Reports and Summary Fields
Part III: Multiple Tables and Relationships
Multiple Tables and Relationships
- Multiple Tables and Relationships
- Relational Databases Explained
- Modeling Your Database
- Creating a Relational Database
- Relational Databases
Advanced Relationship Techniques
- Advanced Relationship Techniques
- Creating Related Records
- Table Occurrences
- Managing Data with Data Tunneling
- Building a Data Tunneling Interface
- Connecting Databases
- Lookups
- Advanced Relationships
Part IV: Calculations
Introduction to Calculations
- Introduction to Calculations
- Understanding Calculations
- The Structure of a Calculation
- Creating a Calculation Field
- Auto-Enter Calculations
- Validate Data Entry with a Calculation
- Replacing Data Using a Calculation
- Comments
Calculations and Data Types
- Calculations and Data Types
- Number Crunching Calculations
- Going Beyond Basic Calculations
- Text Parsing Calculations
- Date and Time Calculations
- Containers in Calculations
Advanced Calculations
- Advanced Calculations
- Stored, Unstored, and Global Fields
- Logical Functions
- The Let Function and Variables
Extending Calculations
Part V: Scripting
Scripting Basics
- Scripting Basics
- Your First Script
- The Importance of the Layout
- Running Scripts
- Branching and Looping in Scripts
Script Steps
- Script Steps
- Go to Layout
- Scripting for Fields
- Working with Records
- Finding Records
- Sorting Records
- Working with Windows
- Working with Files
- Printing
- Other Script Steps
Advanced Scripting
- Advanced Scripting
- Commenting Scripts
- Asking and Telling the User
- Organizing Complex Scripts
- Handling Errors
- Putting a Complex Script Together
Part VI: Security and Integration
Security
Exporting and Importing
- Exporting and Importing
- Exporting a File
- Export Formats
- Importing Data
- Import Data Sources
- Importing and Exporting in a Script
Sharing Your Database
- Sharing Your Database
- FileMaker Network Sharing
- Sharing Over the Internet
- FileMaker Server
- Server Hardware
Developer Utilities
- Developer Utilities
- Script Debugger
- Disable Script Steps
- The Database Design Report
- Tooltips
- Copying Database Structure
- Custom Menus
- Developer Utilities
- File Maintenance
Part VII: Appendixes
Appendix A. Getting Help
EAN: 2147483647
Pages: 176
