Understanding Subreports
The first 11 chapters of this book introduced you to the design of individual reports using single aggregated datasets. Crystal Reports provides further flexibility and reporting capabilities through the use of additional reports embedded directly within an original main report. These embedded reports, referred to as Subreports, provide enhanced value extending your reporting solutions into an expanded domain that will be explored in this chapter.
This chapter covers the following topics:
- A description of Subreports
- The usefulness and value of Subreports
- Linked versus Unlinked Subreports
- In-Place versus On-Demand Subreports
- Passing data between the main report and Subreports
The next two sections provide you with
- An introduction to Subreports
- An idea of when you might use them
- A lesson on how to use Subreports
Crystal Reports provides the capability to embed multiple Crystal Reports within a single existing main report to allow for increased flexibility in report creation. Think of these Subreports as entire reports within reports, which can contain their own data sources, formatting, and record selections. The embedded Subreports can be created from existing Crystal Reports files or can be dynamically created at report design time using the insert Subreport functionality. When presenting a report that contains one or more Subreports to business users, the Subreports can be displayed either in-place, providing a seamless integration, or on-demand, minimizing the amount of required up-front report processing.
Common Subreport Usage
A few particular reporting problems are difficult to solve without the use of Subreports. Some of the most common problems and a specific example of each are listed here:
- The presentation of data from two (or more) completely unrelated data sources on a single report. Specific Example: On a Manufacturing Plant Efficiency report sourced from your internal SAP system, you want to display industry average information sourced from a completely different and unrelated industry or trade database.
- A report that needs to combine data from different tables with only derived (and not direct) database field links. Specific Example: On a Customer Profile report, you want to combine Order Information from your ERP (for example, SAP, Oracle, Baan) system with call-center information from your call-center application (for example, Remedy) and your CRM system (for example, Siebel, PeopleSoft), but the employee ID field is stored slightly different in each system. The Subreports enable the linking of the different employee IDs by allowing linking on formulas or derived fields.
- The presentation of the same data in two (or more) different ways in a single report. Specific Example: On a Sales Summary Report, senior management wants to present a high-level summary of sales by region but also wants to present a separate and personalized summary of sales by product for each salesperson who will be viewing the report.
- The inclusion of a summary field in the report that is unrelated to the established grouping in the main report. Specific Example: On an employee HR report, HR managers want to see employee salary information grouped by Business Unit, Division, and Department. Additionally, they want to view a count of the different departments that this employee worked for in the previous year. The main report groups employees by department (and by division and business unit), whereas the Subreport groups departments by employee to determine a department count.
- The inclusion of a reusable component like a standard reporting header or footer in numerous reports across an organization that can be dynamically updated for all reports in a single location. Specific Example: A firm wants to deploy all reports in its organization with a standard header including standard logos and titles. In addition to using the new Report Templates and Repository, Subreports can be used within all the reports as a header and provide a single location for updating the header across all the reports.
Data presented in Subreports is often related to the data presented in the associated main report, but it does not have to be. Subreport data can be a twist on the main report's information or sourced from a completely different database.
Adding Subreports to Your Reports
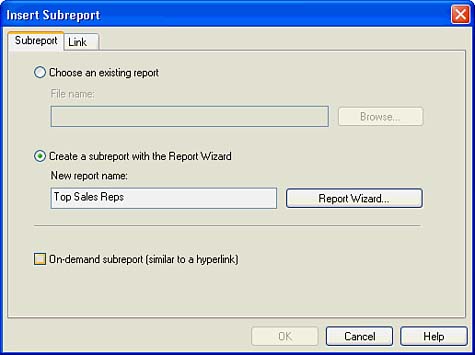
Adding a Subreport to your main report is as easy as adding any other Crystal Reports object. After selecting the Subreport option from the Insert menu, you are presented with the Insert Subreport dialog (see Figure 12.1).
Figure 12.1. The Insert Subreport dialog enables you to add a Subreport to your main report.
To explore one of the many challenges solved by using Subreports, let's solve the hypothetical reporting problem faced by the Chief Operating Officer (COO) of Maple Leaf Bikes Corporation. This COO wants a single report that highlights the recently acquired company's (Xtreme) top-selling products in one bar chart and additionally highlights the company's top selling sales reps in a corresponding pie chart. The two charts are sourced from the same sales information but have no direct relation or links to each other. To resolve this request, complete the following steps:
- Create a New Report and point this report at the Xtreme Sample Database 10.
- Select the Orders, Order Detail, and Product Tables and then select the Product Name and Order Amount Fields to Display on the report.
- Group the report by Product Name and Add a Summary to the report that sums Order Amount for each Product Name group. Also limit the report to display only the top five groups based on the Summarized Field. (Reminder: You can use the Group Sort Expert under the Report menu option to accomplish this last task and remember to explicitly not include an Others group by selecting that check box.)
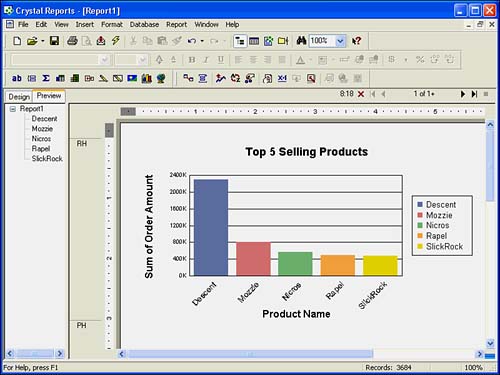
- Add a bar chart in the Page Header to represent the top five selling products, and you should have a report similar to that depicted in Figure 12.2.
Figure 12.2. Preliminary sample report to solve COO problem.
- Make room for the COO's requested second visual by resizing the bar chart to only take up half of the page header's width.
- Select the Insert Subreport option by either accessing that option from the Insert menu or clicking on the Insert Subreport icon. The Insert Subreport dialog in Figure 12.1 appears.
- Select the Create a Subreport with the Report Wizard option by clicking on the associated radio button.
- Enter a Name similar to Top Sales Reps and click on the Report Wizard button.
- As you step through the familiar Report Wizard to create this Subreport, select the Xtreme Sample Database 10 and the Employee and Orders tables. From the list of available fields, select the First Name and Order Amount.
- Group the Subreport on Employee First Name and create a Summary on the Sum of Order Amounts for each Employee Group. Limit the report to display the top five employees based on this sum, add a pie chart to this report, and click the Finish button.
- Ensure that the On-Demand Subreport check box is unchecked, and then click OK on the Insert Subreport dialog. Drop the Subreport on the right side of the main report so that it does not overlap the existing bar chart. The details of On-Demand reports are described later in this chapter.
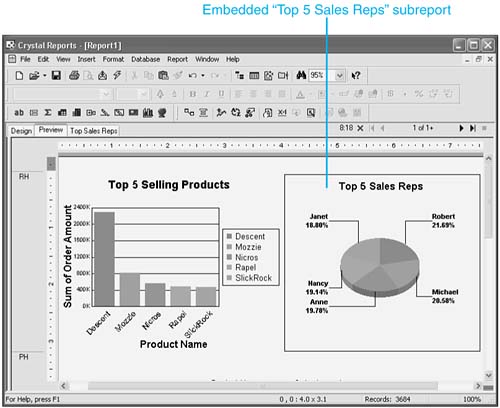
- To clean up the final presentation of your main report and included Subreport, edit the Subreport by right-clicking on it and then hiding all the sections of the report except the report header a. As a reminder, hiding sections is accomplished by right-clicking on the name of the involved sections in the Design or Preview tab and selecting the Hide option. Lastly, delete the report header b section in the Subreport. Figure 12.3 shows the final result of this quick report. If your final result appears slightly different, review Chapter 8, "Visualizing Your Data with Charts and Maps," and revise the charts accordingly.
Figure 12.3. Sample report with Subreport to solve COO problem.
NOTE
As mentioned in the previous sections, Subreports are Crystal Reports in their own right, and as such they have their own Design tab in the Crystal Reports Designer. To format the details of a Subreport, it is necessary to open the Design tab for that Subreport from within the Designer of the main report. This can be accomplished by right-clicking on a Subreport and selecting the Edit Subreport option. Figure 12.3 displays the tabs for both the sample's main report and the Subreport.
With that introduction to Subreports, you should begin to see some of the flexibility and power that they offer in solving difficult reporting (and even dashboard-related) problems. The next few sections explore this in more detail.
Part I. Crystal Reports Design
Creating and Designing Basic Reports
- Creating and Designing Basic Reports
- Introducing the Crystal Reports Designer
- Understanding Data and Data Sources
- Introduction to the Data Explorer
- Adding Database Objects to Your Report
- Joining Database Objects Together
- Understanding the Different Join Types
- Using the Report Creation Wizards
- Understanding the Crystal Reports Gallery
- Using the Standard Report Creation Wizard
- Creating a Report Without Wizards
- Troubleshooting
Selecting and Grouping Data
- Selecting and Grouping Data
- Introduction
- Understanding Field Objects
- Working with Groups
- Understanding Drill-down Reports
- Troubleshooting
Filtering, Sorting, and Summarizing Data
- Filtering, Sorting, and Summarizing Data
- Introduction
- Filtering the Data in Your Report
- Learning to Sort Records
- Working with the Sort Expert
- Creating Effective Summaries
- Troubleshooting
Understanding and Implementing Formulas
- Understanding and Implementing Formulas
- Introduction
- Using the Formula Workshop
- Using the Workshop Formula Editor
- Creating Formulas with the Formula Expert
- Using the Formula Extractor to Create Custom Functions
- The Multi-Pass Reporting Process of the Crystal Reports Engine
- Troubleshooting
Implementing Parameters for Dynamic Reporting
- Implementing Parameters for Dynamic Reporting
- Introduction
- Understanding the Value of Parameters
- Creating and Implementing Parameters Fields
- Using Parameters with Record Selections
Part II. Formatting Crystal Reports
Fundamentals of Report Formatting
- Fundamentals of Report Formatting
- Introduction
- Positioning and Sizing Report Objects
- Modifying Object Properties for Formatting Purposes
- Exploring the Format Editor Dialog Common Options
- Combining and Layering Report Objects
- Configuring Report Page and Margin Properties
Working with Report Sections
- Working with Report Sections
- Introduction
- Formatting Report Sections
- Modifying Report Section Properties
- Using Multiple Report Sections
- Troubleshooting
Visualizing Your Data with Charts and Maps
- Visualizing Your Data with Charts and Maps
- Introduction to Charts and Maps
- Using the Chart Expert
- Using the Map Expert
- Modifying Chart and Map Properties
- Troubleshooting
Custom Formatting Techniques
- Introduction
- Making Presentation-Quality Reports
- Common Formatting Features
- Conditional Formatting Using Data to Drive the Look of a Report
Part III. Advanced Crystal Reports Design
Using Cross-Tabs for Summarized Reporting
- Using Cross-Tabs for Summarized Reporting
- Introduction to Cross-Tabs
- Benefits of Cross-Tabs
- Using the Cross-Tab Wizard
- Using Top N with Cross-Tabs Reports
- Using Advanced Cross-Tab Features
Using Record Selections and Alerts for Interactive Reporting
- Using Record Selections and Alerts for Interactive Reporting
- Creating Advanced Record Selection Formulas
- Adding Alerting to Your Reports
- Performance Monitoring and Tuning
Using Subreports and Multi-Pass Reporting
- Using Subreports and Multi-Pass Reporting
- Understanding Subreports
- Understanding Linked Versus Unlinked Subreports
- Considering Subreport Execution Time and Performance
- Using Variables to Pass Data Between Reports
- Emulating Nested Subreports
- Troubleshooting
Using Formulas and Custom Functions
- Using Formulas and Custom Functions
- Becoming More Productive with Formulas
- Choosing a Formula Language: Crystal Versus Basic Syntax
- Using Brackets in Formulas
- Using Characters in Formulas
- Recent Improvements to Formulas
Designing Effective Report Templates
- Designing Effective Report Templates
- Understanding the Importance of Reuse in Reporting
- Understanding Report Templates
- Using Report Templates
- Using Existing Crystal Reports as Templates
- Understanding How Templates Work
- Creating Useful Report Templates
- Using Template Field Objects
- Using Report Templates to Reduce Report Creation Effort
- Applying Multiple Templates
Additional Data Sources for Crystal Reports
- Additional Data Sources for Crystal Reports
- Understanding the Additional Crystal Reports Data Sources
- Connecting to COM-based Data Sources
- Connecting to Java-based Data Sources
- Understanding Solution Kits for Crystal Enterprise
- Troubleshooting
Multidimensional Reporting Against OLAP Data with Crystal Reports
- Multidimensional Reporting Against OLAP Data with Crystal Reports
- Introduction to OLAP
- OLAP Concepts and OLAP Reporting
- Recently Added or Changed OLAP Features in Crystal Reports
- Using the OLAP Report Creation Wizard and OLAP Expert
- Advanced OLAP Reporting
- Introduction to Crystal Analysis
Part IV. Enterprise Report Design Analytic, Web-based, and Excel Report Design
Introduction to Crystal Repository
- Introduction to Crystal Repository
- What Is the Crystal Repository?
- Why Implement the Crystal Repository?
- Installing the Crystal Repository
- Adding Objects to and from the Repository
- Migration of the Crystal Enterprise Repository
- Troubleshooting
Crystal Reports Semantic Layer Business Views
- Crystal Reports Semantic Layer Business Views
- Introduction to Business Views
- Why Implement Business Views?
- Performance and Implementation Considerations
- Business Views Architecture and Implementation
- Troubleshooting
Creating Crystal Analysis Reports
- Creating Crystal Analysis Reports
- Introduction
- Introducing Crystal Analysis
- Accessing OLAP Data with Crystal Analysis
- Designing Crystal Analysis Reports and Applications
- Adding Crystal Analysis Objects to a Report
- Troubleshooting
Advanced Crystal Analysis Report Design
- Advanced Crystal Analysis Report Design
- Introduction
- Advanced Crystal Analysis Designer Tools
- Custom Calculations and Advanced Data Analysis
- Setting Report Options
- Troubleshooting
- Crystal Analysis in the Real World MDX
Ad-Hoc Application and Excel Plug-in for Ad-Hoc and Analytic Reporting
- Ad-Hoc Application and Excel Plug-in for Ad-Hoc and Analytic Reporting
- Introducing Ad-Hoc Reporting Conceptually
- Introducing the Crystal Enterprise Ad-Hoc Reporting Application
- Crystal Reports Excel Plug-in
- Crystal Analysis Excel Plug-in
Part V. Web Report Distribution Using Crystal Enterprise
Introduction to Crystal Enterprise
- Introduction to Crystal Enterprise
- What Is Crystal Enterprise?
- Why Implement a Crystal Enterprise Solution?
- Versions of Crystal Enterprise
- Understanding the Core Functions of Crystal Enterprise
Using Crystal Enterprise with Web Desktop
- Using Crystal Enterprise with Web Desktop
- Introduction
- Crystal Enterprise User Launchpad
- Crystal Enterprise Web Desktop
- Customizing the Web Desktop and Report Viewers
- Publishing to the Web Desktop
- Customizing the Web Desktop
- Troubleshooting
Crystal Enterprise Architecture
- Crystal Enterprise Architecture
- Introduction
- Crystal Enterprise Architecture Overview
- The Client Tier
- The Application Tier
- The Server Tier: Introduction to the Crystal Enterprise Framework
- The Server Tier: Overview of the Crystal Enterprise Services
- The Data Tier
- The Crystal Enterprise Architecture in Action
- Taking Advantage of the Crystal Enterprise Distributed Architecture
- Extending Crystal Enterprise
Planning Considerations When Deploying Crystal Enterprise
- Planning Considerations When Deploying Crystal Enterprise
- Ensuring a Successful Crystal Enterprise Implementation
- Approaching the Project
- Identifying Business Pain
- Establishing Project Requirements
- Understanding Organizational Reporting Requirements
- Troubleshooting
Deploying Crystal Enterprise in a Complex Network Environment
- Deploying Crystal Enterprise in a Complex Network Environment
- Introduction
- Understanding Network Protocols
- Understanding Firewall Types
- Configuring the Crystal Enterprise Architecture for Your Network Environment
- Interaction Between the WCS and the WC
- Deploying Crystal Enterprise with an IP Packet Filtering Firewall
- Using Crystal Enterprise with NAT
- Exploring the NAT and Crystal Enterprise Relationship
- Crystal Enterprise and Proxy Servers
Administering and Configuring Crystal Enterprise
- Introduction
- Using the Crystal Management Console
- Managing Accounts
- Managing Content
- Introducing Servers
- Managing Crystal Enterprise System Settings
- Using the Crystal Configuration Manager
Part VI. Customized Report Distribution Using Crystal Reports Components
Java Reporting Components
- Java Reporting Components
- Overview of the Crystal Reports Java Reporting Component
- Understanding the Java Reporting Components Architecture
- Differences with the Java Reporting Engine
- Configuring the Application Server
- Delivering Reports in Web Applications
- Using the Crystal Tag Libraries
- Exporting Reports to Other File Formats
- Printing Reports from the Browser
- Common Programming Tasks
- Troubleshooting
Crystal Reports .NET Components
- Crystal Reports .NET Components
- Understanding Microsofts .NET Platform
- Understanding the Different Crystal .NET Components
- An Overview of the Crystal Reports 10 .NET Components
- The Report Designer
- The Report Engine Object Model
- Delivering Reports with the Windows Forms Viewer
- Delivering Reports with the Web Forms Viewer
- Database Credentials
- Setting Parameters
- Troubleshooting
COM Reporting Components
- COM Reporting Components
- Understanding the Report Designer Component
- Building Reports with the Visual Basic Report Designer
- Programming with the Report Engine Object Model
- Delivering Reports Using the Report Viewer
- Troubleshooting
Part VII. Customized Report Distribution Using Crystal Enterprise Embedded Edition
Introduction to Crystal Enterprise Embedded Edition
- Introduction to Crystal Enterprise Embedded Edition
- Introduction to Crystal Enterprise Embedded Edition
- Understanding Crystal Enterprise Embedded Edition
- Crystal Enterprise Embedded Edition Samples
- DHTML Report Design Wizard
- Troubleshooting
Crystal Enterprise Viewing Reports
- Crystal Enterprise Viewing Reports
- Viewing Reports over the Web
- Introduction to the Crystal Report Viewers
- Understanding the Report Source
- Implementing the Page Viewer
- Implementing the Part Viewer
- Implementing the Interactive Viewer
- Implementing the Grid Viewer
- Troubleshooting
Crystal Enterprise Embedded Report Modification and Creation
- Introduction
- Deploying RAS Environments
- Loading Report Files
- Locating RAS Components in a Network Architecture
- Installing the RAS SDK
- Best Practices in RAS Exception Handling
- The RAS SDK in Action
Part VIII. Customized Report Distribution Using Crystal Enterprise Professional
Introduction to the Crystal Enterprise Professional Object Model
- Introduction to the Crystal Enterprise Professional Object Model
- Understanding the Crystal Enterprise Object Model
- Establishing a Crystal Enterprise Session
- Querying the Crystal Enterprise Repository
- Viewing Reports
- The Crystal Enterprise Java SDK
- Accessing the Java SDK
- Troubleshooting
Creating Enterprise Reports Applications with Crystal Enterprise Part I
- Creating Enterprise Reports Applications with Crystal Enterprise Part I
- Advanced Scenarios with the Crystal Enterprise Object Model
- Scheduling Reports
- Scheduling to a Destination
- Using Crystal Enterprise Notifications
- Scheduling to a Server Group
- Scheduling to a Specific Format
- Setting Database Credentials
- Troubleshooting
Creating Enterprise Reporting Applications with Crystal Enterprise Part II
- Creating Enterprise Reporting Applications with Crystal Enterprise Part II
- Querying the Crystal Enterprise InfoStore
- Creating and Responding to Crystal Enterprise Alerts
- Creating Schedulable Program Objects
- Troubleshooting
Appendix A. Using Sql Queries In Crystal Reports
Creating Enterprise Reporting Applications with Crystal Enterprise Part II
EAN: 2147483647
Pages: 341
