Custom Calculations and Advanced Data Analysis
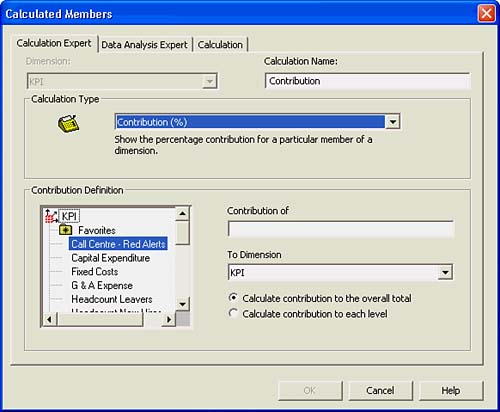
Additional Calculations and Data Analytics not provided in a report's underlying data source can be added to the data presented in the worksheet through the Calculations and Data Analysis menu, which you access by right-clicking on any member header. These are available at Design time and at End-User Delivery time if context menus have been enabled on the involved Worksheet object. A number of the most common calculations are provided in the Calculated Members dialog and include drag-and-drop parameter-based experts. Additional experts are provided under the Data Analysis tab on the same Calculated Members dialog. To add any of these default calculations or to create a completely new calculation, right-click on a member or a dimension name, and then choose the Calculated Member option. This opens the Calculated Members dialog shown in Figure 20.15.
Figure 20.15. The Calculated Members dialog provides the report designer and end user with the capability to create custom calculated members not available in the OLAP data source.
NOTE
Crystal Analysis automatically chooses a name for any of the predefined calculations. You can change this by typing the preferred name in the Calculation Name edit box.
The Calculation Experts
The Calculation Experts provided by Crystal Analysis on the Calculation Expert tab are
- Contribution: Calculates how much each member of a hierarchical dimension contributes to its parent. For example, how much does each week, period, and quarter contribute to total sales?
- Growth: Calculates how much a value has changed from one period to the next. For example, what is the percentage growth in sales week on week, period on period, and quarter on quarter?
- Ranking: Calculates the rank of each member in a dimension, usually based on a measure. For example, rank each product based on sales.
- Variance: Compares the value of one dimension member with a target value; the resulting variance can be expressed as an absolute value or a percentage variance.
Each of the Calculation Experts requires the specification of a different set of parameters in the Calculated Members dialog. These parameters can be set by either clicking and dragging the appropriate members to the involved parameter field or right-clicking on the chosen member and selecting the appropriate destination from the subsequent pop-up menu.
The Data Analysis Experts and Summaries
The Data Analysis Experts provided by Crystal Analysis under the Data Analysis Expert Tab are
- Trend Line: The Trend Line Expert calculates the straight line that best fits all members of the dimension specified in the Series Dimension list. This is done for the measure specified in the Trend Of box. The least squares method is used: minimizing the sum of the squares of the differences between the actual values specified and the regression line values.
- Moving Average: The Moving Average Expert calculates a centered moving average over all the members within each level of a specified dimension. This is done for the measure specified in the Moving Average parameter box.
- Linear Regression: The Linear Regression Expert calculates the straight line that best fits all the members within each level of the dimension. The members of this dimension form the columns of the Worksheet (assuming you are adding a calculated member as a row) where the X and Y values of the points are given by the members specified in the X Values box and Y Values box, respectively. The least squares method is used: minimizing the sum of the squares of the differences between the actual Y values specified and the regression line values. The regression line is evaluated at these same X values as specified by the member in the X Values box. Use the Linear Regression Expert when the data values you want to regress are not evenly spaced.
Each of the Data Analysis Experts requires you to specify a different set of parameters in the Calculated Members dialog. For a more thorough discussion on these calculations and how they are derived, please consult the Reference section of the Crystal Analysis User Manual provided in the docs directory of your install CD.
CAUTION
It is very important to understand the scope under which the Data Analysis Experts operate. When you select any of these experts, they operate across the entire set of members for the dimension that has been selected regardless of whether they are displayed on the current worksheet or viewpoint. Not taking this into account can lead to suspicious looking data when not all members are displayed. For scenarios where this assumed scope needs to be modified, the underlying MDX or Crystal OLAP Syntax created by the Data Analysis Expert can be modified under the Calculation tab of the Calculated Members dialog. This is introduced later in this chapter.
In addition to the predefined Data Analysis Experts, Crystal Analysis also provides analytic summaries such as Mean, Variance, Standard Deviation, and Best Fitting Curve. Access these summaries by right-clicking any member header and choosing Data Analysis. Figure 20.16 shows the Best Fitting Curve dialog and associated calculations.
Figure 20.16. You access supporting statistics in the Best Fitting Curve dialog box by choosing the Data Analysis menu option.
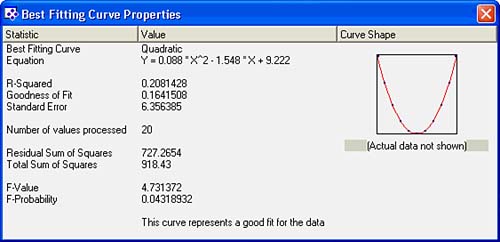
For detailed insights into the statistics behind the Data Analysis summaries, review the Algorithms.pdf document distributed on the product CD.
Custom Calculations with MDX or Crystal OLAP Syntax
In addition to all the experts introduced in the previous two sections, there are times when additional calculations are required to meet a designer or end user's need. The Calculations tab highlighted in Figure 20.17 enables you to create such calculationsor, as is often the case, modify existing calculations (for example, to change the scope of application for a Moving Average or Other Calculation).
Figure 20.17. This is the Calculations tab of Calculated Members dialog and the supporting Functions Library.
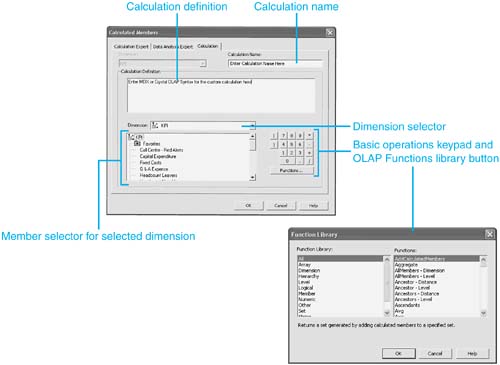
The Calculations Tab consists of the four major components, shown in Figure 20.17. These components facilitate the creation of Crystal OLAP or MDX statements that can be converted into meaningful fields usable by Crystal Analysis designers and end users:
- Calculation Definition: This is the actual MDX (if you're using SQL Server) or Crystal OLAP Syntax that is calculated by or through Crystal Analysis against the underlying data source.
- Dimension and Member Selectors: These components facilitate the selection of Dimensions and Dimension Members to be used in creating the custom calculation. When dimensions or members are selected through a double-click, the appropriate syntax for referencing them is transposed into the calculation definition for future editing. It is worth noting that the transposed text might not always reflect the exact user-friendly member syntax displayed in the Member Selector.
- OLAP Functions Library: Clicking on the Functions Library button provides a library of MDX or Crystal OLAP functions that might be used in the creation of the involved custom calculation. A few of the most common and useful functions are described in the next section.
- Basic Operations Keypad: A keypad providing and basic math operations and numerics for use in creating the calculation definition.
Once created, a resultant MDX or Crystal OLAP definition created through the Calculations tab appears as just another member in the involved Crystal Analysis report--which could even be used in future custom calculations.
Part I. Crystal Reports Design
Creating and Designing Basic Reports
- Creating and Designing Basic Reports
- Introducing the Crystal Reports Designer
- Understanding Data and Data Sources
- Introduction to the Data Explorer
- Adding Database Objects to Your Report
- Joining Database Objects Together
- Understanding the Different Join Types
- Using the Report Creation Wizards
- Understanding the Crystal Reports Gallery
- Using the Standard Report Creation Wizard
- Creating a Report Without Wizards
- Troubleshooting
Selecting and Grouping Data
- Selecting and Grouping Data
- Introduction
- Understanding Field Objects
- Working with Groups
- Understanding Drill-down Reports
- Troubleshooting
Filtering, Sorting, and Summarizing Data
- Filtering, Sorting, and Summarizing Data
- Introduction
- Filtering the Data in Your Report
- Learning to Sort Records
- Working with the Sort Expert
- Creating Effective Summaries
- Troubleshooting
Understanding and Implementing Formulas
- Understanding and Implementing Formulas
- Introduction
- Using the Formula Workshop
- Using the Workshop Formula Editor
- Creating Formulas with the Formula Expert
- Using the Formula Extractor to Create Custom Functions
- The Multi-Pass Reporting Process of the Crystal Reports Engine
- Troubleshooting
Implementing Parameters for Dynamic Reporting
- Implementing Parameters for Dynamic Reporting
- Introduction
- Understanding the Value of Parameters
- Creating and Implementing Parameters Fields
- Using Parameters with Record Selections
Part II. Formatting Crystal Reports
Fundamentals of Report Formatting
- Fundamentals of Report Formatting
- Introduction
- Positioning and Sizing Report Objects
- Modifying Object Properties for Formatting Purposes
- Exploring the Format Editor Dialog Common Options
- Combining and Layering Report Objects
- Configuring Report Page and Margin Properties
Working with Report Sections
- Working with Report Sections
- Introduction
- Formatting Report Sections
- Modifying Report Section Properties
- Using Multiple Report Sections
- Troubleshooting
Visualizing Your Data with Charts and Maps
- Visualizing Your Data with Charts and Maps
- Introduction to Charts and Maps
- Using the Chart Expert
- Using the Map Expert
- Modifying Chart and Map Properties
- Troubleshooting
Custom Formatting Techniques
- Introduction
- Making Presentation-Quality Reports
- Common Formatting Features
- Conditional Formatting Using Data to Drive the Look of a Report
Part III. Advanced Crystal Reports Design
Using Cross-Tabs for Summarized Reporting
- Using Cross-Tabs for Summarized Reporting
- Introduction to Cross-Tabs
- Benefits of Cross-Tabs
- Using the Cross-Tab Wizard
- Using Top N with Cross-Tabs Reports
- Using Advanced Cross-Tab Features
Using Record Selections and Alerts for Interactive Reporting
- Using Record Selections and Alerts for Interactive Reporting
- Creating Advanced Record Selection Formulas
- Adding Alerting to Your Reports
- Performance Monitoring and Tuning
Using Subreports and Multi-Pass Reporting
- Using Subreports and Multi-Pass Reporting
- Understanding Subreports
- Understanding Linked Versus Unlinked Subreports
- Considering Subreport Execution Time and Performance
- Using Variables to Pass Data Between Reports
- Emulating Nested Subreports
- Troubleshooting
Using Formulas and Custom Functions
- Using Formulas and Custom Functions
- Becoming More Productive with Formulas
- Choosing a Formula Language: Crystal Versus Basic Syntax
- Using Brackets in Formulas
- Using Characters in Formulas
- Recent Improvements to Formulas
Designing Effective Report Templates
- Designing Effective Report Templates
- Understanding the Importance of Reuse in Reporting
- Understanding Report Templates
- Using Report Templates
- Using Existing Crystal Reports as Templates
- Understanding How Templates Work
- Creating Useful Report Templates
- Using Template Field Objects
- Using Report Templates to Reduce Report Creation Effort
- Applying Multiple Templates
Additional Data Sources for Crystal Reports
- Additional Data Sources for Crystal Reports
- Understanding the Additional Crystal Reports Data Sources
- Connecting to COM-based Data Sources
- Connecting to Java-based Data Sources
- Understanding Solution Kits for Crystal Enterprise
- Troubleshooting
Multidimensional Reporting Against OLAP Data with Crystal Reports
- Multidimensional Reporting Against OLAP Data with Crystal Reports
- Introduction to OLAP
- OLAP Concepts and OLAP Reporting
- Recently Added or Changed OLAP Features in Crystal Reports
- Using the OLAP Report Creation Wizard and OLAP Expert
- Advanced OLAP Reporting
- Introduction to Crystal Analysis
Part IV. Enterprise Report Design Analytic, Web-based, and Excel Report Design
Introduction to Crystal Repository
- Introduction to Crystal Repository
- What Is the Crystal Repository?
- Why Implement the Crystal Repository?
- Installing the Crystal Repository
- Adding Objects to and from the Repository
- Migration of the Crystal Enterprise Repository
- Troubleshooting
Crystal Reports Semantic Layer Business Views
- Crystal Reports Semantic Layer Business Views
- Introduction to Business Views
- Why Implement Business Views?
- Performance and Implementation Considerations
- Business Views Architecture and Implementation
- Troubleshooting
Creating Crystal Analysis Reports
- Creating Crystal Analysis Reports
- Introduction
- Introducing Crystal Analysis
- Accessing OLAP Data with Crystal Analysis
- Designing Crystal Analysis Reports and Applications
- Adding Crystal Analysis Objects to a Report
- Troubleshooting
Advanced Crystal Analysis Report Design
- Advanced Crystal Analysis Report Design
- Introduction
- Advanced Crystal Analysis Designer Tools
- Custom Calculations and Advanced Data Analysis
- Setting Report Options
- Troubleshooting
- Crystal Analysis in the Real World MDX
Ad-Hoc Application and Excel Plug-in for Ad-Hoc and Analytic Reporting
- Ad-Hoc Application and Excel Plug-in for Ad-Hoc and Analytic Reporting
- Introducing Ad-Hoc Reporting Conceptually
- Introducing the Crystal Enterprise Ad-Hoc Reporting Application
- Crystal Reports Excel Plug-in
- Crystal Analysis Excel Plug-in
Part V. Web Report Distribution Using Crystal Enterprise
Introduction to Crystal Enterprise
- Introduction to Crystal Enterprise
- What Is Crystal Enterprise?
- Why Implement a Crystal Enterprise Solution?
- Versions of Crystal Enterprise
- Understanding the Core Functions of Crystal Enterprise
Using Crystal Enterprise with Web Desktop
- Using Crystal Enterprise with Web Desktop
- Introduction
- Crystal Enterprise User Launchpad
- Crystal Enterprise Web Desktop
- Customizing the Web Desktop and Report Viewers
- Publishing to the Web Desktop
- Customizing the Web Desktop
- Troubleshooting
Crystal Enterprise Architecture
- Crystal Enterprise Architecture
- Introduction
- Crystal Enterprise Architecture Overview
- The Client Tier
- The Application Tier
- The Server Tier: Introduction to the Crystal Enterprise Framework
- The Server Tier: Overview of the Crystal Enterprise Services
- The Data Tier
- The Crystal Enterprise Architecture in Action
- Taking Advantage of the Crystal Enterprise Distributed Architecture
- Extending Crystal Enterprise
Planning Considerations When Deploying Crystal Enterprise
- Planning Considerations When Deploying Crystal Enterprise
- Ensuring a Successful Crystal Enterprise Implementation
- Approaching the Project
- Identifying Business Pain
- Establishing Project Requirements
- Understanding Organizational Reporting Requirements
- Troubleshooting
Deploying Crystal Enterprise in a Complex Network Environment
- Deploying Crystal Enterprise in a Complex Network Environment
- Introduction
- Understanding Network Protocols
- Understanding Firewall Types
- Configuring the Crystal Enterprise Architecture for Your Network Environment
- Interaction Between the WCS and the WC
- Deploying Crystal Enterprise with an IP Packet Filtering Firewall
- Using Crystal Enterprise with NAT
- Exploring the NAT and Crystal Enterprise Relationship
- Crystal Enterprise and Proxy Servers
Administering and Configuring Crystal Enterprise
- Introduction
- Using the Crystal Management Console
- Managing Accounts
- Managing Content
- Introducing Servers
- Managing Crystal Enterprise System Settings
- Using the Crystal Configuration Manager
Part VI. Customized Report Distribution Using Crystal Reports Components
Java Reporting Components
- Java Reporting Components
- Overview of the Crystal Reports Java Reporting Component
- Understanding the Java Reporting Components Architecture
- Differences with the Java Reporting Engine
- Configuring the Application Server
- Delivering Reports in Web Applications
- Using the Crystal Tag Libraries
- Exporting Reports to Other File Formats
- Printing Reports from the Browser
- Common Programming Tasks
- Troubleshooting
Crystal Reports .NET Components
- Crystal Reports .NET Components
- Understanding Microsofts .NET Platform
- Understanding the Different Crystal .NET Components
- An Overview of the Crystal Reports 10 .NET Components
- The Report Designer
- The Report Engine Object Model
- Delivering Reports with the Windows Forms Viewer
- Delivering Reports with the Web Forms Viewer
- Database Credentials
- Setting Parameters
- Troubleshooting
COM Reporting Components
- COM Reporting Components
- Understanding the Report Designer Component
- Building Reports with the Visual Basic Report Designer
- Programming with the Report Engine Object Model
- Delivering Reports Using the Report Viewer
- Troubleshooting
Part VII. Customized Report Distribution Using Crystal Enterprise Embedded Edition
Introduction to Crystal Enterprise Embedded Edition
- Introduction to Crystal Enterprise Embedded Edition
- Introduction to Crystal Enterprise Embedded Edition
- Understanding Crystal Enterprise Embedded Edition
- Crystal Enterprise Embedded Edition Samples
- DHTML Report Design Wizard
- Troubleshooting
Crystal Enterprise Viewing Reports
- Crystal Enterprise Viewing Reports
- Viewing Reports over the Web
- Introduction to the Crystal Report Viewers
- Understanding the Report Source
- Implementing the Page Viewer
- Implementing the Part Viewer
- Implementing the Interactive Viewer
- Implementing the Grid Viewer
- Troubleshooting
Crystal Enterprise Embedded Report Modification and Creation
- Introduction
- Deploying RAS Environments
- Loading Report Files
- Locating RAS Components in a Network Architecture
- Installing the RAS SDK
- Best Practices in RAS Exception Handling
- The RAS SDK in Action
Part VIII. Customized Report Distribution Using Crystal Enterprise Professional
Introduction to the Crystal Enterprise Professional Object Model
- Introduction to the Crystal Enterprise Professional Object Model
- Understanding the Crystal Enterprise Object Model
- Establishing a Crystal Enterprise Session
- Querying the Crystal Enterprise Repository
- Viewing Reports
- The Crystal Enterprise Java SDK
- Accessing the Java SDK
- Troubleshooting
Creating Enterprise Reports Applications with Crystal Enterprise Part I
- Creating Enterprise Reports Applications with Crystal Enterprise Part I
- Advanced Scenarios with the Crystal Enterprise Object Model
- Scheduling Reports
- Scheduling to a Destination
- Using Crystal Enterprise Notifications
- Scheduling to a Server Group
- Scheduling to a Specific Format
- Setting Database Credentials
- Troubleshooting
Creating Enterprise Reporting Applications with Crystal Enterprise Part II
- Creating Enterprise Reporting Applications with Crystal Enterprise Part II
- Querying the Crystal Enterprise InfoStore
- Creating and Responding to Crystal Enterprise Alerts
- Creating Schedulable Program Objects
- Troubleshooting
Appendix A. Using Sql Queries In Crystal Reports
Creating Enterprise Reporting Applications with Crystal Enterprise Part II
EAN: 2147483647
Pages: 341
