Modifying Report Section Properties
In addition to formatting properties, each section has a variety of general properties that can be used to manipulate the behavior of that section within the overall report. For example, if you would like to suppress a particular section from the report display or just hide a detail-oriented section from the initial display but enable business users to navigate to the underlying details, you can use the Section Expert to accomplish this.
Using the report you created in the previous exercise, relocate the Count summary field into the Group Header and hide the Details section to enable the viewer of the report to access this section only if he double-clicks on the Group Header summary valuescommonly known as drilling-down on report data. The following steps guide you through formatting several fields and sections, creating a drill-down report:
- Highlight the Summary field currently located in the Group Footer #1 section (Count of Contact Last Name) and drag it up in the Group Header #1 section so that it is positioned to the right of the Country/Pays field, approximately under the Telephone # column title. The results are shown in Figure 7.3.
Figure 7.3. Report objects can be repositioned into the various report sections to change the presentation of the report.
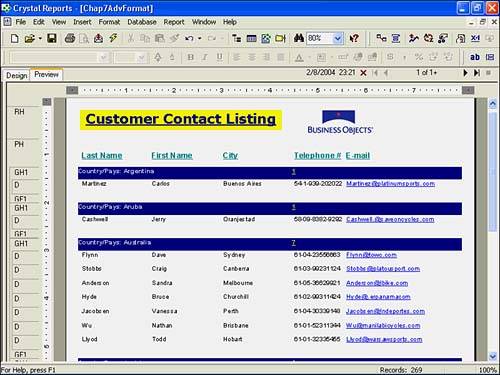
- While the Summary count field is still highlighted, modify the font properties so that it is underlined and in a bold yellow color.
- Using what you have learned from the previous exercises, remove the background color of the Group Footer #1 sectionthe background color property can be located on the Color tab of the Section Expert. Figure 7.3 shows what your report should now look like.
- To display the listing of customer contacts for each country on a separate and unique page, open the Section Expert and select Group Footer #1 from the section list on the left. As Figure 7.4 shows, the Common tab within the Section Expert provides access to a variety of properties unique to the section that you have selected from the list on the left. In this case, check the box next to the New Page After item and click OK to continue.
TIP
Common report section commandssuch as Hide, Suppress, Delete, Hide Section Names, and Select All Section Objectsare accessible via the pop-up menu when you right-click on the applicable section's name. Some of these commands are also available within the Section Expert dialog, although unlike the Section Expert, the right-click pop-up menu pertains only to the specific section you have selected.
- Looking at the preview of your report, you should now see each country's list of contacts on a separate page. Although this might be desirable for those countries with a considerable number of contacts, such as Canada, France, and the United States in this report, it is not necessarily the most visually pleasing presentation for the countries that have only one or two customer contacts.
Perhaps the majority of the business users for this report are more interested in the total number of contacts for each country rather than the actual list itself. However, a few of the business users also want to be able to access the contact list on occasion. To accommodate both groups of users, you can manipulate the properties of the Details section.
NOTE
To indicate to the business user of the report that more detailed information is available behind the summary group level, the mouse pointer turns into a magnifying glass icon when it floats over a drillable section (for example, the yellow count field of customer contacts, located in the Group Header #1 section).
- Disable the New Page After property that was set for the Group Footer #1 section. The Section Expert can be used to remove this setting. Click OK to continue.
- From either the Design or Preview view of your report, right-click on the Details section title to the far left of the application area and select Hide (Drill-Down OK) from the pop-up menu.
NOTE
Drill-down functionality is designed to make report viewing easier. You can hide the details of your report and only have the group headers and summaries visible, and, when necessary, the business users of the report can then click on the group header or summary fields to view the report details.
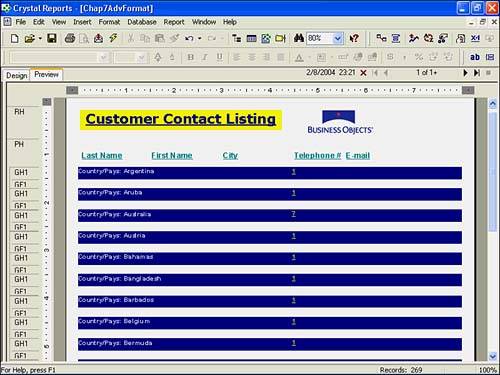
As shown in Figure 7.5, a list of each country with the total number of contacts displayed has now been created. Additionally, upon double-clicking the count of contacts (displayed with the underlined, yellow number) the business user of the report is quickly able to drill-down into the Details section and be presented with the actual customer contact specifications.
Figure 7.5. A manager now is presented with a summary list of customer contacts by country and is also able to access the customer contact details through a drill-down.
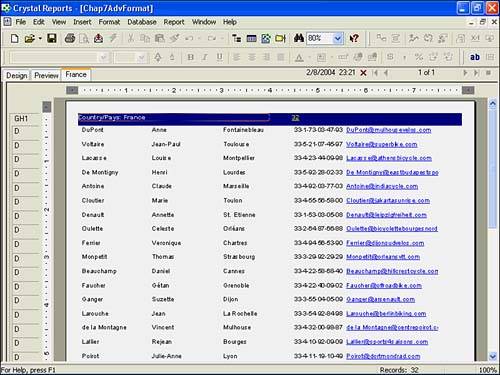
As you can see in Figure 7.6, after the business user drills down into a particular group's detail listing (France in this example), that group's detailed contact list is displayed in the Crystal Reports application in a separate tab and is cached so that it can be easily accessed for future reference. When a business user of the report selects a refresh on the report, all cached tabs are removed because there is no guarantee that the data being retrieved from the database would be the same as the previously cached page. The end user would have to drill back down into France if he wanted to view the detailed contact listing again.
Figure 7.6. The detailed list of customer contacts for France.
The Section Expert Settings and Functionality
As discussed to this point in the chapter, the Section Expert provides a great deal of powerful report formatting functionality and flexibility. There are two major areas to the Section Expert as shown in Figure 7.4the Sections area and the Formatting tabs (Common, Color, and Layout). This section presents each of these sections and their associated functionality.
The Sections Area
The Sections area is composed of a listing of all the current report's sections and five separate buttonsInsert, Delete, Merge and the up and down arrows. The Sections area takes up the entire left half of the Sections Expert dialog and enables you to create, delete, merge, and reorder entire sections within the involved report. The following list describes each of the Section Expert Sections area components:
- Sections: This box provides a list of all the sections in the current report. When a section is highlighted, the program highlights the other Section Expert properties and buttons that you can set, modify, or use for the selected section.
- Insert button: This button enables you to add sections below the currently highlighted section. The newly added section is based on the type that is currently selected. (For example, inserting a section while on the Detail section creates another Detail section called Detail b, the original Detail section is called Detail a, and they both exist under a parent node called Detail.) Different formatting and display properties are made available for each child section in addition to the parent section. Creating multiple detail (or other) sections dramatically increases the flexibility in which you can display information as each independent child section can have formatting and display properties applied (for example, Only Show Column Titles in Details a Section Every 10th Row).
- Delete button: Use this button to delete existing highlighted sections from the current report. Note that only inserted children sections (as described previously) can be deletednot original primary sections.
- Merge button: This button enables you to merge two related children sections (for example, Details a and Details b) into one new section.
- Up and Down Arrow buttons: These buttons enable you to reorder children sections within the currently selected report. It is important to note that the original parent sections cannot be reordered in the Section Expert.
The Common Tab
In addition to the Section Expert options that you have already used, the following segment of the chapter provides an overview of the available settings presented on the Common tab of the Section Expert. A subset or all of these options are made available when a section is selected in the Sections area, as described previously. The following options are made available in the Common tab:
- Free-Form Placement: When enabled, this option places objects within a section in a free-form manner, ignoring all program alignment grids and guidelines. When this option is not selected, objects are placed at fixed points using an underlying grid (see the Layout tab of the Options menu for more details on grid display). This option is generally used in combination with report graphics (such as boxes) whose default display mechanism is free-form.
- Hide (Drill-Down OK): This option hides the respective section from the report's initial visual display, but still enables report users to access the section's content upon end-user drill-down.
- Suppress (No Drill-Down): Hides the respective section from the report's visual display and disables any drill-down capabilities such that the section's content is not available to report users. This is very useful for eliminating the display of sections that contain no data (such as redundant or empty Group Footer sections).
- Print at Bottom of Page: Causes the current section to print at the bottom of the page. This setting is most useful for printing invoices and other reports where you want summary values to appear toward the bottom of the page in a fixed position.
- New Page Before: Inserts a page break before it prints the section. This option is only applicable to the Group Header, Group Footer, and Details sections.
- New Page After: Inserts a page break after it displays and prints the section. For example, you can use this setting in the Group Footer section to print each group on a separate page.
- Reset Page Number After: Resets the page number to one (1) for the following page after it prints a group total. When this option is used in conjunction with Print at Bottom of Page, a single group prints on a page, the group value is printed at the bottom of the page, and the page number is reset to 1 for the next page. This option is useful whenever you are printing multiple reports from a single file (such as customer invoices), and you want each report to be numbered beginning with Page 1.
- Keep Together: Keeps a particular section together on one page without splitting the section between multiple pages. For example, in a customer list, data on a single customer might extend over several lines. If the standard page break falls within the data for a customer, the data is splitpart on one page and the remainder on the next. You can use the Keep Together setting to insert the page break before the record begins so that all the data is printed together on the following page.
- Suppress Blank Section: Hides the report section if it is blank, and only prints it if it is not blank. This is a powerful display control to eliminate unnecessary blank space in reports.
- Underlay Following Sections: Permits the selected section to underlay the following section(s) when it prints, making the current section transparent. This feature is often used for the printing of Watermarks on a report (such as "Internal Use Only," "Draft," or a company logo). It is also often used to display data in different sections beside each other (for example, a summary pie chart from the Report Header underplayed to show beside the actual details of the pie chart kept in the Group and Detail sections).
- Format with Multiple Columns: Only available on the Detail section, this option presents the Layout tab (otherwise hidden from view) within the Section Expert and enables you to use multiple columns in the given report. This powerful feature enables the presentation of row data in the detail section as columns in a report. It is particularly useful when presenting summarized information for comparison or a lengthy list. This is demonstrated later in this chapter.
- Reserve Minimum Page Footer (Page Footer section only): Reserves space at the bottom of each page for your Page Footer sections (a default setting). This enables you to minimize the space reserved for your Page Footer sections, thus maximizing the space available for other report information on each page. This option only affects a Page Footer area with multiple sections.
- Read-only: Locks the formatting and position of all report objects within the section so that they can't be formatted or repositioned. The Read-only setting uses password protection to enable the report designer to return to the report to make future changes.
- Relative Positions: Locks the relative position of a report object next to a grid object within a section. For example, if you place a text object one inch to the right of a cross-tab or OLAP grid object, during report generation the program pushes the text object to the right so that the one inch of space is maintained regardless of the width of the cross-tab or OLAP grid object.
The presence of the x+2 buttons to the right of the majority of the options indicates that those options can be set via a formula in addition to setting them via the dialog. When an option is set via formula, this is referred to as conditional formatting because the formula typically evaluates a condition.
To implement a conditional option, click on the x+2 button associated with the option and the Formula Editor is presented. Within the Formula Editor, a formula needs to be created that is evaluated for every iteration of the section. If the formula evaluates to a value of True, the involved option is applied; otherwise, it is not. A simple but practical example of conditional section formatting could be a marketing campaign list where the marketing department wants to contact customers in the USA by phone and everywhere else by mail. Two detail sections could be created, one that includes Contact Name and Phone Number, the other with Contact Name and Mailing address. The first section can be conditionally suppressed on the following formula{Customer.Country} <> "USA" to only show that section for USA-based customers. The second details section would be conditionally suppressed with {Customer.Country} = "USA" to only show non-U.S.-based customers.
The Color Tab
Use the Color tab to set the background color for the entire highlighted section. This can be done absolutely or conditionally. A good example of a conditionally colored background is when presenting a lengthy list of detailed items. To enable easier reading of the report, every second row can be conditionally colored Silver with the following formula:
Listing 7.1. Alternate Row Coloring Formula
IF RecordNumber Mod 2 = 1 THEN

 Silver

Else

 White
The Layout Tab
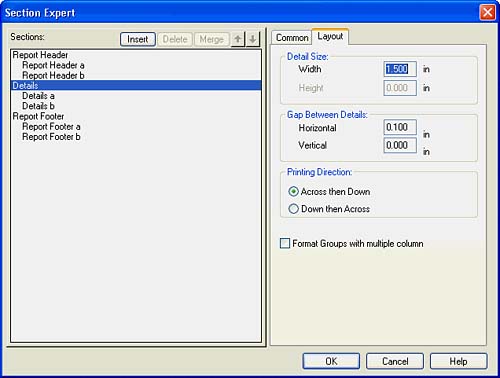
The Layout tab only appears when you have the details section selected and the Format with Multiple Columns check box has been selected on the Common tab. This tab enables multi-column formatting. As described earlier, this kind of report enables you to present multiple columns of standard row data and have the data flow from column to column. This tab, shown in Figure 7.7, has four distinct settings:
- Detail Size: This box enables the specification of the dimensions (height and width) of each detail column.
- Gap Between Details: This box enables the specification of the empty area between detail columns and rows. The horizontal gap is the distance between the details going across the page and the vertical gap is the distance between rows going down the page.
- Printing Direction: This option enables the specification of the flow path to be followed when printing the detail column and rows on a report page. The Across then Down option prints details across the columns in one row first before moving onto the next row of data. The Down then Across option prints details down an entire column first before moving onto the next column.
- Format Groups with Multiple Column: This option formats groups with multiple columns using the Width, Gap Between Details, and Printing Directions specified for the selected Detail section.
Figure 7.7. The Layout tab is only available for advanced multicolumn reports.
TIP
When you format a report to show multiple columns, the Crystal Reports engine reviews the fields in the detail section and sizes the columns in the rest of the report based on the width of those fields. As such, if data labels (text fields) are placed in the detail section for row identification, these increase the width of the report's columns and reduce the number of columns that fit onto a page. To place such fields, consider placing them in a Page or Group header and underlaying them onto the Details section. This is presented in a sample format later in the chapter.
Part I. Crystal Reports Design
Creating and Designing Basic Reports
- Creating and Designing Basic Reports
- Introducing the Crystal Reports Designer
- Understanding Data and Data Sources
- Introduction to the Data Explorer
- Adding Database Objects to Your Report
- Joining Database Objects Together
- Understanding the Different Join Types
- Using the Report Creation Wizards
- Understanding the Crystal Reports Gallery
- Using the Standard Report Creation Wizard
- Creating a Report Without Wizards
- Troubleshooting
Selecting and Grouping Data
- Selecting and Grouping Data
- Introduction
- Understanding Field Objects
- Working with Groups
- Understanding Drill-down Reports
- Troubleshooting
Filtering, Sorting, and Summarizing Data
- Filtering, Sorting, and Summarizing Data
- Introduction
- Filtering the Data in Your Report
- Learning to Sort Records
- Working with the Sort Expert
- Creating Effective Summaries
- Troubleshooting
Understanding and Implementing Formulas
- Understanding and Implementing Formulas
- Introduction
- Using the Formula Workshop
- Using the Workshop Formula Editor
- Creating Formulas with the Formula Expert
- Using the Formula Extractor to Create Custom Functions
- The Multi-Pass Reporting Process of the Crystal Reports Engine
- Troubleshooting
Implementing Parameters for Dynamic Reporting
- Implementing Parameters for Dynamic Reporting
- Introduction
- Understanding the Value of Parameters
- Creating and Implementing Parameters Fields
- Using Parameters with Record Selections
Part II. Formatting Crystal Reports
Fundamentals of Report Formatting
- Fundamentals of Report Formatting
- Introduction
- Positioning and Sizing Report Objects
- Modifying Object Properties for Formatting Purposes
- Exploring the Format Editor Dialog Common Options
- Combining and Layering Report Objects
- Configuring Report Page and Margin Properties
Working with Report Sections
- Working with Report Sections
- Introduction
- Formatting Report Sections
- Modifying Report Section Properties
- Using Multiple Report Sections
- Troubleshooting
Visualizing Your Data with Charts and Maps
- Visualizing Your Data with Charts and Maps
- Introduction to Charts and Maps
- Using the Chart Expert
- Using the Map Expert
- Modifying Chart and Map Properties
- Troubleshooting
Custom Formatting Techniques
- Introduction
- Making Presentation-Quality Reports
- Common Formatting Features
- Conditional Formatting Using Data to Drive the Look of a Report
Part III. Advanced Crystal Reports Design
Using Cross-Tabs for Summarized Reporting
- Using Cross-Tabs for Summarized Reporting
- Introduction to Cross-Tabs
- Benefits of Cross-Tabs
- Using the Cross-Tab Wizard
- Using Top N with Cross-Tabs Reports
- Using Advanced Cross-Tab Features
Using Record Selections and Alerts for Interactive Reporting
- Using Record Selections and Alerts for Interactive Reporting
- Creating Advanced Record Selection Formulas
- Adding Alerting to Your Reports
- Performance Monitoring and Tuning
Using Subreports and Multi-Pass Reporting
- Using Subreports and Multi-Pass Reporting
- Understanding Subreports
- Understanding Linked Versus Unlinked Subreports
- Considering Subreport Execution Time and Performance
- Using Variables to Pass Data Between Reports
- Emulating Nested Subreports
- Troubleshooting
Using Formulas and Custom Functions
- Using Formulas and Custom Functions
- Becoming More Productive with Formulas
- Choosing a Formula Language: Crystal Versus Basic Syntax
- Using Brackets in Formulas
- Using Characters in Formulas
- Recent Improvements to Formulas
Designing Effective Report Templates
- Designing Effective Report Templates
- Understanding the Importance of Reuse in Reporting
- Understanding Report Templates
- Using Report Templates
- Using Existing Crystal Reports as Templates
- Understanding How Templates Work
- Creating Useful Report Templates
- Using Template Field Objects
- Using Report Templates to Reduce Report Creation Effort
- Applying Multiple Templates
Additional Data Sources for Crystal Reports
- Additional Data Sources for Crystal Reports
- Understanding the Additional Crystal Reports Data Sources
- Connecting to COM-based Data Sources
- Connecting to Java-based Data Sources
- Understanding Solution Kits for Crystal Enterprise
- Troubleshooting
Multidimensional Reporting Against OLAP Data with Crystal Reports
- Multidimensional Reporting Against OLAP Data with Crystal Reports
- Introduction to OLAP
- OLAP Concepts and OLAP Reporting
- Recently Added or Changed OLAP Features in Crystal Reports
- Using the OLAP Report Creation Wizard and OLAP Expert
- Advanced OLAP Reporting
- Introduction to Crystal Analysis
Part IV. Enterprise Report Design Analytic, Web-based, and Excel Report Design
Introduction to Crystal Repository
- Introduction to Crystal Repository
- What Is the Crystal Repository?
- Why Implement the Crystal Repository?
- Installing the Crystal Repository
- Adding Objects to and from the Repository
- Migration of the Crystal Enterprise Repository
- Troubleshooting
Crystal Reports Semantic Layer Business Views
- Crystal Reports Semantic Layer Business Views
- Introduction to Business Views
- Why Implement Business Views?
- Performance and Implementation Considerations
- Business Views Architecture and Implementation
- Troubleshooting
Creating Crystal Analysis Reports
- Creating Crystal Analysis Reports
- Introduction
- Introducing Crystal Analysis
- Accessing OLAP Data with Crystal Analysis
- Designing Crystal Analysis Reports and Applications
- Adding Crystal Analysis Objects to a Report
- Troubleshooting
Advanced Crystal Analysis Report Design
- Advanced Crystal Analysis Report Design
- Introduction
- Advanced Crystal Analysis Designer Tools
- Custom Calculations and Advanced Data Analysis
- Setting Report Options
- Troubleshooting
- Crystal Analysis in the Real World MDX
Ad-Hoc Application and Excel Plug-in for Ad-Hoc and Analytic Reporting
- Ad-Hoc Application and Excel Plug-in for Ad-Hoc and Analytic Reporting
- Introducing Ad-Hoc Reporting Conceptually
- Introducing the Crystal Enterprise Ad-Hoc Reporting Application
- Crystal Reports Excel Plug-in
- Crystal Analysis Excel Plug-in
Part V. Web Report Distribution Using Crystal Enterprise
Introduction to Crystal Enterprise
- Introduction to Crystal Enterprise
- What Is Crystal Enterprise?
- Why Implement a Crystal Enterprise Solution?
- Versions of Crystal Enterprise
- Understanding the Core Functions of Crystal Enterprise
Using Crystal Enterprise with Web Desktop
- Using Crystal Enterprise with Web Desktop
- Introduction
- Crystal Enterprise User Launchpad
- Crystal Enterprise Web Desktop
- Customizing the Web Desktop and Report Viewers
- Publishing to the Web Desktop
- Customizing the Web Desktop
- Troubleshooting
Crystal Enterprise Architecture
- Crystal Enterprise Architecture
- Introduction
- Crystal Enterprise Architecture Overview
- The Client Tier
- The Application Tier
- The Server Tier: Introduction to the Crystal Enterprise Framework
- The Server Tier: Overview of the Crystal Enterprise Services
- The Data Tier
- The Crystal Enterprise Architecture in Action
- Taking Advantage of the Crystal Enterprise Distributed Architecture
- Extending Crystal Enterprise
Planning Considerations When Deploying Crystal Enterprise
- Planning Considerations When Deploying Crystal Enterprise
- Ensuring a Successful Crystal Enterprise Implementation
- Approaching the Project
- Identifying Business Pain
- Establishing Project Requirements
- Understanding Organizational Reporting Requirements
- Troubleshooting
Deploying Crystal Enterprise in a Complex Network Environment
- Deploying Crystal Enterprise in a Complex Network Environment
- Introduction
- Understanding Network Protocols
- Understanding Firewall Types
- Configuring the Crystal Enterprise Architecture for Your Network Environment
- Interaction Between the WCS and the WC
- Deploying Crystal Enterprise with an IP Packet Filtering Firewall
- Using Crystal Enterprise with NAT
- Exploring the NAT and Crystal Enterprise Relationship
- Crystal Enterprise and Proxy Servers
Administering and Configuring Crystal Enterprise
- Introduction
- Using the Crystal Management Console
- Managing Accounts
- Managing Content
- Introducing Servers
- Managing Crystal Enterprise System Settings
- Using the Crystal Configuration Manager
Part VI. Customized Report Distribution Using Crystal Reports Components
Java Reporting Components
- Java Reporting Components
- Overview of the Crystal Reports Java Reporting Component
- Understanding the Java Reporting Components Architecture
- Differences with the Java Reporting Engine
- Configuring the Application Server
- Delivering Reports in Web Applications
- Using the Crystal Tag Libraries
- Exporting Reports to Other File Formats
- Printing Reports from the Browser
- Common Programming Tasks
- Troubleshooting
Crystal Reports .NET Components
- Crystal Reports .NET Components
- Understanding Microsofts .NET Platform
- Understanding the Different Crystal .NET Components
- An Overview of the Crystal Reports 10 .NET Components
- The Report Designer
- The Report Engine Object Model
- Delivering Reports with the Windows Forms Viewer
- Delivering Reports with the Web Forms Viewer
- Database Credentials
- Setting Parameters
- Troubleshooting
COM Reporting Components
- COM Reporting Components
- Understanding the Report Designer Component
- Building Reports with the Visual Basic Report Designer
- Programming with the Report Engine Object Model
- Delivering Reports Using the Report Viewer
- Troubleshooting
Part VII. Customized Report Distribution Using Crystal Enterprise Embedded Edition
Introduction to Crystal Enterprise Embedded Edition
- Introduction to Crystal Enterprise Embedded Edition
- Introduction to Crystal Enterprise Embedded Edition
- Understanding Crystal Enterprise Embedded Edition
- Crystal Enterprise Embedded Edition Samples
- DHTML Report Design Wizard
- Troubleshooting
Crystal Enterprise Viewing Reports
- Crystal Enterprise Viewing Reports
- Viewing Reports over the Web
- Introduction to the Crystal Report Viewers
- Understanding the Report Source
- Implementing the Page Viewer
- Implementing the Part Viewer
- Implementing the Interactive Viewer
- Implementing the Grid Viewer
- Troubleshooting
Crystal Enterprise Embedded Report Modification and Creation
- Introduction
- Deploying RAS Environments
- Loading Report Files
- Locating RAS Components in a Network Architecture
- Installing the RAS SDK
- Best Practices in RAS Exception Handling
- The RAS SDK in Action
Part VIII. Customized Report Distribution Using Crystal Enterprise Professional
Introduction to the Crystal Enterprise Professional Object Model
- Introduction to the Crystal Enterprise Professional Object Model
- Understanding the Crystal Enterprise Object Model
- Establishing a Crystal Enterprise Session
- Querying the Crystal Enterprise Repository
- Viewing Reports
- The Crystal Enterprise Java SDK
- Accessing the Java SDK
- Troubleshooting
Creating Enterprise Reports Applications with Crystal Enterprise Part I
- Creating Enterprise Reports Applications with Crystal Enterprise Part I
- Advanced Scenarios with the Crystal Enterprise Object Model
- Scheduling Reports
- Scheduling to a Destination
- Using Crystal Enterprise Notifications
- Scheduling to a Server Group
- Scheduling to a Specific Format
- Setting Database Credentials
- Troubleshooting
Creating Enterprise Reporting Applications with Crystal Enterprise Part II
- Creating Enterprise Reporting Applications with Crystal Enterprise Part II
- Querying the Crystal Enterprise InfoStore
- Creating and Responding to Crystal Enterprise Alerts
- Creating Schedulable Program Objects
- Troubleshooting
Appendix A. Using Sql Queries In Crystal Reports
Creating Enterprise Reporting Applications with Crystal Enterprise Part II
EAN: 2147483647
Pages: 341
