Using the Standard Report Creation Wizard
The Standard Report Creation Wizard is the most frequently used design assistant in Crystal Reports. It provides multiple dialogs common to creating reports that are based on conventional corporate data sources. The Standard Report Creation Wizard guides you through selecting a data source, linking data source tables, adding data source fields to the report, specifying field groupings, identifying summary (total) fields, and setting the desired sort criteria for your report.
Additionally, the Standard Report Creation Wizard walks you through creating chart objects, applying record selection criteria (data filters), and applying predefined templates (layouts) to your report.
NOTE
The term filter is commonly used to describe data selection criteria that narrow the scope of the data being extracted by the report from the underlying data source. For example, by using a filter such as Country = USA, you can easily limit your report to include only the information you are interested in extracting.
The Standard Report Creation Wizard consists of nine dialog screens that enable you to specify the criteria mentioned previously to create a professional-looking report quickly. The sequence of the wizard's dialog screens is dynamic and directly associated with the items selected in each of the progressive screens. For example, if you do not choose to identify any summary items for your report, you will not be presented with a Chart dialog screen. In general, charts apply best to summarized data, so if you have not identified any summary fields, the wizard assumes that you do not want to include a chart object in your report.
NOTE
Charts can also be created from base-level data, although to do this you must appropriately specify the On Change Of option and use the Advanced settings with the Chart Expert. Generally, it makes more sense to base chart objects on summary-level data, such as regional sales by quarterwhere you are charting the total sales for each quarter rather than each sales transaction in each quarter.
The following exercise steps through the wizard and builds a sales report to display last year's sales by country. By making use of the Standard Report Creation Wizard, you include the country, city, customer name, and last year sales database fields, graphically display a summary of last year sales by country, and apply professionally styled formatting to the report. To create the sales report, follow these steps:
- From the Report Gallery dialog, select Using the Report Wizard in the upper portion of the screen, and then select Standard from the wizard list in the lower portion of the screen. Click OK to initiate the Standard Report Creation Wizard.
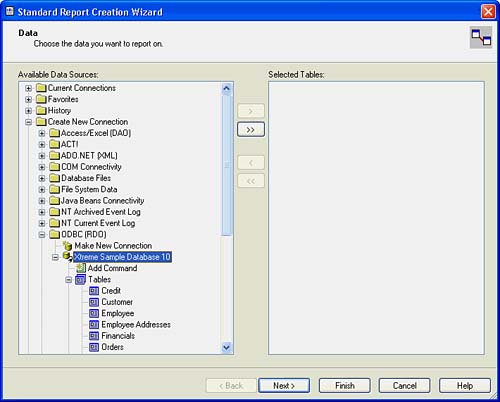
- As shown in Figure 1.13, you should now be presented with the first dialoglabeled Dataas part of the Standard Report Creation Wizard. From the Data dialog screen, expand the Create New Connection node and then expand the ODBC listing as well. This should present the ODBC Data Source Selection dialog.
Figure 1.13. The Standard Report Creation Wizard begins by requesting a data source for your report.
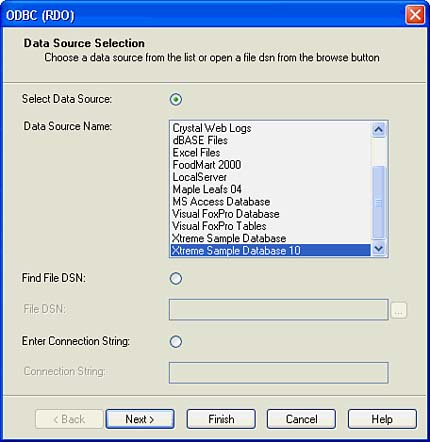
- From the ODBC Data Source Selection dialog, scroll to the end of the Data Source Name list and select Xtreme Sample Database 10, as shown in Figure 1.14. Click Next to continue.
Figure 1.14. The ODBC Data Source Selection dialog enables you to select a valid connection to access your ODBC data sources.
- Verify that the Data Source Name is correct and click Finish from the ODBC Connection Information dialog. No password is necessary to access this database.
- After you have successfully identified and connected to Xtreme Sample Database 10, you should see this item listed under the ODBC node in the Available Data Sources area of the Data dialog screen, as shown in Figure 1.15. Upon expanding the Xtreme Sample Database 10 item, you should see three or four distinct data source items listed: Tables, Views, and Stored Proceduresand possibly System Tables dependent on your options settings (shown in Figure 1.16).
Figure 1.15. The Xtreme Sample Database is listed under the Available Data Sources area of the Data dialog.
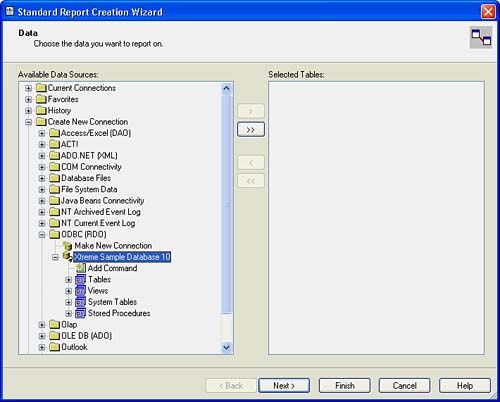
Figure 1.16. Upon expanding the Xtreme Sample Database 10 item, you will notice multiple database items listed.
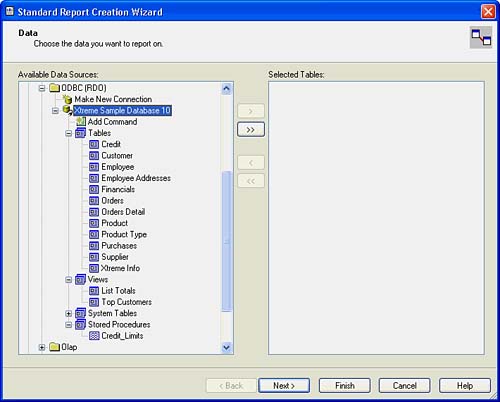
- Within the Data dialog screen, select the Customer and Orders tables so that they are listed in the Selected Tables area on the right. After these two tables are selected, click Next to continue onto the Linking Dialog.
TIP
There are multiple ways to include tables in your report from within the Data dialog screen. From the list of available tables on the left side of the dialog, you can perform any one of the following actions to populate the Selected Tables list on the right side of the dialog area:
- Double-click on each desired table item
- Drag-and-drop each desired table item
- Highlight the table item on the left and click on the respective arrow icons (> or >>) between the two listing areas to populate the listing on the right
- Double-click on each desired table item
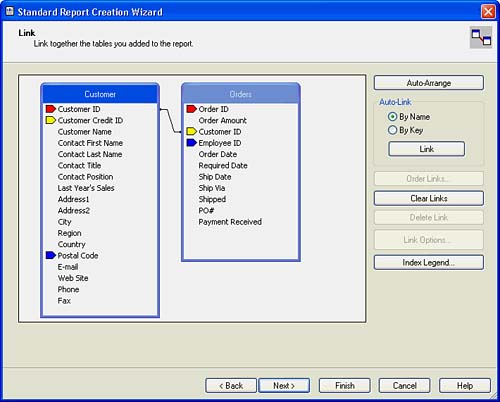
- The Link dialog screen presents a visual representation of the relationship between these two tables and permits you to modify the defined relationship by specifying the exact Join links that you require to accurately report on the data within the selected tables. As shown in Figure 1.17, you should now see the Link dialog screen. For our purposes here, accept the default Join condition. Click Next to continue.
Figure 1.17. The Customer and Orders tables are linked together via the Customer ID field.
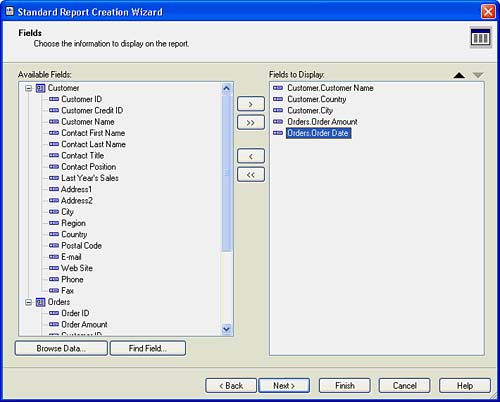
- After specifying the table linking, you will see the Fields dialog screen, shown in Figure 1.18. Select the Customer Name, Country, and City fields from the Customer table and the Order Amount and Order Date fields from the Order table so that they appear under the Fields to Display area on the right. If necessary, you can use the up and down arrows to modify the order of these fields in the list. Click Next to continue.
Figure 1.18. The Customer Name, City, Country, Order Amount, and Order Date fields should appear under the Fields to Display area.
NOTE
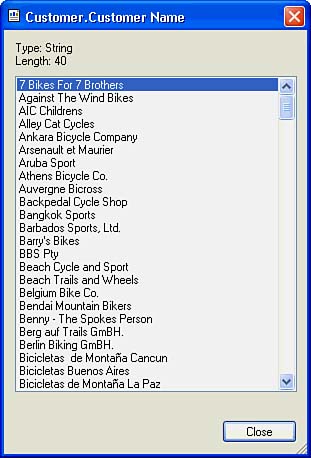
If you're not sure of the data contained in any of the respective field items on the left, you can highlight a field name and click the Browse Data button to view a list of values from this field, as shown in Figure 1.19. This can be particularly useful if you are unfamiliar with the database and need to locate a field based on the values it contains, such as account numbers, policy codes, or employee names.
Figure 1.19. The Browse Data button enables you to view a list of values from any of the available database field items.
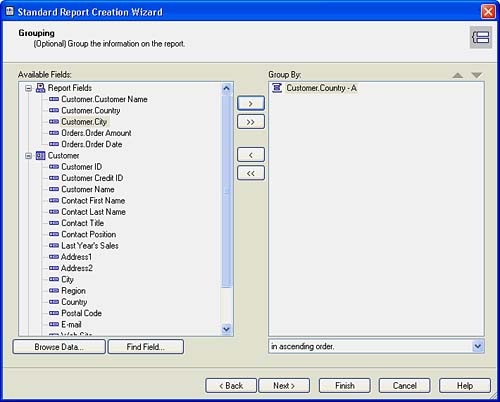
- You should now see the Grouping dialog screen. This dialog enables you to specify logical groups of information within your reports. For this example, select to group by the Country field only, as shown in Figure 1.20. Click Next to continue.
Figure 1.20. The Grouping dialog enables you to create structured groupings of information within your report.
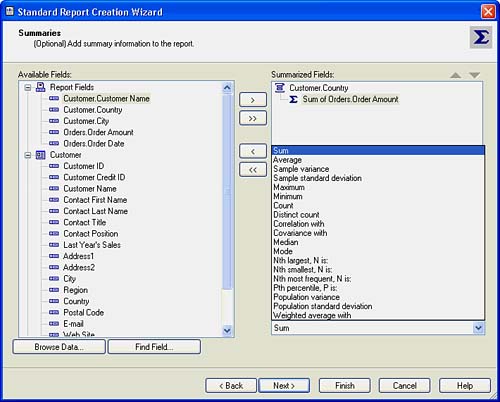
- You should now see the Summaries dialog screen. The Summaries dialog screen enables you to identify summary values (such as Sums, Counts, and so on) for your reports. If you have not identified any grouped items in a report, the Summaries dialog does not appear because summaries are only applicable to grouped data. To apply a summary object to the report, select the Order Amount field so that it appears under the Summarized Fields list on the right. This is shown in Figure 1.21. Click Next to continue.
Figure 1.21. The Summaries dialog screen enables you to create summarized values that are frequently used in coordination with the grouping structure within reports.
NOTE
As you might notice, Crystal Reports automatically chooses a summary for you if you choose to group your report data. It examines the detail information you've specified for the report and builds a summary on the first available numeric field. However, this default summary criteria is easily modified in the wizard.
NOTE
By default, the Order Amount field that appears under the Summarized Fields area on the right is aggregated as a Sum of the actual field value. As shown in Figure 1.21, the drop-down list located in the lower-right area of the Summaries dialog screen enables you to select from a variety of summaries, including Sum, Average, Maximum, Minimum, Count, Correlation, Covariance, and Standard Deviation.
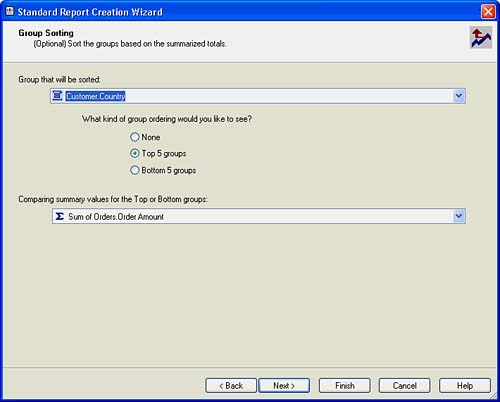
- Now sort the report based on the total order amounts of the top five countries. The Group Sorting dialog screen enables you to sort the grouped fields based on the summarized totals. From the Group drop-down list, select the Country field (the only option in the example here) and select the Top 5 Groups option from the Group Ordering choices. Also, select the Sum of Order Amount item from the Comparing Summarized Values drop-down list, as shown in Figure 1.22. Click Next to continue.
Figure 1.22. The Group Sorting dialog enables you to sort your report based solely on the Group values that you want to include in the report results.
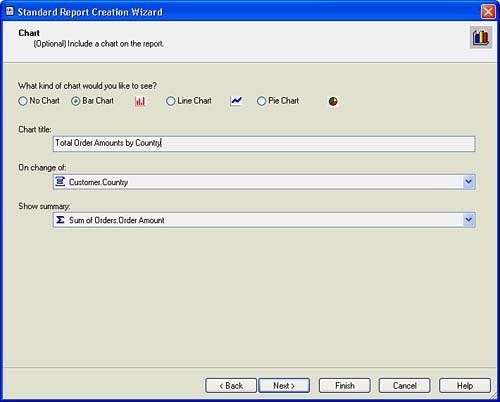
- Charting can be added through the wizard to visually display the data already selected. From the Chart dialog screen, you can select a chart object to be included in the report based on the group and summary items you identify here. For this example, add a bar chart and select the Country field from the On Change Of drop-down list and the Sum of Order Amounts item from the Show Summary drop-down list. Change the chart title to read Total Order Amounts by Countrysee Figure 1.23 for additional guidance. Click Next to continue.
Figure 1.23. The Chart dialog enables you to select a chart object for a report based on the previously identified group and summary criteria.
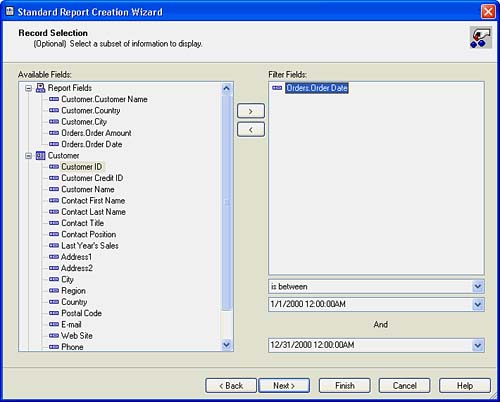
- Now you'll address the fictitious requirement that you are only interested in customer orders from the year 2000. The Record Selection dialog screen enables you to identify selection criteria, often called data filtering, to focus the resultset of the report to include only the information you are interested in returning. To accomplish this, select Order Date as the Filter Field, choose Is Between from the filter operator drop-down list, and select a data range from the newly created date-range drop-down boxes to incorporate all the dates in 2000 (see Figure 1.24). Click Next to continue.
Figure 1.24. The Record Selection dialog permits you to narrow your resultset based on the selection criteria identified here.
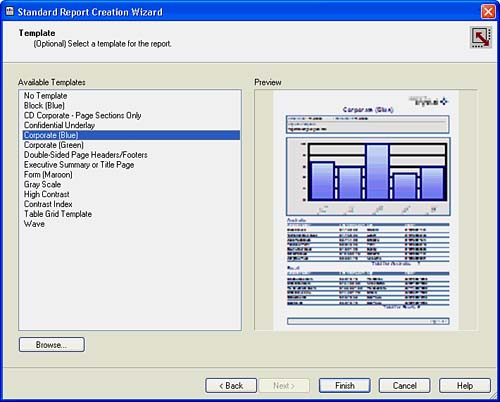
- Finally, apply a predefined style to your report. From the Template dialog screen, you can select predefined styles to be applied to your report for formatting purposes, as shown in Figure 1.25. The Available Template list includes various sample templates that are included with the Crystal Reports 10 installation. However, you can also create your own templates to be used for report formatting. For this example, select the Corporate (Blue) template. For additional details on how to design and implement your own templates, see Chapter 14, "Designing Effective Report Templates."
Figure 1.25. The Template dialog permits you to select predefined styles to be applied to your report.
This now concludes the Standard Report Creation Wizard example. After you click Finish, you will execute the report that you have just created and will be presented with the preview of the corresponding resultset. At this point, you can click Finish if you are satisfied with the report design criteria. When you are presented with the preview of your report, save your new report by selecting Save As from the File menu. Name this report Chap1Wizard.rpt or anything you would like.
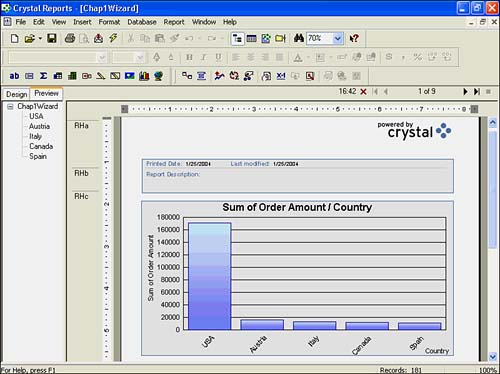
After you select Finish at the end of the Standard Report Creation Wizard process, you will be presented with the executed resultset and a preview of your newly created report. As Figure 1.26 shows, creating a useful and professional looking report is extremely simple when using the Standard Report Creation Wizard. In the preceding exercises, you have connected to a database, identified the tables and fields you wanted to include in your report, linked the tables together, grouped and summarized the data, sorted the data, applied filtering criteria, included a chart object for enhanced visualization of the report results, and applied a report template for quick and easy formattingall in just a few clicks of your mouse! This process speaks both to the ease of use and power of the Crystal Reports design application.
Figure 1.26. The executed resultset and preview of the report you have just created using the Standard Report Creation Wizard.
Part I. Crystal Reports Design
Creating and Designing Basic Reports
- Creating and Designing Basic Reports
- Introducing the Crystal Reports Designer
- Understanding Data and Data Sources
- Introduction to the Data Explorer
- Adding Database Objects to Your Report
- Joining Database Objects Together
- Understanding the Different Join Types
- Using the Report Creation Wizards
- Understanding the Crystal Reports Gallery
- Using the Standard Report Creation Wizard
- Creating a Report Without Wizards
- Troubleshooting
Selecting and Grouping Data
- Selecting and Grouping Data
- Introduction
- Understanding Field Objects
- Working with Groups
- Understanding Drill-down Reports
- Troubleshooting
Filtering, Sorting, and Summarizing Data
- Filtering, Sorting, and Summarizing Data
- Introduction
- Filtering the Data in Your Report
- Learning to Sort Records
- Working with the Sort Expert
- Creating Effective Summaries
- Troubleshooting
Understanding and Implementing Formulas
- Understanding and Implementing Formulas
- Introduction
- Using the Formula Workshop
- Using the Workshop Formula Editor
- Creating Formulas with the Formula Expert
- Using the Formula Extractor to Create Custom Functions
- The Multi-Pass Reporting Process of the Crystal Reports Engine
- Troubleshooting
Implementing Parameters for Dynamic Reporting
- Implementing Parameters for Dynamic Reporting
- Introduction
- Understanding the Value of Parameters
- Creating and Implementing Parameters Fields
- Using Parameters with Record Selections
Part II. Formatting Crystal Reports
Fundamentals of Report Formatting
- Fundamentals of Report Formatting
- Introduction
- Positioning and Sizing Report Objects
- Modifying Object Properties for Formatting Purposes
- Exploring the Format Editor Dialog Common Options
- Combining and Layering Report Objects
- Configuring Report Page and Margin Properties
Working with Report Sections
- Working with Report Sections
- Introduction
- Formatting Report Sections
- Modifying Report Section Properties
- Using Multiple Report Sections
- Troubleshooting
Visualizing Your Data with Charts and Maps
- Visualizing Your Data with Charts and Maps
- Introduction to Charts and Maps
- Using the Chart Expert
- Using the Map Expert
- Modifying Chart and Map Properties
- Troubleshooting
Custom Formatting Techniques
- Introduction
- Making Presentation-Quality Reports
- Common Formatting Features
- Conditional Formatting Using Data to Drive the Look of a Report
Part III. Advanced Crystal Reports Design
Using Cross-Tabs for Summarized Reporting
- Using Cross-Tabs for Summarized Reporting
- Introduction to Cross-Tabs
- Benefits of Cross-Tabs
- Using the Cross-Tab Wizard
- Using Top N with Cross-Tabs Reports
- Using Advanced Cross-Tab Features
Using Record Selections and Alerts for Interactive Reporting
- Using Record Selections and Alerts for Interactive Reporting
- Creating Advanced Record Selection Formulas
- Adding Alerting to Your Reports
- Performance Monitoring and Tuning
Using Subreports and Multi-Pass Reporting
- Using Subreports and Multi-Pass Reporting
- Understanding Subreports
- Understanding Linked Versus Unlinked Subreports
- Considering Subreport Execution Time and Performance
- Using Variables to Pass Data Between Reports
- Emulating Nested Subreports
- Troubleshooting
Using Formulas and Custom Functions
- Using Formulas and Custom Functions
- Becoming More Productive with Formulas
- Choosing a Formula Language: Crystal Versus Basic Syntax
- Using Brackets in Formulas
- Using Characters in Formulas
- Recent Improvements to Formulas
Designing Effective Report Templates
- Designing Effective Report Templates
- Understanding the Importance of Reuse in Reporting
- Understanding Report Templates
- Using Report Templates
- Using Existing Crystal Reports as Templates
- Understanding How Templates Work
- Creating Useful Report Templates
- Using Template Field Objects
- Using Report Templates to Reduce Report Creation Effort
- Applying Multiple Templates
Additional Data Sources for Crystal Reports
- Additional Data Sources for Crystal Reports
- Understanding the Additional Crystal Reports Data Sources
- Connecting to COM-based Data Sources
- Connecting to Java-based Data Sources
- Understanding Solution Kits for Crystal Enterprise
- Troubleshooting
Multidimensional Reporting Against OLAP Data with Crystal Reports
- Multidimensional Reporting Against OLAP Data with Crystal Reports
- Introduction to OLAP
- OLAP Concepts and OLAP Reporting
- Recently Added or Changed OLAP Features in Crystal Reports
- Using the OLAP Report Creation Wizard and OLAP Expert
- Advanced OLAP Reporting
- Introduction to Crystal Analysis
Part IV. Enterprise Report Design Analytic, Web-based, and Excel Report Design
Introduction to Crystal Repository
- Introduction to Crystal Repository
- What Is the Crystal Repository?
- Why Implement the Crystal Repository?
- Installing the Crystal Repository
- Adding Objects to and from the Repository
- Migration of the Crystal Enterprise Repository
- Troubleshooting
Crystal Reports Semantic Layer Business Views
- Crystal Reports Semantic Layer Business Views
- Introduction to Business Views
- Why Implement Business Views?
- Performance and Implementation Considerations
- Business Views Architecture and Implementation
- Troubleshooting
Creating Crystal Analysis Reports
- Creating Crystal Analysis Reports
- Introduction
- Introducing Crystal Analysis
- Accessing OLAP Data with Crystal Analysis
- Designing Crystal Analysis Reports and Applications
- Adding Crystal Analysis Objects to a Report
- Troubleshooting
Advanced Crystal Analysis Report Design
- Advanced Crystal Analysis Report Design
- Introduction
- Advanced Crystal Analysis Designer Tools
- Custom Calculations and Advanced Data Analysis
- Setting Report Options
- Troubleshooting
- Crystal Analysis in the Real World MDX
Ad-Hoc Application and Excel Plug-in for Ad-Hoc and Analytic Reporting
- Ad-Hoc Application and Excel Plug-in for Ad-Hoc and Analytic Reporting
- Introducing Ad-Hoc Reporting Conceptually
- Introducing the Crystal Enterprise Ad-Hoc Reporting Application
- Crystal Reports Excel Plug-in
- Crystal Analysis Excel Plug-in
Part V. Web Report Distribution Using Crystal Enterprise
Introduction to Crystal Enterprise
- Introduction to Crystal Enterprise
- What Is Crystal Enterprise?
- Why Implement a Crystal Enterprise Solution?
- Versions of Crystal Enterprise
- Understanding the Core Functions of Crystal Enterprise
Using Crystal Enterprise with Web Desktop
- Using Crystal Enterprise with Web Desktop
- Introduction
- Crystal Enterprise User Launchpad
- Crystal Enterprise Web Desktop
- Customizing the Web Desktop and Report Viewers
- Publishing to the Web Desktop
- Customizing the Web Desktop
- Troubleshooting
Crystal Enterprise Architecture
- Crystal Enterprise Architecture
- Introduction
- Crystal Enterprise Architecture Overview
- The Client Tier
- The Application Tier
- The Server Tier: Introduction to the Crystal Enterprise Framework
- The Server Tier: Overview of the Crystal Enterprise Services
- The Data Tier
- The Crystal Enterprise Architecture in Action
- Taking Advantage of the Crystal Enterprise Distributed Architecture
- Extending Crystal Enterprise
Planning Considerations When Deploying Crystal Enterprise
- Planning Considerations When Deploying Crystal Enterprise
- Ensuring a Successful Crystal Enterprise Implementation
- Approaching the Project
- Identifying Business Pain
- Establishing Project Requirements
- Understanding Organizational Reporting Requirements
- Troubleshooting
Deploying Crystal Enterprise in a Complex Network Environment
- Deploying Crystal Enterprise in a Complex Network Environment
- Introduction
- Understanding Network Protocols
- Understanding Firewall Types
- Configuring the Crystal Enterprise Architecture for Your Network Environment
- Interaction Between the WCS and the WC
- Deploying Crystal Enterprise with an IP Packet Filtering Firewall
- Using Crystal Enterprise with NAT
- Exploring the NAT and Crystal Enterprise Relationship
- Crystal Enterprise and Proxy Servers
Administering and Configuring Crystal Enterprise
- Introduction
- Using the Crystal Management Console
- Managing Accounts
- Managing Content
- Introducing Servers
- Managing Crystal Enterprise System Settings
- Using the Crystal Configuration Manager
Part VI. Customized Report Distribution Using Crystal Reports Components
Java Reporting Components
- Java Reporting Components
- Overview of the Crystal Reports Java Reporting Component
- Understanding the Java Reporting Components Architecture
- Differences with the Java Reporting Engine
- Configuring the Application Server
- Delivering Reports in Web Applications
- Using the Crystal Tag Libraries
- Exporting Reports to Other File Formats
- Printing Reports from the Browser
- Common Programming Tasks
- Troubleshooting
Crystal Reports .NET Components
- Crystal Reports .NET Components
- Understanding Microsofts .NET Platform
- Understanding the Different Crystal .NET Components
- An Overview of the Crystal Reports 10 .NET Components
- The Report Designer
- The Report Engine Object Model
- Delivering Reports with the Windows Forms Viewer
- Delivering Reports with the Web Forms Viewer
- Database Credentials
- Setting Parameters
- Troubleshooting
COM Reporting Components
- COM Reporting Components
- Understanding the Report Designer Component
- Building Reports with the Visual Basic Report Designer
- Programming with the Report Engine Object Model
- Delivering Reports Using the Report Viewer
- Troubleshooting
Part VII. Customized Report Distribution Using Crystal Enterprise Embedded Edition
Introduction to Crystal Enterprise Embedded Edition
- Introduction to Crystal Enterprise Embedded Edition
- Introduction to Crystal Enterprise Embedded Edition
- Understanding Crystal Enterprise Embedded Edition
- Crystal Enterprise Embedded Edition Samples
- DHTML Report Design Wizard
- Troubleshooting
Crystal Enterprise Viewing Reports
- Crystal Enterprise Viewing Reports
- Viewing Reports over the Web
- Introduction to the Crystal Report Viewers
- Understanding the Report Source
- Implementing the Page Viewer
- Implementing the Part Viewer
- Implementing the Interactive Viewer
- Implementing the Grid Viewer
- Troubleshooting
Crystal Enterprise Embedded Report Modification and Creation
- Introduction
- Deploying RAS Environments
- Loading Report Files
- Locating RAS Components in a Network Architecture
- Installing the RAS SDK
- Best Practices in RAS Exception Handling
- The RAS SDK in Action
Part VIII. Customized Report Distribution Using Crystal Enterprise Professional
Introduction to the Crystal Enterprise Professional Object Model
- Introduction to the Crystal Enterprise Professional Object Model
- Understanding the Crystal Enterprise Object Model
- Establishing a Crystal Enterprise Session
- Querying the Crystal Enterprise Repository
- Viewing Reports
- The Crystal Enterprise Java SDK
- Accessing the Java SDK
- Troubleshooting
Creating Enterprise Reports Applications with Crystal Enterprise Part I
- Creating Enterprise Reports Applications with Crystal Enterprise Part I
- Advanced Scenarios with the Crystal Enterprise Object Model
- Scheduling Reports
- Scheduling to a Destination
- Using Crystal Enterprise Notifications
- Scheduling to a Server Group
- Scheduling to a Specific Format
- Setting Database Credentials
- Troubleshooting
Creating Enterprise Reporting Applications with Crystal Enterprise Part II
- Creating Enterprise Reporting Applications with Crystal Enterprise Part II
- Querying the Crystal Enterprise InfoStore
- Creating and Responding to Crystal Enterprise Alerts
- Creating Schedulable Program Objects
- Troubleshooting
Appendix A. Using Sql Queries In Crystal Reports
Creating Enterprise Reporting Applications with Crystal Enterprise Part II
EAN: 2147483647
Pages: 341
