Positioning and Sizing Report Objects
After you have completed your functional report design tasksconnecting to the data source, adding report objects, and structuring the reportthe next step in the report design process is to format the various objects on a report. As demonstrated in Chapter 1, "Creating and Designing Basic Reports," objects can be added to a report via a variety of methodsdragging and dropping objects from the design explorers or selecting objects from toolbar and menu commands and placing them in the desired locationsfor quick and intuitive report creation. Upon successfully adding objects to your report, each of the respective objects can be positioned, sized, and formatted for display purposes, as demonstrated in the following exercise.
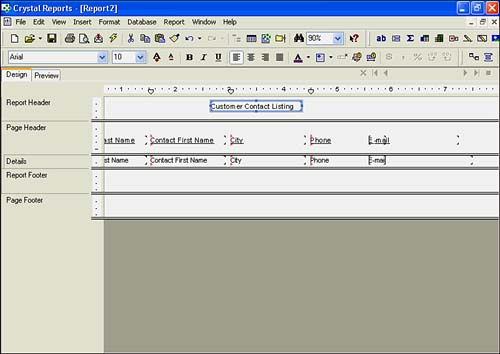
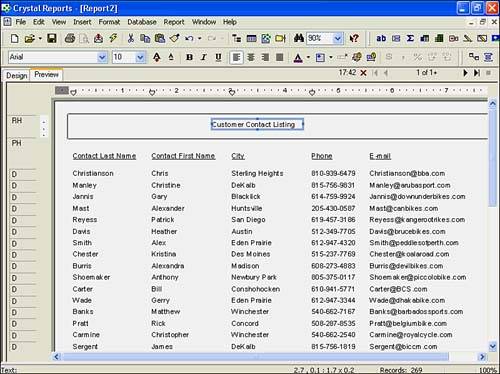
As a visual example of the difference that report formatting efforts can make, compare the presentation value of the report samples shown in Figures 6.1 and 6.2. These two reports accomplish the same functional tasks, but the report in Figure 6.2 is much more visually appealing.
Figure 6.1. A customer contact listing report with little to no formatting applied.
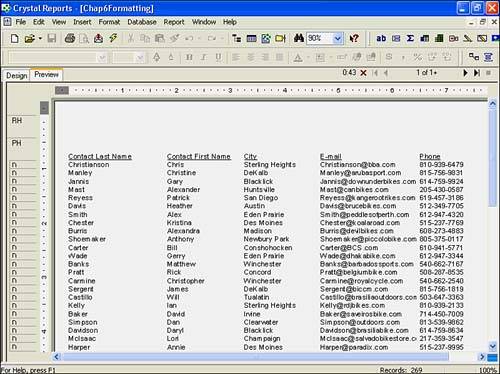
Figure 6.2. A customer contact listing report with a moderate amount of formatting applied.
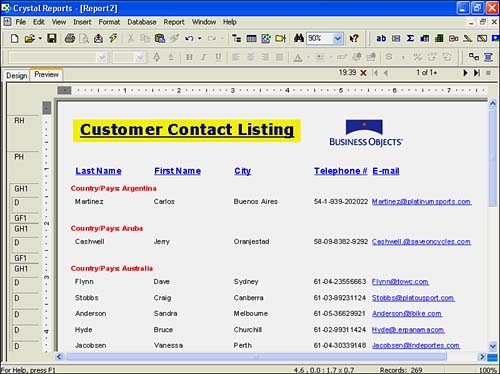
You will spend the remainder of this chapter reproducing many of the visual transformations from Figure 6.1 to Figure 6.2. By completing the following exercises, you create a Customer Contact Listing report using a variety of applied formatting techniques, such as adding a group definition to logically structure customers into their respective countries, and formatting the font styles of the report title, column titles, country description, and e-mail address fields to make for a more precise presentation of the report information. By combining the Country database field with a text field, you also provide for a bilingual display of the country description.
To begin designing your report, follow these steps to create your own nicely formatted Customer Contact Listing report:
- Open the Crystal Reports application and choose to Create a New Report Using the Blank Report Layout from the Report Gallery dialog.
- From the Database Explorer dialog, expand the Create a New Connection list, and then expand the ODBC (RDO) node to present the ODBC dialog window that lists the available data sources. Select the Xtreme Sample Database from the list of data sources and click Finish to continue to the Database Expert dialog.
- From the Database Expert dialog, use the arrow (>) button to add the Customer table to the Selected Tables list on the right. Click OK to continue.
- From the View menu, select the Field Explorer command to open the Field Explorer dialog.
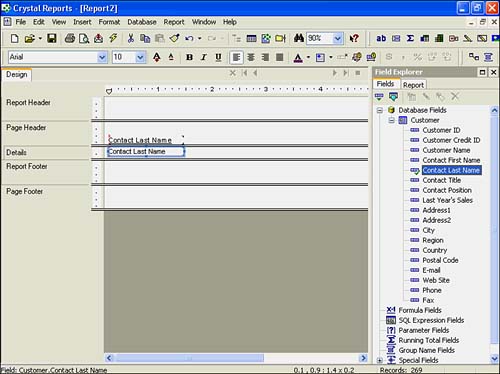
- From the Field Explorer, click and drag the Contact Last Name field onto the report's design view and place it to the far left of the Details section area, as shown in Figure 6.3.
Figure 6.3. Add the Contact Last Name field to the Details section of the report.
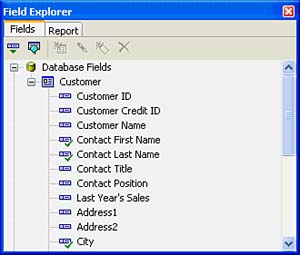
- Follow the previous step to add the Contact First Name, City, and E-mail fields to the Details section of the report, as shown in Figure 6.4.
Figure 6.4. The selected fields displayed within the respective sections of the report and a floating Field Explorer dialog.
- From the Insert menu, select Text Object and drop the object into the middle of the Report Header section (as shown in Figure 6.4) and type Customer Contact Listing in the text field. Click anywhere outside the text object to remove the cursor focus from the text object.
Now that the report includes the field and text objects identified previously, focus on positioning and resizing these fields for display purposes.
- As Figure 6.4 shows, you might not be able to see the entire text entered into the report title text object because it is not wide enough to display the text entry by default. To resolve this, click once on the report title text object located in the Report Header section so that it becomes highlighted. Using the dark blue handles that encompass the objects perimeters, float over the handle located on the right side of the text object with the mouse pointer; then click and hold the mouse button while dragging the handle farther to the right to widen the text object's display area. Refer to Figure 6.5 to see the result of this action.
Figure 6.5. The sample report displays five database field objects in the Details section, five database field column header text fields in the Page Header, and one text object in the Report Header section.
NOTE
Notice that when you float over the perimeter handles of an object with your mouse cursor (or pointer), the cursor icon turns into an alternative shape, such as horizontal or vertical arrows, to illustrate that you can modify the object if you click on the handle.
- Now that you have widened the display area of your report title object using the concept of object handles, repeat this same step to modify the width of the field objects within the Details report section so that you can insert one additional object into the Details section of your report between the City and E-mail fields.
- Using the Field Explorer, insert the Phone database field from the Customer table into the Details section of your report. Based on the previous steps, practice positioning and sizing the objects in the Details section to accommodate for all the database fields, as shown in Figure 6.5.
TIP
Although many formatting activities can be exercised on field objects in both the design and preview tabs, some formatting facilities are only available within the Design tab. One useful feature to take note of is the capability to move a highlighted field (or even a set of fields) and its associated column title with the arrow keys on your keypad. This technique is a great help when you're moving report fields around as you did in step 9.
NOTE
As you might have noticed, the field sizes are often large enough to show the entire field name in the Design view of the report. But from the Preview tab view of the report, you see that fields (such as the E-mail or Phone fields here) are cut off from the display area. This is not unusual, and it might require you to resize the field objects to ensure that they are appropriate for the report display area. It is often useful to use the report's Preview tab as the active window when finalizing the formatting and layout of your reports.
- Now click the Preview tab to see a preview display of what the report actually looks like, as shown in Figure 6.6.
Figure 6.6. To preview your report, either select the Preview tab or click the Refresh button.
NOTE
If the Preview tab is not displayed in the application, you have not yet run the report against the database. To run the report, click the Refresh toolbar icon to execute the report to runthe Refresh toolbar icon is represented with a yellow lightning bolt.
NOTE
Although it's important to understand the basics of report formatting, you will not necessarily have to go through the often arduous process of formatting reports every time. Report templates can be used to apply predefined and meaningful formatting characteristics in a very quick manner.
 For more details on designing and using report templates, p. 300
Part I. Crystal Reports Design
Creating and Designing Basic Reports
- Creating and Designing Basic Reports
- Introducing the Crystal Reports Designer
- Understanding Data and Data Sources
- Introduction to the Data Explorer
- Adding Database Objects to Your Report
- Joining Database Objects Together
- Understanding the Different Join Types
- Using the Report Creation Wizards
- Understanding the Crystal Reports Gallery
- Using the Standard Report Creation Wizard
- Creating a Report Without Wizards
- Troubleshooting
Selecting and Grouping Data
- Selecting and Grouping Data
- Introduction
- Understanding Field Objects
- Working with Groups
- Understanding Drill-down Reports
- Troubleshooting
Filtering, Sorting, and Summarizing Data
- Filtering, Sorting, and Summarizing Data
- Introduction
- Filtering the Data in Your Report
- Learning to Sort Records
- Working with the Sort Expert
- Creating Effective Summaries
- Troubleshooting
Understanding and Implementing Formulas
- Understanding and Implementing Formulas
- Introduction
- Using the Formula Workshop
- Using the Workshop Formula Editor
- Creating Formulas with the Formula Expert
- Using the Formula Extractor to Create Custom Functions
- The Multi-Pass Reporting Process of the Crystal Reports Engine
- Troubleshooting
Implementing Parameters for Dynamic Reporting
- Implementing Parameters for Dynamic Reporting
- Introduction
- Understanding the Value of Parameters
- Creating and Implementing Parameters Fields
- Using Parameters with Record Selections
Part II. Formatting Crystal Reports
Fundamentals of Report Formatting
- Fundamentals of Report Formatting
- Introduction
- Positioning and Sizing Report Objects
- Modifying Object Properties for Formatting Purposes
- Exploring the Format Editor Dialog Common Options
- Combining and Layering Report Objects
- Configuring Report Page and Margin Properties
Working with Report Sections
- Working with Report Sections
- Introduction
- Formatting Report Sections
- Modifying Report Section Properties
- Using Multiple Report Sections
- Troubleshooting
Visualizing Your Data with Charts and Maps
- Visualizing Your Data with Charts and Maps
- Introduction to Charts and Maps
- Using the Chart Expert
- Using the Map Expert
- Modifying Chart and Map Properties
- Troubleshooting
Custom Formatting Techniques
- Introduction
- Making Presentation-Quality Reports
- Common Formatting Features
- Conditional Formatting Using Data to Drive the Look of a Report
Part III. Advanced Crystal Reports Design
Using Cross-Tabs for Summarized Reporting
- Using Cross-Tabs for Summarized Reporting
- Introduction to Cross-Tabs
- Benefits of Cross-Tabs
- Using the Cross-Tab Wizard
- Using Top N with Cross-Tabs Reports
- Using Advanced Cross-Tab Features
Using Record Selections and Alerts for Interactive Reporting
- Using Record Selections and Alerts for Interactive Reporting
- Creating Advanced Record Selection Formulas
- Adding Alerting to Your Reports
- Performance Monitoring and Tuning
Using Subreports and Multi-Pass Reporting
- Using Subreports and Multi-Pass Reporting
- Understanding Subreports
- Understanding Linked Versus Unlinked Subreports
- Considering Subreport Execution Time and Performance
- Using Variables to Pass Data Between Reports
- Emulating Nested Subreports
- Troubleshooting
Using Formulas and Custom Functions
- Using Formulas and Custom Functions
- Becoming More Productive with Formulas
- Choosing a Formula Language: Crystal Versus Basic Syntax
- Using Brackets in Formulas
- Using Characters in Formulas
- Recent Improvements to Formulas
Designing Effective Report Templates
- Designing Effective Report Templates
- Understanding the Importance of Reuse in Reporting
- Understanding Report Templates
- Using Report Templates
- Using Existing Crystal Reports as Templates
- Understanding How Templates Work
- Creating Useful Report Templates
- Using Template Field Objects
- Using Report Templates to Reduce Report Creation Effort
- Applying Multiple Templates
Additional Data Sources for Crystal Reports
- Additional Data Sources for Crystal Reports
- Understanding the Additional Crystal Reports Data Sources
- Connecting to COM-based Data Sources
- Connecting to Java-based Data Sources
- Understanding Solution Kits for Crystal Enterprise
- Troubleshooting
Multidimensional Reporting Against OLAP Data with Crystal Reports
- Multidimensional Reporting Against OLAP Data with Crystal Reports
- Introduction to OLAP
- OLAP Concepts and OLAP Reporting
- Recently Added or Changed OLAP Features in Crystal Reports
- Using the OLAP Report Creation Wizard and OLAP Expert
- Advanced OLAP Reporting
- Introduction to Crystal Analysis
Part IV. Enterprise Report Design Analytic, Web-based, and Excel Report Design
Introduction to Crystal Repository
- Introduction to Crystal Repository
- What Is the Crystal Repository?
- Why Implement the Crystal Repository?
- Installing the Crystal Repository
- Adding Objects to and from the Repository
- Migration of the Crystal Enterprise Repository
- Troubleshooting
Crystal Reports Semantic Layer Business Views
- Crystal Reports Semantic Layer Business Views
- Introduction to Business Views
- Why Implement Business Views?
- Performance and Implementation Considerations
- Business Views Architecture and Implementation
- Troubleshooting
Creating Crystal Analysis Reports
- Creating Crystal Analysis Reports
- Introduction
- Introducing Crystal Analysis
- Accessing OLAP Data with Crystal Analysis
- Designing Crystal Analysis Reports and Applications
- Adding Crystal Analysis Objects to a Report
- Troubleshooting
Advanced Crystal Analysis Report Design
- Advanced Crystal Analysis Report Design
- Introduction
- Advanced Crystal Analysis Designer Tools
- Custom Calculations and Advanced Data Analysis
- Setting Report Options
- Troubleshooting
- Crystal Analysis in the Real World MDX
Ad-Hoc Application and Excel Plug-in for Ad-Hoc and Analytic Reporting
- Ad-Hoc Application and Excel Plug-in for Ad-Hoc and Analytic Reporting
- Introducing Ad-Hoc Reporting Conceptually
- Introducing the Crystal Enterprise Ad-Hoc Reporting Application
- Crystal Reports Excel Plug-in
- Crystal Analysis Excel Plug-in
Part V. Web Report Distribution Using Crystal Enterprise
Introduction to Crystal Enterprise
- Introduction to Crystal Enterprise
- What Is Crystal Enterprise?
- Why Implement a Crystal Enterprise Solution?
- Versions of Crystal Enterprise
- Understanding the Core Functions of Crystal Enterprise
Using Crystal Enterprise with Web Desktop
- Using Crystal Enterprise with Web Desktop
- Introduction
- Crystal Enterprise User Launchpad
- Crystal Enterprise Web Desktop
- Customizing the Web Desktop and Report Viewers
- Publishing to the Web Desktop
- Customizing the Web Desktop
- Troubleshooting
Crystal Enterprise Architecture
- Crystal Enterprise Architecture
- Introduction
- Crystal Enterprise Architecture Overview
- The Client Tier
- The Application Tier
- The Server Tier: Introduction to the Crystal Enterprise Framework
- The Server Tier: Overview of the Crystal Enterprise Services
- The Data Tier
- The Crystal Enterprise Architecture in Action
- Taking Advantage of the Crystal Enterprise Distributed Architecture
- Extending Crystal Enterprise
Planning Considerations When Deploying Crystal Enterprise
- Planning Considerations When Deploying Crystal Enterprise
- Ensuring a Successful Crystal Enterprise Implementation
- Approaching the Project
- Identifying Business Pain
- Establishing Project Requirements
- Understanding Organizational Reporting Requirements
- Troubleshooting
Deploying Crystal Enterprise in a Complex Network Environment
- Deploying Crystal Enterprise in a Complex Network Environment
- Introduction
- Understanding Network Protocols
- Understanding Firewall Types
- Configuring the Crystal Enterprise Architecture for Your Network Environment
- Interaction Between the WCS and the WC
- Deploying Crystal Enterprise with an IP Packet Filtering Firewall
- Using Crystal Enterprise with NAT
- Exploring the NAT and Crystal Enterprise Relationship
- Crystal Enterprise and Proxy Servers
Administering and Configuring Crystal Enterprise
- Introduction
- Using the Crystal Management Console
- Managing Accounts
- Managing Content
- Introducing Servers
- Managing Crystal Enterprise System Settings
- Using the Crystal Configuration Manager
Part VI. Customized Report Distribution Using Crystal Reports Components
Java Reporting Components
- Java Reporting Components
- Overview of the Crystal Reports Java Reporting Component
- Understanding the Java Reporting Components Architecture
- Differences with the Java Reporting Engine
- Configuring the Application Server
- Delivering Reports in Web Applications
- Using the Crystal Tag Libraries
- Exporting Reports to Other File Formats
- Printing Reports from the Browser
- Common Programming Tasks
- Troubleshooting
Crystal Reports .NET Components
- Crystal Reports .NET Components
- Understanding Microsofts .NET Platform
- Understanding the Different Crystal .NET Components
- An Overview of the Crystal Reports 10 .NET Components
- The Report Designer
- The Report Engine Object Model
- Delivering Reports with the Windows Forms Viewer
- Delivering Reports with the Web Forms Viewer
- Database Credentials
- Setting Parameters
- Troubleshooting
COM Reporting Components
- COM Reporting Components
- Understanding the Report Designer Component
- Building Reports with the Visual Basic Report Designer
- Programming with the Report Engine Object Model
- Delivering Reports Using the Report Viewer
- Troubleshooting
Part VII. Customized Report Distribution Using Crystal Enterprise Embedded Edition
Introduction to Crystal Enterprise Embedded Edition
- Introduction to Crystal Enterprise Embedded Edition
- Introduction to Crystal Enterprise Embedded Edition
- Understanding Crystal Enterprise Embedded Edition
- Crystal Enterprise Embedded Edition Samples
- DHTML Report Design Wizard
- Troubleshooting
Crystal Enterprise Viewing Reports
- Crystal Enterprise Viewing Reports
- Viewing Reports over the Web
- Introduction to the Crystal Report Viewers
- Understanding the Report Source
- Implementing the Page Viewer
- Implementing the Part Viewer
- Implementing the Interactive Viewer
- Implementing the Grid Viewer
- Troubleshooting
Crystal Enterprise Embedded Report Modification and Creation
- Introduction
- Deploying RAS Environments
- Loading Report Files
- Locating RAS Components in a Network Architecture
- Installing the RAS SDK
- Best Practices in RAS Exception Handling
- The RAS SDK in Action
Part VIII. Customized Report Distribution Using Crystal Enterprise Professional
Introduction to the Crystal Enterprise Professional Object Model
- Introduction to the Crystal Enterprise Professional Object Model
- Understanding the Crystal Enterprise Object Model
- Establishing a Crystal Enterprise Session
- Querying the Crystal Enterprise Repository
- Viewing Reports
- The Crystal Enterprise Java SDK
- Accessing the Java SDK
- Troubleshooting
Creating Enterprise Reports Applications with Crystal Enterprise Part I
- Creating Enterprise Reports Applications with Crystal Enterprise Part I
- Advanced Scenarios with the Crystal Enterprise Object Model
- Scheduling Reports
- Scheduling to a Destination
- Using Crystal Enterprise Notifications
- Scheduling to a Server Group
- Scheduling to a Specific Format
- Setting Database Credentials
- Troubleshooting
Creating Enterprise Reporting Applications with Crystal Enterprise Part II
- Creating Enterprise Reporting Applications with Crystal Enterprise Part II
- Querying the Crystal Enterprise InfoStore
- Creating and Responding to Crystal Enterprise Alerts
- Creating Schedulable Program Objects
- Troubleshooting
Appendix A. Using Sql Queries In Crystal Reports
Creating Enterprise Reporting Applications with Crystal Enterprise Part II
EAN: 2147483647
Pages: 341
