Using the OLAP Report Creation Wizard and OLAP Expert
Crystal Reports provides two easy ways to create reports against OLAP data sources. As introduced in Chapter 1, "Creating and Designing Basic Reports," Crystal provides several report wizards to step you through the creation of some popular types of reportsone of those is OLAP. The OLAP Wizard involves five steps and walks you through the process of creating an OLAP grid and an optional supporting graphic based on an existing data source. The OLAP Wizard is accessible when you are creating a new report.
The second method of creating an OLAP-based report is through the OLAP Expert that is accessed from the Insert OLAP Grid on the Insert menu. This expert provides six tabs that step through the creation of an OLAP grid to be placed anywhere on a report.
The two methods of creation offer very similar degrees of functionality, and their respective dialog screens and tabs are almost identical. The OLAP Report Creation Wizard does provide a built-in Charting screen not found in the OLAP Expert, whereas the OLAP Expert provides Style Customization and Label tabs not found in the OLAP Wizard.
NOTE
Although Crystal Reports has been designed to report off of numerous multidimensionalOLAP databases including Hyperion Essbase, Microsoft SQL Server Analysis Services, and SAP BW, for the purposes of demonstration in this chapter, examples will be based on the SQL Server sample HR cubeFoodMart. If a different OLAP Database is available, the general principles should be followed against that native OLAP cube.
Specifying an OLAP Data Source
The OLAP Data tab (or screen in the OLAP Wizard) requests the OLAP data source on which the report is to be based. This wizard and its associated dialog screens are to multidimensional data sources what the data explorer, introduced in Chapter 1, is to relational data. Figure 16.1 shows the OLAP Data screen from the OLAP Wizard.
Figure 16.1. The OLAP Data dialog from the OLAP Report Creation Wizard.
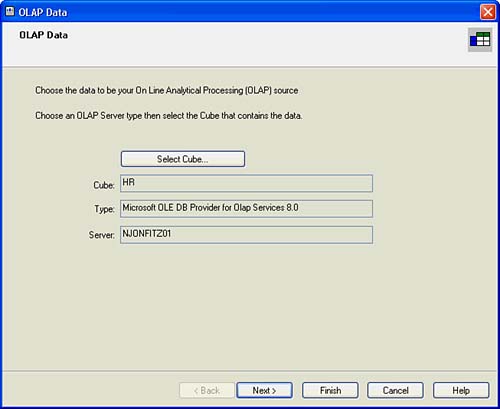
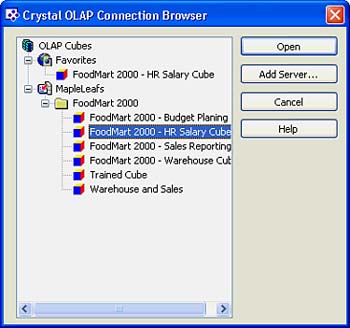
When this screen is first displayed, a cube will need to be selected with the Select Cube button. Clicking on this button opens the Crystal OLAP Connection Browser, which is displayed in Figure 16.2. From the tree control presented in this dialog, select the desired cube.
Figure 16.2. The Crystal OLAP Connection Browser enables the specification of an OLAP data source for the involved Crystal Report.
 For detailed coverage of the Crystal OLAP Connection Browser and the functionality it provides, p. 378
To help you learn about the creation of an OLAP-based Crystal Report, here are the introductory steps to doing exactly that against SQL Server's sample FoodMart cube. Other steps will follow these initial steps after subsequent screens have been explained. Start the OLAP Report Creation process with the following steps:
- Create a New Crystal Report and select the OLAP Wizard from the Crystal Reports Gallery dialog.
- Click the Select Cube button from the OLAP Data dialog.
- Assuming that the location of the OLAP Server has not already been identified to the Crystal OLAP Connection Browser, click the Add Server button and identify the location of your SQL Server Analysis Server and the sample HR cube. Figure 16.3 shows the New Server dialog.
Figure 16.3. The New Server dialog is used to connect to new OLAP data sources.
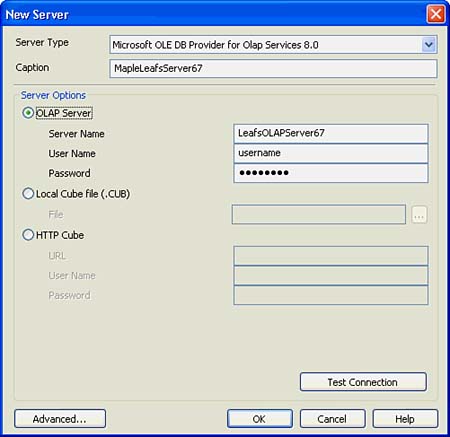
- Enter a caption for the OLAP Server you are adding. This caption will appear in the Crystal OLAP Connection Browser. Enter the name of the SQL Server Analysis Server for the server name and click OK.
- Back in the Crystal OLAP Connection Browser, navigate into the presented list of servers (there will likely only be the one you just added) and double-click on the sample HR cube.
- Click the Next button to proceed.
NOTE
A Select CAR File button exists on the Data screen of the OLAP Report Creation Wizard, in addition to the Select Cube button. CAR files are Crystal Analytic Reports (CAR) and are created with the sister product to Crystal ReportsCrystal Analysis. This product is an OLAP-focused reporting and application tool and will be briefly introduced in Chapter 19, "Creating Crystal Analysis Reports," and Chapter 20, "Advanced Crystal Analysis Report Design." These CAR files can be treated as multidimensional data sources because they themselves contain connectivity information to an underlying OLAP data source.
Specifying OLAP Rows and Columns
The Rows/Columns dialog screen enables you to select both the dimensions and fields to be presented along the columns and rows of the OLAP grid. All the available dimensions in the selected cube/data source are listed in the Dimensions list box depicted in Figure 16.4.
Figure 16.4. The Rows/Columns dialog of the OLAP Report Creation Wizard.
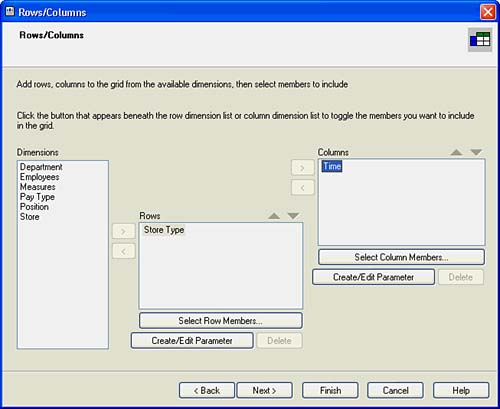
To select a dimension for placement in the rows section or the columns section of the OLAP grid, highlight the desired dimension and click either the column or row arrow (>) button. It is possible to select multiple dimensions to be displayed and have these nested in the OLAP grid by successively selecting multiple dimensions for either the rows or the columns section. It is also possible to remove dimensions from the existing row or column list boxes; however, the column and row dimension list boxes cannot be left empty.
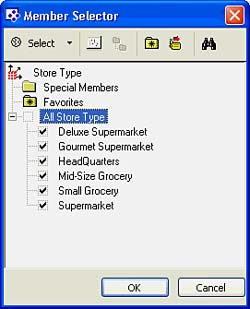
After the desired dimensions are selected, a subset of the fields (also known as members) for those dimensions can be selected using the Select Row Members or Select Column Members buttons. Examples of this might be selecting only a certain subset of provinces or states in a region dimension or, alternatively, selecting only a certain year's worth of data in a time dimension. By highlighting a dimension in either of the Rows or Columns list box and then selecting the appropriate Selection button, a subset of the members for the involved dimension can be selected from the Member Selector dialog as shown in Figure 16.5.
Figure 16.5. The Member Selector dialog is used to select default Column and Row Dimension members.
The last and newest feature of the Rows/Column screen is the Create/Edit Parameter functionality provided for each of the Row and Column dimensions. This capability provides the business user or report consumer with the capability to interact with the report and control its content by entering parameters that directly affect the dimension members displayed in the OLAP grid(s) on the report.
Because Chapter 5, "Implementing Parameters for Dynamic Reporting," covered parameters in detail, you are likely familiar with this topic already. Of significance for this wizard screen is that the parameter creation process is directly accessible here, and this facilitates the rapid development of formatted and interactive OLAP reports. If necessary, review Chapter 5 for a refresher on creating and editing parameters.
TIP
The Member Selector dialog provides some powerful shortcuts for the selection of certain logical groups of members. These selection shortcuts are accessed through either the Select drop-down box or by right-clicking on any part of the Member Selection list box. Sample selection shortcuts include the capability to select all base level members or all members at a highlighted level.
Continuing with the creation of the sample report started in the last section, the following steps walk through the Rows/Columns screen part of this report creation example and allow for the refinement of the data to be viewed in the OLAP grid. Follow these steps to add rows and columns to your OLAP-based report:
- Select the Store Type Dimension from the available dimensions list as the Row Dimension using the Row Dimension arrow button. (Note: It will likely be necessary to remove a default dimension to ensure that this is the only dimension in the Row Dimensions list view.)
- Using the Select Row Field's button, select all the Store Types (for example, Supermarket, Headquarters, and so on) from the Member Selection dialog, but deselect the aggregated top level All Stores field. This enables the OLAP grid to present all the different store types down the side of the grid as rows.
- Select the Time Dimension from the available dimensions list as the Column Dimension using the Column Dimension arrow (>) button. (Note: It will likely be necessary to remove a default dimension to ensure that this is the only dimension in the Column Dimensions list view.)
- Using the Select Column Field's button, select the years 1997 and 1998 from the Member Selection dialog, but ensure that no children members have been selected. This enables the OLAP grid to present a comparison of the two years of data in two side-by-side columns.
- Click the Next button to proceed.
At this point, you will review the concept of OLAP dimension filters and pages in your OLAP report.
Specifying OLAP Dimension Slices (Filters) and Pages
The Slice/Page dialog of the OLAP Report Creation Wizard, shown in Figure 16.6, enables you to select values or members for the dimensions that were not selected to be row or column dimensions. In the OLAP world, these dimensions are often called paged or sliced dimensions.
Figure 16.6. The Slice/Page screen of the OLAP Report Creation Wizard allows manipulation of the dimensions not selected for use on either the rows or columns.
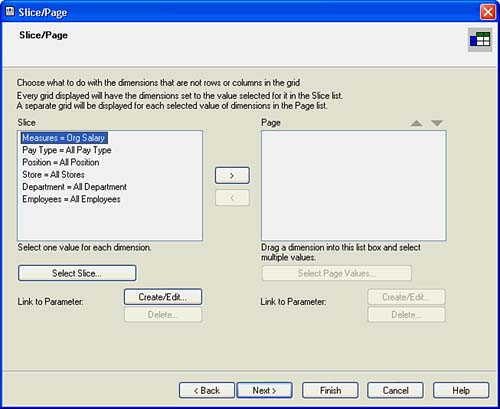
The Slice list box lists all the paged dimensions and their current member settings. The default setting is usually all members for any given dimension. An example is that for the Store Dimension, the default slice setting is All Stores. To change the member selection (slice) for a particular dimension, that dimension must be selected in the Slice list box and the Select Slice button must be used to open the familiar Member Selection dialog (refer to Figure 16.5). This dialog is identical to the Member Selection dialog used previously except that only one member from the selected dimension can be selected. If multiple members from a slice dimension are required in a report, the Page list box should be used and separate pages/grids will be created for each value selected.
The Page list box is initially empty but can contain any dimensions outside the row and column dimensions that require multiple member selection. An example could involve selecting the three countries of North America as store regions. The selection of multiple values for a paged dimension creates completely separate grids (based on the same preselected rows and columns) for each selected member value. To select multiple members for a dimension, the involved dimension needs to be selected in the Slice list box and moved to the Page list box using the transfer arrow buttons between the list boxes. Once moved to the Page list box, the Select Page Values button enables multiple member selection through the Member Selection dialog.
The last, but perhaps most powerful, feature of the Slice/Page screen is the Link to Parameter functionality provided for each of the Filtered and Paged dimensions. This capability provides the business user or report consumer with the capability to interact with the report and control its content by entering parameters that directly affect the information displayed in the OLAP grid(s) on the report.
Of significance for this wizard screen is that the parameter creation process is directly accessible here, and this facilitates the rapid development of formatted and interactive OLAP reports.
For more information on creating and editing parameters, p. 129
Continuing with the creation of the sample report, the following steps walk through the Slice/Page dialog part of this report creation example and will enable you to select the measure that will be displayed in the OLAP grid. Follow these steps to select measures on the page/slice dimensions:
- Select the Measures dimension from the Filter list box.
- Instead of selecting a specific filter using the Select Filter Value button, click the Link to Parameter Create/Edit button to enable the business user to dynamically select this slice every time the report is run. The Create Parameter Field dialog, shown in Figure 16.7, appears.
Figure 16.7. The Create Parameter Field dialog called from the Slice/Page screen.
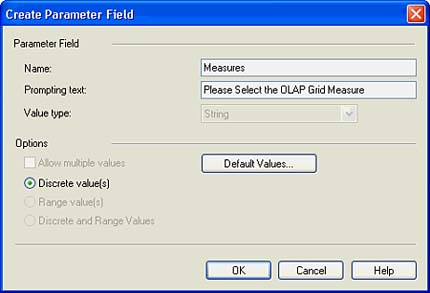
- In the Prompting Text text box, enter the text that you want your user to be prompted with when this report is run. In this case, it could be something similar to Please select the Measure to be used in your report. Also, ensure that the Discrete Value(s) radio button is selected because a range of entries is not required (or allowed) here.
- To avoid requiring users to type in any text, defaults can be set so that selection from a drop-down box is possible. To do this, click the Select Default button and the dialog in Figure 16.8 appears.
Figure 16.8. The Set Default Values dialog for the OLAP Slice Parameter.
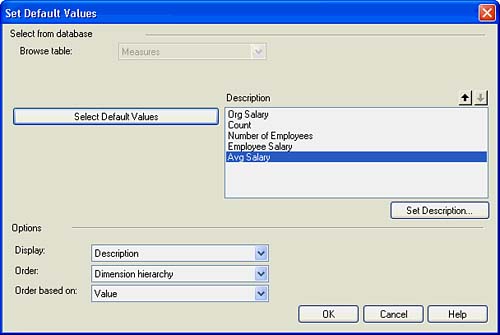
- The Measures table is preselected because the report respects the association with the previously highlighted dimension. Move all the available member values for the Measures dimension to the Description list box by clicking on the Select Default Values button and selecting all the members through the familiar Member Selector dialog.
- Ensure that the Display drop-down box has Description selected and that the Order drop-down box has no sort selected. Click OK twice to get back to the Slice/Page dialog of the OLAP Report Creation Wizard.
- Once you return to the Slice/Page dialog, highlight the Pay Type dimension in the Slice list box and click the arrow transfer/select button to move this to the Page list box. The Member Selection dialog will immediately appear with the Pay Type Dimension Hierarchy presented.
- Select the Hourly and Monthly pay types (children of All Pay Types) and deselect the All Pay Types field. Individual OLAP grids are now created for each of the monthly paid employees and the hourly paid employees. If this isn't clear now, it should make more sense when you are visualizing the report.
- Click OK and then Next to proceed.
CAUTION
After Parameters or Multi-Value Paged Dimensions have been set in the OLAP Report Creation Wizard, you can only access them for editing through the OLAP Design Wizard under the main Report menu. These settings are not configurable in the OLAP Expert.
Adding Report Styles in the OLAP Report Wizard
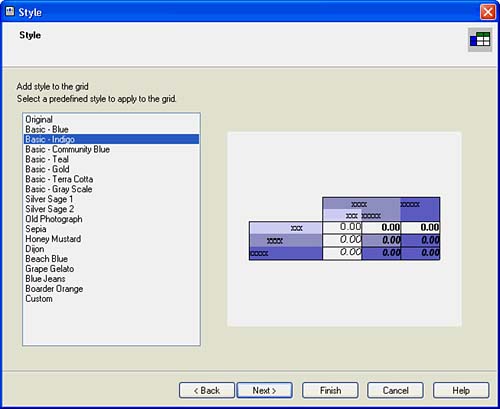
The Style dialog in the OLAP Report Creation Wizard enables you to select any one of a predetermined number of styles for OLAP grids available in Crystal Reports. Figure 16.9 displays the Style dialog. The styles are often considered a good starting point for formatting the OLAP grids on your reports and can be enhanced through both the Customize Style tab of the OLAP Expert (described later in the chapter) and using many of the advanced formatting features you have already learned about.
Figure 16.9. The Style dialog of the OLAP Report Creation Wizard.
Adding Charts via the OLAP Report Wizard
The Chart dialog provided in the OLAP Report Creation Wizard enables you to add graphics quickly to the OLAP report being created. The graphics available in this wizard, shown in Figure 16.10, are only a subset of the graphics available in Crystal Reports (refer to Chapter 8, "Visualizing Your Data with Charts and Maps," for a refresher), but they do enable the rapid visualization of your OLAP data without the need for using the Chart Expert.
Figure 16.10. The Chart dialog of OLAP Report Creation Wizard enables you to select between different basic chart types.
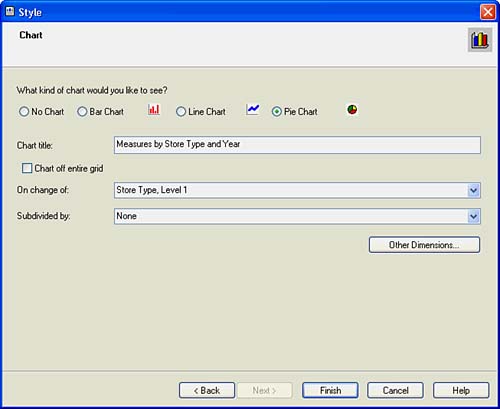
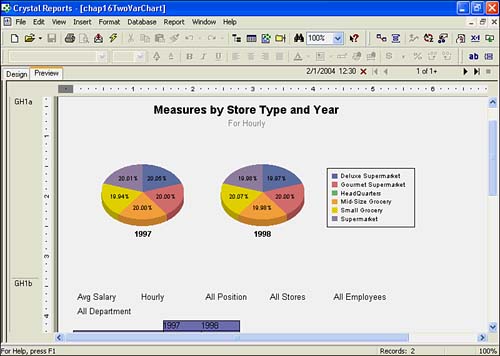
Aside from selecting the type of chart (bar, line, or pie) and specifying a title on this screen, an On Change Of field must be specified with an optional Subdivided By field before this screen is complete. As Chapter 8 discussed, the On Change Of field is the field in your data source that provides the breaking point for the involved graphic. Examples could include country, region, year, store, product, and so on. The Subdivided By field can provide a second variable to base your charts on. An example of a two-variable OLAP Chart using the FoodMart sample cube would be a chart showing salary information by year and then subdivided by store type. Using pie charts, Figure 16.11 shows what that might look like.
Figure 16.11. A two-variable OLAP Chart showing Avg Salary based on Year and subdivided by Store Type.
Now, to complete the OLAP report creation process, the following steps will take you through the addition of a style, a chart, and the creation of the finished report:
- On the Style dialog, select any style that suits your preference and click the Next button.
- On the Chart dialog, select Pie Chart as the Chart Type by selecting the radio button associated with that chart type. This provides a nice way of visualizing comparables across different store types.
- Provide your chart with a title similar to Measures by Store Type and Year by entering this into the Chart Title text box.
- Select Store Type as the On Change Of field. This facilitates the comparison of the six different store types. Leave the Subdivided By drop-down field empty.
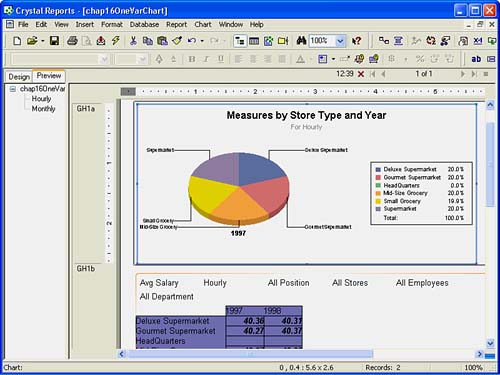
- Click Finish on the OLAP Report Creation Wizard. You will be prompted to select a parameter for the Measure dimension. After selecting Average Salary (or another field if you prefer), a report is generated that looks similar to Figure 16.12.
Figure 16.12. The sample OLAP report created using the OLAP Wizard.
The OLAP Report Creation Wizard provides an efficient and effective method to getting value out of OLAP data in a short timeframe. After an OLAP grid or OLAP chart has been placed on your report through the wizard, further formatting and analysis can be performed through a variety of built-in Crystal Reports formatting tools. The next two sections explore further customization options and the three subsequent sections discuss the powerful new interactivity available in Crystal Reports OLAP objects.
Customizing Styles in the OLAP Expert
After an OLAP grid has been added to a report, with or without a selected style, Crystal Reports provides the capability to enhance and customize the formatting of that grid through the Customize Style tab accessed on the OLAP Expert. The OLAP Expert dialog is displayed in Figure 16.13 and is accessed by right-clicking on an existing OLAP grid object and accessing the OLAP Grid Expert, or by selecting the Insert OLAP Grid option from the Insert menu.
Figure 16.13. The OLAP Expert dialog provides the capability to edit many of the OLAP Grid display properties including the customization of styles.
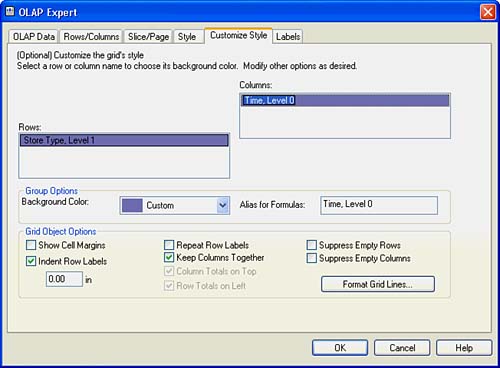
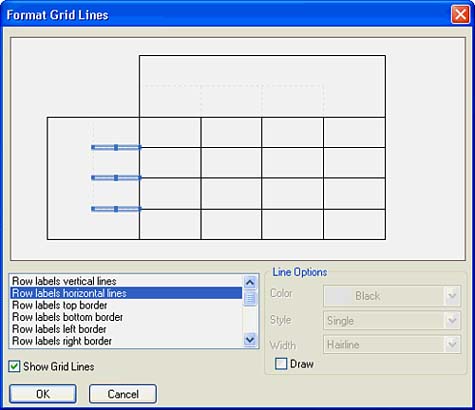
Four of the tabs in the OLAP Expert have identical functionality as presented in the previous Report Wizard sections. The Customize Style tab shown in Figure 16.13 is unique to the OLAP Expert and provides the capability to fine-tune the formatting of the row and column dimensions selected for the involved OLAP grid. By selecting any of the column or row dimensions from the presented list boxes, custom colors can be selected for the backgrounds of the OLAP grid row and column headings. This tab also provides a number of formatting options for the presentation of the grid including indentation, blank column/row suppression, margins, and labels. Also provided is an option to format grid lines, shown in Figure 16.14. This dialog enables granular level formatting and selection of grid lines for display on the OLAP grid's layout.
Figure 16.14. The Format Grid Lines dialog is accessed from the Customize Style Tab of the OLAP Expert dialog and enables granular level control of the OLAP grid's grid lines.
Customizing Labels in the OLAP Expert
The Labels tab of the OLAP expert, shown in Figure 16.15, provides the capability to customize the display of the paged-dimension (non row/column dimensions) labels on the OLAP grid.
Figure 16.15. The Labels tab of OLAP Expert enables you to specify display properties around the OLAP grid's dimensions.
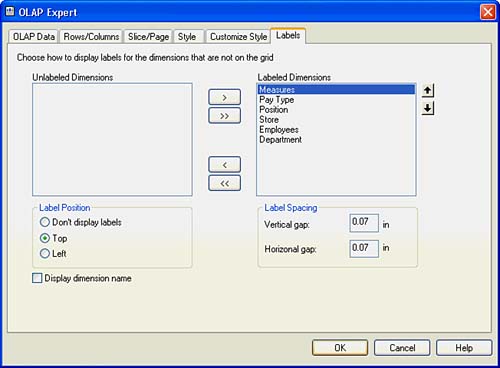
Paged/Sliced Dimension member values for the display grid can be displayed or hidden by simply moving the selected dimension between the unlabeled dimension and labeled dimension list boxes using the transfer arrow (>, >>, <, <<) buttons. Additional labeling optionssuch as label location, label spacing, and dimension namescan also be selected in this tab.
Part I. Crystal Reports Design
Creating and Designing Basic Reports
- Creating and Designing Basic Reports
- Introducing the Crystal Reports Designer
- Understanding Data and Data Sources
- Introduction to the Data Explorer
- Adding Database Objects to Your Report
- Joining Database Objects Together
- Understanding the Different Join Types
- Using the Report Creation Wizards
- Understanding the Crystal Reports Gallery
- Using the Standard Report Creation Wizard
- Creating a Report Without Wizards
- Troubleshooting
Selecting and Grouping Data
- Selecting and Grouping Data
- Introduction
- Understanding Field Objects
- Working with Groups
- Understanding Drill-down Reports
- Troubleshooting
Filtering, Sorting, and Summarizing Data
- Filtering, Sorting, and Summarizing Data
- Introduction
- Filtering the Data in Your Report
- Learning to Sort Records
- Working with the Sort Expert
- Creating Effective Summaries
- Troubleshooting
Understanding and Implementing Formulas
- Understanding and Implementing Formulas
- Introduction
- Using the Formula Workshop
- Using the Workshop Formula Editor
- Creating Formulas with the Formula Expert
- Using the Formula Extractor to Create Custom Functions
- The Multi-Pass Reporting Process of the Crystal Reports Engine
- Troubleshooting
Implementing Parameters for Dynamic Reporting
- Implementing Parameters for Dynamic Reporting
- Introduction
- Understanding the Value of Parameters
- Creating and Implementing Parameters Fields
- Using Parameters with Record Selections
Part II. Formatting Crystal Reports
Fundamentals of Report Formatting
- Fundamentals of Report Formatting
- Introduction
- Positioning and Sizing Report Objects
- Modifying Object Properties for Formatting Purposes
- Exploring the Format Editor Dialog Common Options
- Combining and Layering Report Objects
- Configuring Report Page and Margin Properties
Working with Report Sections
- Working with Report Sections
- Introduction
- Formatting Report Sections
- Modifying Report Section Properties
- Using Multiple Report Sections
- Troubleshooting
Visualizing Your Data with Charts and Maps
- Visualizing Your Data with Charts and Maps
- Introduction to Charts and Maps
- Using the Chart Expert
- Using the Map Expert
- Modifying Chart and Map Properties
- Troubleshooting
Custom Formatting Techniques
- Introduction
- Making Presentation-Quality Reports
- Common Formatting Features
- Conditional Formatting Using Data to Drive the Look of a Report
Part III. Advanced Crystal Reports Design
Using Cross-Tabs for Summarized Reporting
- Using Cross-Tabs for Summarized Reporting
- Introduction to Cross-Tabs
- Benefits of Cross-Tabs
- Using the Cross-Tab Wizard
- Using Top N with Cross-Tabs Reports
- Using Advanced Cross-Tab Features
Using Record Selections and Alerts for Interactive Reporting
- Using Record Selections and Alerts for Interactive Reporting
- Creating Advanced Record Selection Formulas
- Adding Alerting to Your Reports
- Performance Monitoring and Tuning
Using Subreports and Multi-Pass Reporting
- Using Subreports and Multi-Pass Reporting
- Understanding Subreports
- Understanding Linked Versus Unlinked Subreports
- Considering Subreport Execution Time and Performance
- Using Variables to Pass Data Between Reports
- Emulating Nested Subreports
- Troubleshooting
Using Formulas and Custom Functions
- Using Formulas and Custom Functions
- Becoming More Productive with Formulas
- Choosing a Formula Language: Crystal Versus Basic Syntax
- Using Brackets in Formulas
- Using Characters in Formulas
- Recent Improvements to Formulas
Designing Effective Report Templates
- Designing Effective Report Templates
- Understanding the Importance of Reuse in Reporting
- Understanding Report Templates
- Using Report Templates
- Using Existing Crystal Reports as Templates
- Understanding How Templates Work
- Creating Useful Report Templates
- Using Template Field Objects
- Using Report Templates to Reduce Report Creation Effort
- Applying Multiple Templates
Additional Data Sources for Crystal Reports
- Additional Data Sources for Crystal Reports
- Understanding the Additional Crystal Reports Data Sources
- Connecting to COM-based Data Sources
- Connecting to Java-based Data Sources
- Understanding Solution Kits for Crystal Enterprise
- Troubleshooting
Multidimensional Reporting Against OLAP Data with Crystal Reports
- Multidimensional Reporting Against OLAP Data with Crystal Reports
- Introduction to OLAP
- OLAP Concepts and OLAP Reporting
- Recently Added or Changed OLAP Features in Crystal Reports
- Using the OLAP Report Creation Wizard and OLAP Expert
- Advanced OLAP Reporting
- Introduction to Crystal Analysis
Part IV. Enterprise Report Design Analytic, Web-based, and Excel Report Design
Introduction to Crystal Repository
- Introduction to Crystal Repository
- What Is the Crystal Repository?
- Why Implement the Crystal Repository?
- Installing the Crystal Repository
- Adding Objects to and from the Repository
- Migration of the Crystal Enterprise Repository
- Troubleshooting
Crystal Reports Semantic Layer Business Views
- Crystal Reports Semantic Layer Business Views
- Introduction to Business Views
- Why Implement Business Views?
- Performance and Implementation Considerations
- Business Views Architecture and Implementation
- Troubleshooting
Creating Crystal Analysis Reports
- Creating Crystal Analysis Reports
- Introduction
- Introducing Crystal Analysis
- Accessing OLAP Data with Crystal Analysis
- Designing Crystal Analysis Reports and Applications
- Adding Crystal Analysis Objects to a Report
- Troubleshooting
Advanced Crystal Analysis Report Design
- Advanced Crystal Analysis Report Design
- Introduction
- Advanced Crystal Analysis Designer Tools
- Custom Calculations and Advanced Data Analysis
- Setting Report Options
- Troubleshooting
- Crystal Analysis in the Real World MDX
Ad-Hoc Application and Excel Plug-in for Ad-Hoc and Analytic Reporting
- Ad-Hoc Application and Excel Plug-in for Ad-Hoc and Analytic Reporting
- Introducing Ad-Hoc Reporting Conceptually
- Introducing the Crystal Enterprise Ad-Hoc Reporting Application
- Crystal Reports Excel Plug-in
- Crystal Analysis Excel Plug-in
Part V. Web Report Distribution Using Crystal Enterprise
Introduction to Crystal Enterprise
- Introduction to Crystal Enterprise
- What Is Crystal Enterprise?
- Why Implement a Crystal Enterprise Solution?
- Versions of Crystal Enterprise
- Understanding the Core Functions of Crystal Enterprise
Using Crystal Enterprise with Web Desktop
- Using Crystal Enterprise with Web Desktop
- Introduction
- Crystal Enterprise User Launchpad
- Crystal Enterprise Web Desktop
- Customizing the Web Desktop and Report Viewers
- Publishing to the Web Desktop
- Customizing the Web Desktop
- Troubleshooting
Crystal Enterprise Architecture
- Crystal Enterprise Architecture
- Introduction
- Crystal Enterprise Architecture Overview
- The Client Tier
- The Application Tier
- The Server Tier: Introduction to the Crystal Enterprise Framework
- The Server Tier: Overview of the Crystal Enterprise Services
- The Data Tier
- The Crystal Enterprise Architecture in Action
- Taking Advantage of the Crystal Enterprise Distributed Architecture
- Extending Crystal Enterprise
Planning Considerations When Deploying Crystal Enterprise
- Planning Considerations When Deploying Crystal Enterprise
- Ensuring a Successful Crystal Enterprise Implementation
- Approaching the Project
- Identifying Business Pain
- Establishing Project Requirements
- Understanding Organizational Reporting Requirements
- Troubleshooting
Deploying Crystal Enterprise in a Complex Network Environment
- Deploying Crystal Enterprise in a Complex Network Environment
- Introduction
- Understanding Network Protocols
- Understanding Firewall Types
- Configuring the Crystal Enterprise Architecture for Your Network Environment
- Interaction Between the WCS and the WC
- Deploying Crystal Enterprise with an IP Packet Filtering Firewall
- Using Crystal Enterprise with NAT
- Exploring the NAT and Crystal Enterprise Relationship
- Crystal Enterprise and Proxy Servers
Administering and Configuring Crystal Enterprise
- Introduction
- Using the Crystal Management Console
- Managing Accounts
- Managing Content
- Introducing Servers
- Managing Crystal Enterprise System Settings
- Using the Crystal Configuration Manager
Part VI. Customized Report Distribution Using Crystal Reports Components
Java Reporting Components
- Java Reporting Components
- Overview of the Crystal Reports Java Reporting Component
- Understanding the Java Reporting Components Architecture
- Differences with the Java Reporting Engine
- Configuring the Application Server
- Delivering Reports in Web Applications
- Using the Crystal Tag Libraries
- Exporting Reports to Other File Formats
- Printing Reports from the Browser
- Common Programming Tasks
- Troubleshooting
Crystal Reports .NET Components
- Crystal Reports .NET Components
- Understanding Microsofts .NET Platform
- Understanding the Different Crystal .NET Components
- An Overview of the Crystal Reports 10 .NET Components
- The Report Designer
- The Report Engine Object Model
- Delivering Reports with the Windows Forms Viewer
- Delivering Reports with the Web Forms Viewer
- Database Credentials
- Setting Parameters
- Troubleshooting
COM Reporting Components
- COM Reporting Components
- Understanding the Report Designer Component
- Building Reports with the Visual Basic Report Designer
- Programming with the Report Engine Object Model
- Delivering Reports Using the Report Viewer
- Troubleshooting
Part VII. Customized Report Distribution Using Crystal Enterprise Embedded Edition
Introduction to Crystal Enterprise Embedded Edition
- Introduction to Crystal Enterprise Embedded Edition
- Introduction to Crystal Enterprise Embedded Edition
- Understanding Crystal Enterprise Embedded Edition
- Crystal Enterprise Embedded Edition Samples
- DHTML Report Design Wizard
- Troubleshooting
Crystal Enterprise Viewing Reports
- Crystal Enterprise Viewing Reports
- Viewing Reports over the Web
- Introduction to the Crystal Report Viewers
- Understanding the Report Source
- Implementing the Page Viewer
- Implementing the Part Viewer
- Implementing the Interactive Viewer
- Implementing the Grid Viewer
- Troubleshooting
Crystal Enterprise Embedded Report Modification and Creation
- Introduction
- Deploying RAS Environments
- Loading Report Files
- Locating RAS Components in a Network Architecture
- Installing the RAS SDK
- Best Practices in RAS Exception Handling
- The RAS SDK in Action
Part VIII. Customized Report Distribution Using Crystal Enterprise Professional
Introduction to the Crystal Enterprise Professional Object Model
- Introduction to the Crystal Enterprise Professional Object Model
- Understanding the Crystal Enterprise Object Model
- Establishing a Crystal Enterprise Session
- Querying the Crystal Enterprise Repository
- Viewing Reports
- The Crystal Enterprise Java SDK
- Accessing the Java SDK
- Troubleshooting
Creating Enterprise Reports Applications with Crystal Enterprise Part I
- Creating Enterprise Reports Applications with Crystal Enterprise Part I
- Advanced Scenarios with the Crystal Enterprise Object Model
- Scheduling Reports
- Scheduling to a Destination
- Using Crystal Enterprise Notifications
- Scheduling to a Server Group
- Scheduling to a Specific Format
- Setting Database Credentials
- Troubleshooting
Creating Enterprise Reporting Applications with Crystal Enterprise Part II
- Creating Enterprise Reporting Applications with Crystal Enterprise Part II
- Querying the Crystal Enterprise InfoStore
- Creating and Responding to Crystal Enterprise Alerts
- Creating Schedulable Program Objects
- Troubleshooting
Appendix A. Using Sql Queries In Crystal Reports
Creating Enterprise Reporting Applications with Crystal Enterprise Part II
EAN: 2147483647
Pages: 341
