Printing an AutoCAD Drawing
Printing anAutoCAD Drawing
Overview
- Setting up a drawing to be printed
- Using the Plot dialog box
- Assigning lineweights to layers in your drawing
- Selecting the part of your drawing to print
- Previewing a print
- Printing a layout
- Looking at plot styles
First of all, with today’s equipment, there is no difference between printing and plotting. Printing used to refer to smaller-format printers, and plotting used to refer to pen plotters, most of which were for plotting large sheets. But the terms are now used almost interchangeably. Pen plotters have a few extra settings that other printing devices do not have. Otherwise, as far as AutoCAD is concerned, the differences between plotters and laserjet, inkjet, dot-matrix, and electrostatic printers are minimal. So in this book, printing and plotting mean the same thing.
Getting your drawing onto paper can be very easy or very hard, depending on whether your computer is connected to a printer that has been set up to print AutoCAD drawings and depending on whether AutoCAD has been configured to work with your printer. If these initial conditions are met, you can handily manage printing with the tools you will learn in this chapter. If you do not have the initial setup, you will need to get some help either to set up your system to make AutoCAD work properly with your printer or to find out how your system is already set up to print AutoCAD drawings.
We will be using a couple of standard setup configurations between AutoCAD and printers to move through the exercises. You may or may not be able to follow each step to completion, depending on whether you have access to an 8.5" x 11" laserjet or inkjet printer, a larger-format printer, or both.
We have four drawings to print:
Cabin11aA drawing with Model Space only, to be printed on an 81⁄2" x 11" sheet at 1⁄8" scale
Cabin13aThe same drawing as Cabin11a, except with the title block and border on Layout1, to be printed from Layout1 on an 81⁄2" x 11" sheet at a scale of 1:1
Cabin13bThe 11" x 17" drawing, to be printed on an 11" x 17" sheet from a layout
Site13To be printed on a 30" x 42" sheet from a layout
Even if your printer won’t let you print in all these formats, I suggest that you follow along with the text. You’ll at least get to preview how your drawing would look if printed in these formats, and you will be taking large strides toward learning how to set up and run a print for your drawing. The purpose of this chapter is to give you the basic principles for printing whether or not you have access to a printer.
The Plot Dialog Box
The job of getting your AutoCAD file onto hard copy can be broken into five tasks. You will need to tell AutoCAD the following:
- The printing device you will use
- The lineweight assigned to each object in your drawing
- The portion of your drawing you are printing
- The sheet size you are printing
- The scale, orientation, and placement of the print on the sheet
You handle most of these tasks in the Plot dialog box.
- Open Cabin11a. Zoom to Extents, and then zoom out a little (see Figure 14.1). This drawing is not quite ready to print.
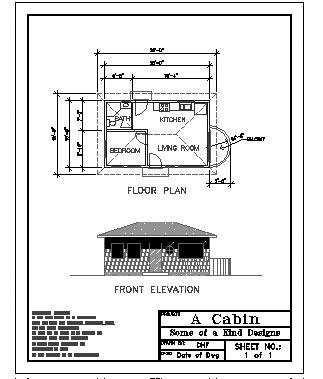
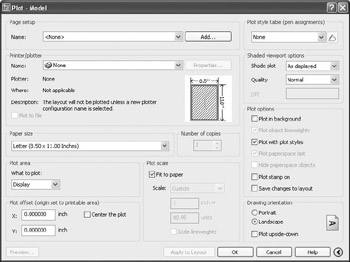
Figure 14.1: Cabin11a zoomed to Extents and then zoomed out a little - Click the Plot button on the Standard toolbar to open the Plot dialog box. The title bar includes “Model” because, in this case, we are printing a drawing from Model Space. Later, when we print from Layouts, the title bar displays the name of the layout. This dialog box is similar to the Page Setup dialog box that you worked with in Chapter 13 when you were setting up layouts (see Figure 14.2). But there are some differences:
You can also open the Plot dialog box by choosing File Plot, by pressing Ctrl+P, or by typing plot or print.
- It’s smaller, but you can expand it to include four more areas of information and settings on the right side. Yours might come up in expanded form.
- It has an additional area called Number of Copies.
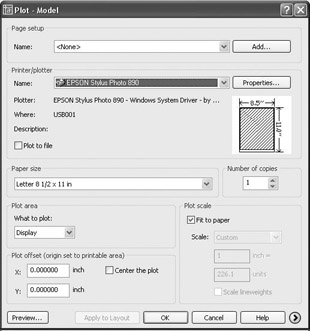
Figure 14.2: The Plot dialog box
When we get to the point in this chapter where we are printing layouts, you’ll find that much of the setup work has already been done. But before we do, let’s take a quick tour of this dialog box. Then we’ll start setting up to print.
There are seven areas of settings on this unexpanded version of the dialog box. Some of the buttons and boxes won’t be activated. I’ll mention others only in passing, because their functions are for more advanced techniques than those covered in this book. I’ll save discussion of the Page Setup area at the top of the dialog box until we begin printing drawings with layouts.
Printer Plotter
In this area, the Name drop-down list contains the various printing devices to which AutoCAD has been configured, with the current one, the EPSON Stylus Photo 890, displayed in Figure 14.2. Yours might say None or display a different printer. Just below the list, the name of the driver and port are displayed for the selected printer. Clicking the Properties button to the right opens the Plotter Configuration Editor dialog box, which has three tabs of data specific for the current printer. Most of these will already be set up by your Windows operating system. Back in the Plot dialog box, the Plot To File check box, when selected, directs AutoCAD to make and save the print as a .plt file, rather than sending it to a printer.
Paper Size and Number of Copies
In the Paper Size area, the Paper Size drop-down list contains paper sizes that the current plot device can handle. To the right is the Number Of Copies area, which is self-explanatory.
The Plot Area
In the Plot Area area, a drop-down list contains the options for specifying what to print in your drawing. We have already decided which layers will be visible when the print is made by freezing or turning off the layers whose objects we don’t want to print. Now we must decide how to designate the area of the drawing to be printed. As we go through the options, it will be useful to think about the choices with regard to two printing possibilities: printing the whole drawing and printing just the floor plan.
To illustrate how these options work, we will make a couple of assumptions. First, the Fit To Paper check box is selected in the Plot Scale area, so AutoCAD will try to fill the sheet with the drawing. Second, the drawing will be in portrait orientation.
The Display Option
The Display option will print what’s currently on the screen, including the blank area around the drawing. With both drawing and sheet in portrait orientation, and with the origin in the lower-left corner of the sheet, the plot would look like Figure 14.3. The dashed lines represent the edge of what was the drawing area on the screen. (You won’t see the dashed line in your own drawing; it was put in to illustrate the point.) The drawing doesn’t fit well on the sheet with this option.
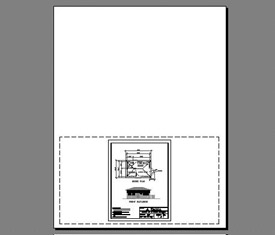
Figure 14.3: The Cabin11a drawing printed to Display
It’s oriented correctly, but it’s forced to be too small on the sheet. The blank space in the drawing area on the left and right of the print is brought into the print with this option, and that’s what creates the misfit. Printing to Display is a good method if the drawing is in landscape orientation, if it is proportional in size to the drawing area, and if the printer is also set to landscape orientation.
The Extents Option
When you select the Extents option, AutoCAD tries to fill the sheet with all visible objects in the drawing. If you print Cabin11a using the Extents method of selecting what to print, the results will look like Figure 14.4. This is a good method to use if the border has been drawn with the same proportions as the printable area of the sheet. It was in this case because you offset a rectangle that represented the sheet to make the border, but the rectangle that represented the sheet was also printed, and we didn’t want that. You would have to erase the outer rectangle before printing to Extents.
You can use the Preview option to view how the drawing will print for Extents and the three following printing options.
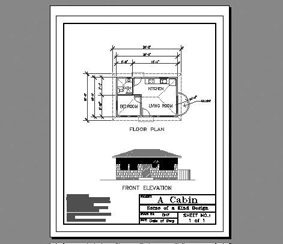
Figure 14.4: The Cabin11a drawing printed to Extents
The Limits Option
Do you remember the drawing limits for the cabin drawing that you set in Chapter 3? As a refresher, perform the following steps:
- Click Cancel to cancel the plot.
- Click the Grid button on the status bar to make the grid visible. It’s still there, around the floor plan, just as you first set it in Chapter 3 (see Figure 14.5a). When you print to Limits, AutoCAD prints only what lies within the limits (or, in another way of saying it, what’s on the grid), and it will push what’s within the limits to the corner that is the origin of the print.
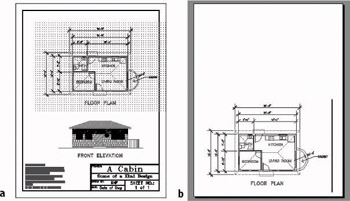
Figure 14.5: The grid showing the limits of Cabin11a (a), and a preview of the drawing printed to Limits (b) - Click the Plot button again, and make the Plot Settings tab active. In the Plot dialog box, click Limits in the Plot Area area, and be sure Portrait is selected in the Drawing Orientation area. Then click the Preview button in the lower-left corner (see Figure 14.5b). This print won’t work here because the limits don’t cover the entire drawing. Also, the limits are in Landscape orientation, so the portion of the drawing to be printed doesn’t fit properly on the paper. Printing to Limits can be a good tool for setting up a print, but you will usually reset the limits from their original defining coordinates to new ones for the actual print.
- Right-click and choose Exit from the shortcut menu to exit the preview. Cancel the plot, and then press F7 to turn off the grid.
If Layouts have been set up for a .dwg file, the Limits option will be replaced by Layout in the What To Print drop-down list in the Plot Area area.
The View Option
When printing to View, you tell AutoCAD to print a previously defined view that was saved with the drawing. Right now, the View option is not displayed in the What To Plot drop-down list because we haven’t defined and saved any views yet.
We’ll save a view, and then we’ll see what the print looks like.
- If the Plot dialog box is still on the screen, cancel it. Choose View Named Views to open the View dialog box.
- Click the New button to open the New View dialog box, and type plot1.
- Click the Define Window radio button.
- Back in the drawing, make a window around the left half of the floor plan, not including the dimensions, as shown in Figure 14.6a.
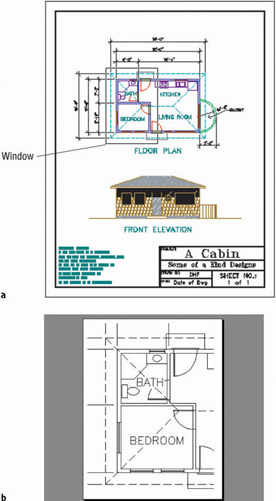
Figure 14.6: Using a window to define a view (a), and the print to this view (b) - Click OK to close the New View dialog box. The saved view, called plot1, is listed in the Views list box of the View dialog box.
- Click OK. Then click the Plot button and continue reading along.
Now, to plot the plot1 view of this drawing, open the What To Plot drop-down list in the Plot Area area of the Plot dialog box and click View. Then move to the right and select plot1 from the drop-down list of saved views. At the settings for scale and orientation that we have been using, the print will look like Figure 14.6b. The View option for What To Plot is a valuable tool for setting up partial prints of a drawing.
The Window Option
Using a window to define the area of a plot is the most flexible of the five methods being described. It’s like using a zoom window in the drawing. When you select this option, you are returned to your drawing. In your drawing, make a window around the area you want to print. When you return to the Plot dialog box, a Window button is displayed in the right side of the Plot Area area (see Figure 14.7), in case you need to redo the window.
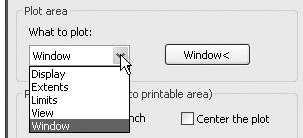
Figure 14.7: The Plot Area area in the Plot dialog box with its drop-down list open and the Window button displayed next to it
AutoCAD will print only what is in the window you made, regardless of how it fits on the sheet. This method is similar to the View method just discussed. The difference is that the View method prints a previously defined view (one that was possibly defined by a window, but could also be defined in other ways), and the Window method prints what is included in a window that you define as you are setting up the plot. The window used by the Window method can’t be saved and recalled at a later time.
These are the five ways to specify what to print. We’ll use the Window option in the first exercise that follows.
Plot Scale
Moving to the right, we come to the Plot Scale area, where you control the scale of the plot. When the Fit To Paper check box is selected, AutoCAD will take whatever area you have chosen to print and automatically scale it so that it will fit on the selected page size. When it is unchecked, the Scale drop-down list becomes available. This list contains 32 preset scales to choose from, plus Custom. Some of the scales in the list are displayed as pure ratios, such as 1:50. Others are shown in their standard format, such as 1⁄4" = 1'-0". Below the drop-down list is a pair of text boxes for setting up a custom scale. When you choose a preset scale, these text boxes display the true ratio of the current scale.
To set up a custom scale, you enter a plotted distance in the Inch = text box. Then, in the Units text box, enter the distance that, in your drawing, will be represented by the distance that you entered in the Inches text box. The inches distance will be an actual distance on the plotted drawing, and the units distance is the distance the plotted units represent. For 1⁄4" scale (1⁄4" = 1'-0"), you could enter several combinations:
|
Inch = |
Units |
|---|---|
|
1' |
|
|
1 |
4' |
|
1 |
48 |
Layouts are plotted at a scale of 1:1. We’ll come back to this and other scale issues as we prepare a drawing for printing.
Plot Offset and Plot Options
Below the Plot Area area is the Plot Offset (Origin Set To Printable Area) area, which contains two text boxes and a check box. Place a check mark in the Center The Plot box to center the plot on the printed sheet. If this check box is not selected, by default, AutoCAD will place the lower-left corner (or the origin) of the area you have specified to plot at the lower-left corner (or origin) of the printable area of the current paper size. By changing the settings in the X and Y text boxes, you can move the drawing horizontally or vertically to fit on the page as you wish. When the Center The Plot check box is selected, the X and Y text boxes display any movement from the lower-left corner of the sheet that was necessary to center the drawing.
Just as each drawing has an origin (0,0 point), each plotter creates an origin for the plot. Usually it’s in the lower-left or upper-left corner, but not always. When the plot is being made, the printer first locates the origin and starts the print there, moving outward from the origin. If the origin is in the lower-left corner, the print may come out looking like Figure 14.8a. If the origin is the upper-left corner, the print will look like Figure 14.8b.
By using the X and Y settings in the Plot Offset area, you can make one margin wider for a binding. To center your drawing on the page, place a check mark in the Center The Plot box (see Figure 14.8c). If Layouts are set up and being use for printing, they determine this setting, and the Center The Plot check box is unavailable.
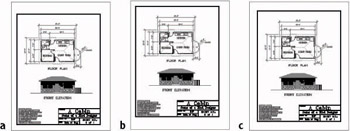
Figure 14.8: A print with its origin in the lower-left corner (a), in the upper-left corner (b), and with the drawing centered (c)
| Tip |
Usually, 8.5" x 11" format printers are configured to the portrait orientation. If your drawing is also set to that orientation, the origin of the plot will be in the lower-left corner. If your drawing is in the landscape orientation, the plot origin will move to the upper-left corner of the page because the plot has been rotated to fit on the page. |
Setting the material to be printed accurately on the page will be a result of trial and error and getting to know your printer. We will return to this topic shortly, when we get ready to print.
The Expanded Plot Dialog Box
If the Plot dialog box hasn’t already been expanded, click the right-pointed arrow in the lower-right corner to expand it to include four additional areas. For now, we are concerned only about the one on the bottom.
Drawing OrientationThe settings in this area are self-explanatory. The radio buttons serve as a toggle between the portrait and landscape orientation, and the Plot Upside-Down check box serves as an on/off toggle.
Plot OptionsThis area has six check boxes that don’t concern us now.
Shaded Viewport OptionsThis area has settings to control the plot for renderings and shaded views, which will be covered in the Appendix.
Plot Style Table (Pen Assignments)Plot styles and pen assignments will be discussed later in this chapter.
We have taken a quick tour of the Plot dialog box, and we still have a drawing, Cabin11a, to print. Let’s print it. As we set up the print, refer to this section for explanation of the steps, if necessary.
Printing a Drawing
Our task is to print Cabin11a.dwg at a scale of 1⁄8" = 1'-0" for an 8.5" x 11"–format inkjet printer. In this exercise, we will use the default system printer, which is set up for an 8.5" x 11"–format laserjet printer. If you have an 8.5" x 11"–format printer, you should be able to follow the steps. If you don’t have a printer, you can still get familiar with printing by following along with the steps.
The first step is to assign lineweights to the visible layers.
Determining Lineweights for a Drawing
Look at the Cabin11a drawing as a whole. We need to decide on weights for the various lines. The floor plan is drawn as if a cut were made horizontally through the building just below the tops of the window and door openings. Everything that was cut will be given a heavy line. Objects above and below the cut will be given progressively lighter lines, depending on how far above or below the cut the objects are located.
In this system, the walls, windows, and doors will be heaviest. The roof, headers, fixtures, and steps will be lighter. For emphasis, we’ll make the walls a little heavier than the windows and doors. In the front elevation, the hatch pattern will be very light, and the outline of the various components will be heavier, for emphasis. Text and the title block information will use the default lineweight. These are general guidelines; weights will vary with each drawing.
| Note |
Lineweight standards vary for each trade and profession that uses AutoCAD. Details usually follow a system that is independent from the one used by other drawings in the same set. Section lines, hidden lines, center lines, cutting plane lines, break lines, and so on all will be assigned specific lineweights. |
We will use four lineweights for this drawing:
|
Weight |
Thickness In Inches |
|---|---|
|
Very light |
0.005 |
|
Light |
0.008 |
|
Medium |
0.010 |
|
Heavy |
0.014 |
In Cabin11a, 15 layers are visible in the drawing as it is currently set up. Their lineweights will be assigned as follows:
|
Layer |
Lineweight |
|---|---|
|
Balcony |
Light |
|
Dim1 |
Very light |
|
Doors |
Medium |
|
F-elev |
Medium |
|
Fixtures |
Light |
|
Hatch-elev-42 |
Very light |
|
Hatch-elev-black |
Very light |
|
Hatch-elev-gray |
Very light |
|
Headers |
Light |
|
Roof |
Very light |
|
Steps |
Light |
|
Tblk1 |
Medium |
|
Text1 |
Medium |
|
Walls |
Heavy |
|
Windows |
Medium |
When we look at the lineweights currently assigned to these layers, and at the thickness we need these lineweights to be, we can generate a third chart that will show us what lineweight needs to be assigned to each group of layers:
|
Thickness |
Layers |
|---|---|
|
0.005 |
Dim1, all visible hatch layers, Roof |
|
0.008 |
Balcony, Fixtures, Headers, Steps |
|
0.010 (default) |
Doors, F-elev,Tblk1,Text, Windows |
|
0.014 |
Walls |
Now it’s time to assign the lineweights to the layers in the drawings.
- Click Cancel to close the Plot dialog box. Then click the Layer Properties Manager button on the Object Property toolbar to open the Layer Properties Manager dialog box.
- Click the Dim1 layer to highlight it. Hold down the Ctrl key and click the three Hatch-elev layers and the Roof layer to select them. Then release the Ctrl key.
- In the Lineweight column, click one of the highlighted Default words to open the Lineweight dialog box.
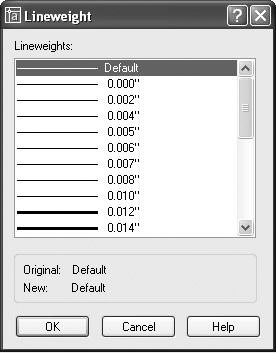
Note If the lineweights listed in the Lineweight dialog box are in millimeters, cancel to get back to your drawing and type lw. Then, in the Lineweight Settings dialog box, click the Inches radio button in the Units For Listing area and click OK.
- Click 0.005". Then click OK. The Lineweight dialog box closes. In the Layer Properties Manager dialog box, the five highlighted layers now have a lineweight of 0.005" assigned to them.
- Click the Balcony layer near the layer’s name.
- Hold down the Ctrl key and click Fixtures, Headers, and Steps.
- Click one of the highlighted Default words. The Lineweight dialog box opens.
- Click 0.008". Then click OK. The newly highlighted layers now have a lineweight of 0.008" assigned to them.
- You can leave Default as the linetype for the Doors, Windows, and Text1 layers because the thickness they need is the default thickness of 0.010". Click the Walls layer, and use the same procedure to assign it the thickness of 0.014".
- Click OK to close the Layer Properties Manager dialog box.
- Type lw to open the Lineweight Settings dialog box.
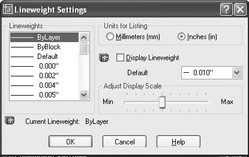
Notice the Default drop-down list on the right, in which 0.010" is displayed. This tells you that the default lineweight thickness is 0.010", which is what we are assuming.
- Click Cancel to close the dialog box.
The lineweights have been assigned. When the print is complete, you can judge whether these lineweight assignments are acceptable or need to be adjusted. In an office, a lot of time is invested in developing a lineweight standard that can be used in most drawings.
Other Properties of Layers
Two other properties of layers deserve mentioning: Plot and Description. Both are displayed in the Layer List window of the Layer Properties Manager dialog box.
The Plot feature is a two-way toggle that controls whether the objects on a layer are printed. By default, the control is off. When this features is activated for a particular layer, objects on that layer are not printed but remain visible on your screen. You might designate a layer for in-house notes and data that you do not intend to be seen by those who will eventually view your printed drawings, and then set the layer to not be printed.
A column titled Description is at the far right of the Layer List window. Clicking in this column on the blue bar of a highlighted layer opens a text box in which you can enter a description of the layer. Layer names are often in code or use abbreviations that do not fully describe what objects are on that layer. Here’s a place to do that.
Setting Up the Other Parameters for the Print
Now that we have set the lineweights, it’s time to move to the Plot dialog box and complete the setting changes we need to make in order to print this drawing. We will use the Window option to select what we will print.
- Click the Plot button on the Standard toolbar.
- In the Plot dialog box, check the Printer/Plotter area to be sure you have the correct printer displayed in the drop-down list. Check the Paper Size area to be sure you have Letter (8.5 x 11) as the selected paper size. Then move down to the Plot Area area, open the What To Plot drop-down list, and select Window.
- In the drawing, disable any running Osnaps. To start the window, pick a point outside the border, as close to the lower-left corner of the border as you can without touching it.
- To complete the window, click a point above and to the right of the border, also as close to the border as you can without touching it. Back in the Plot dialog box, Window will be displayed in the What To Plot drop-down list, and a new Window button is now on the right side of the Plot Area area. Click this button if you need to redo the window after viewing a preview of the plot.
- If you have not already done so, click the right-pointing arrow in the lower-right corner of the Plot dialog box to display another column of areas. In the Drawing Orientation area in the lower-right corner, be sure Portrait is selected.
- In the Plot Scale area, uncheck Fit To Paper, open the Scale drop-down list, and select 1⁄8" = 1'0". Notice that the text boxes below now read 1 and 96, the scale factor for 1⁄8" scale.
- In the Plot Offset area, click the Center The Plot check box.
This completes the setup for the first plot. Before we waste paper, let’s preview how it will look as a result of our setup changes.
Previewing a Print
The Preview feature gives you the opportunity to view your drawing exactly as it will print.
- Click the Preview button. The computer takes a moment to calculate the plot and then displays a full view of your drawing as it will fit on the page (see Figure 14.9).
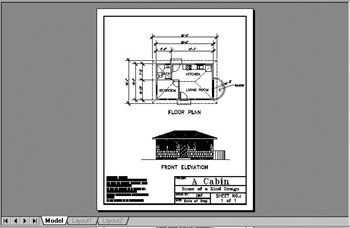
Figure 14.9: The preview of Cabin11a, ready to print - Right-click and choose Zoom Window from the shortcut menu.
- Make a window that encloses the bathroom and a couple of the dimensions. You have to left-click and hold down the mouse button, drag open the window, and then release. The new view displays the lineweights you have set up (see Figure 14.10).
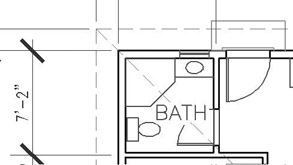
Figure 14.10: The zoomed-in view of Cabin11a showing the lineweights - Right-click and choose Zoom Original from the shortcut menu to return to the first preview view.
- Right-click again and choose Exit to return to the Plot dialog box. If your print was oriented correctly on the sheet, you are ready to print. If not, recheck the setup steps for errors.
- At the bottom of the Plot dialog box, click the Apply To Layout button, then click OK. The computer will begin calculating the print and eventually send it to the printer.
- After the print is done, save this drawing as Cabin14a.
Note You can change a setting in the Lineweight Settings dialog box to be able to see lineweights in your drawing before you preview a plot, but they are not very accurate unless you are using layouts. When you print from Model Space, you have to preview the drawing in the Plot dialog box to see how the lineweights display.
When your print comes out, it should look like Figure 14.9 (shown earlier). Take a close look at the border. Is the space outside the border equal on the left and right and top and bottom? It should be, if you put a check mark in the Center The Plot box. If not, or if you need to widen one of the margins to make room for a binding, go to the Plot Offset area of the Plot dialog box and uncheck the Center The Plot box. Then change the settings for X and Y.
Just be sure that you don’t move the drawing to a point where one of the border lines gets lopped off. It takes a little trial and error. The Preview features will help you. Figure 14.11 illustrates what you will see in the Preview window when you try to print Cabin11a with the landscape orientation.
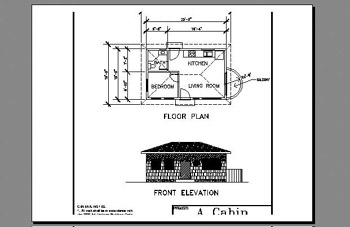
Figure 14.11: Preview of Cabin11a set up to be printed in the wrong orientation
Check the lineweights of the various components on the print. You may have to make adjustments for your particular printer.
Next you’ll plot a similar drawing that uses layouts for its border and title block.
Printing a Drawing Using Layouts
As a comparison to the previous exercise, we’ll print a drawing that has a layout set up. When a Layout tab has been set up properly and is active, you print at a scale of 1:1. The elements of the drawing on the layout are then printed actual size, and the Model Space portion of the drawing is printed at the scale to which the viewport has been set.
- Open Cabin13b. Be sure the Layout1 tab is active. Check the status bar to be sure that the Paper/Model button is set to Paper. This drawing is similar to Cabin11a. The only difference in appearance is that this one displays the dashed lines just outside the border, and the sheet is resting on the gray background with a shadowing effect, similar to how a Preview appears (see Figure 14.12). These differences are the result of this drawing having a layout that contains the title block and border, with a viewport through which the model of the cabin is seen. The viewport is on a layer that’s been frozen, so you can’t see its border. (For a review of layouts and viewports, see Chapter 13.)
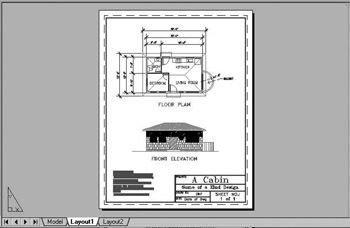
Figure 14.12: The Cabin13b drawing ready for printing - Open the Layer Properties Manager dialog box, and set the lineweights for the layers as you did for Cabin11a. Then click OK.
The Tblk1 layer in Cabin11a is replaced in this drawing by the Tblk-L1 layer.
- Start the Plot command to open the Plot dialog box. All the parameters you set for the last print will still be in effect (if you actually executed the print), so you have to determine what settings need to be changed to accommodate Paper Space.
- We are using the same printer, paper size, and orientation as before, so those stay the same.
- Notice that in the Plot Area area the top radio button is labeled Layout instead of Limits. Layout is also the active button. AutoCAD has sensed that this drawing has layouts set up and made this change automatically.
- In the Plot Scale area, the scale has been set to 1:1. This is what we want.
- In the Plot Offset area, the Center The Plot check box is grayed out; it is not needed when using a layout to plot.
- There are no changes to make. Because Layout1 has been set up for printing when it was created, all the settings in the Plot dialog box are automatically taken care of.
- In the lower-left corner, select Preview. Your preview should look like Figure 14.9, shown earlier in this chapter.
- Right-click and close the dialog box. Click OK to start the print. If you don’t have a printer, or if you are just following along, click Cancel to cancel the print at this point.
This exercise was intended to show you that once a layout has been created, most of the setup work for printing is already done for you. This greatly simplifies the printing process because the parameters of the print are determined before the Print command begins.
Printing a Drawing with Multiple Viewports
Multiple viewports in a layout don’t require any special handling. The print will be made with the layout active at a scale of 1:1. For the next print, you will use a different printer—one that can handle larger sheet sizes. If you don’t have access to a large-format printer, you can still configure AutoCAD for one and preview how the print would look. In fact, that’s what we did in Chapter 13, in order to set up Layout2, so this task is already completed.
Printing with a Large-Format Printer
The procedure here varies little from the one you just followed to print Layout1.
- Save the current drawing to your training folder as Cabin14b, but don’t close it yet.
- This drawing has two Layout tabs. We just printed Layout1. Layout2 consists of an 11" x 17" drawing in landscape orientation. You’ll print this one, so be sure Layout2 is active (see Figure 14.13).
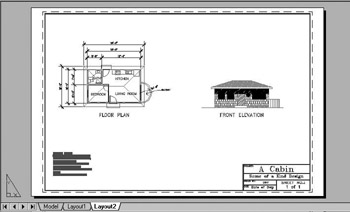
Figure 14.13: Cabin13b with the Layout2 tab active - Check the Layer Properties Manager dialog box to see that the lineweight assignments you made for Layout1 are still there.
- Click the Plot button on the Standard toolbar to start the Plot command.
- In the Plot dialog box, look in the Printer/Plotter and Paper Size areas. The plot device is now listed as DWF6 ePlot.pc3 or that of your own large-format plotter. Also, the paper size has been set for 11 x 17. This was all done when you set up Layout2 in the previous chapter.
- Note the orientation of the drawing. It’s now landscape.
- In the rest of the dialog box, the settings are the same as they were for Layout1. There are no changes to be made. Again, by setting up a layout, all parameters for printing are done in advance.
- Click the Preview button. The preview looks fine (see Figure 14.14).
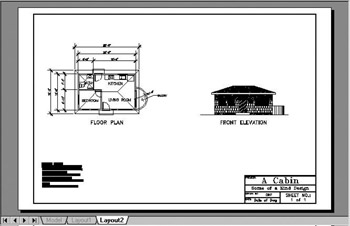
Figure 14.14: Preview of the Layout2 tabNote The DWF6 ePlot.pc3 printer that we have been using for a large-format plotter is set up to plot to a file that can later be posted on a website. If you tell AutoCAD to plot when this is the selected printer, AutoCAD displays a Select File Type dialog box called Browse For Plot File to specify the location and name of the new web plot file (.dwf extension).
- Right-click and choose Exit from the shortcut menu to cancel the preview. If you have a large-format printer configured and can plot this drawing on an 11" x 17" sheet, click OK to start the print. Otherwise, click Cancel.
- Resave this drawing as Cabin14b.
For the last exercise in this chapter, you will set up a print for Site13, using the large-format printer.
Printing the Site Plan
The site plan was also set up with a layout and based on a 30" x 42" sheet in landscape orientation. As in the last two prints, we shouldn’t have to do much to print this drawing. Follow along even if you can’t make the print.
- Open Site13. The Layout1 tab should be active. If it’s not, click it to activate it.
- Type lw. In the Lineweight Settings dialog box, put a check mark in the Display Lineweight box and click OK.
- Open the Layer Properties Manager dialog box and assign to the Prop_line layer a lineweight of 0.055. Click OK to close the dialog box. Click OK again.
- While in Paper Space, zoom in to a view of the place where the driveway meets the property line. Include the top borderline in the view to see the contrast in lineweights (see Figure 14.15). The borderline has a thickness because it is a polyline assigned a width of 1⁄16", or 0.0625.
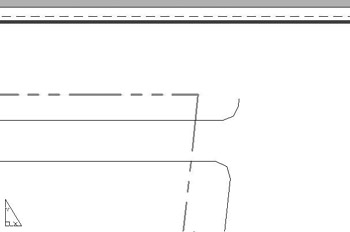
Figure 14.15: Zooming in to check the lineweights - Zoom Previous, and then start the Plot command to open the Plot dialog box. There are no changes that need to be made.
- Click Preview. You see how the print sits on the sheet. We want the margins to be the same on the top and bottom, and we want the right margin to be as small as possible so that there is extra room on the left side for the binding strip.
- Right-click and choose Exit from the shortcut menu to return to the Plot dialog box. In the Plot Offset area, change the X setting from 0.00 to 0.15.
- Click Preview again. The drawing is positioned fairly well, but the right margin may be partially lopped off (see Figure 14.16a).
- Right-click, choose Zoom Window, and then click and drag a Zoom window around the lower-right corner of the border (see Figure 14.16b). The right border has been partially cut off. We’ll have to readjust the X value in the Plot Offset area.
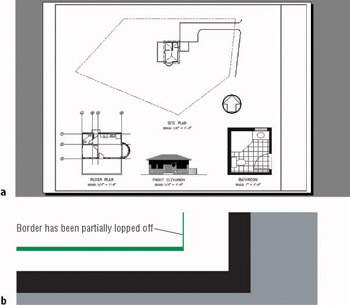
Figure 14.16: The plot preview after adjusting the X value in the Plot Offset area (a) and zooming in to check the border (b) - Right-click again and choose Exit. Change the X setting to 0.09. Click Preview again. Right-click and choose Zoom Window again. Zoom in to the corner and confirm that the border is now OK. Right-click and choose Zoom Original to return to the preview (see Figure 14.17).
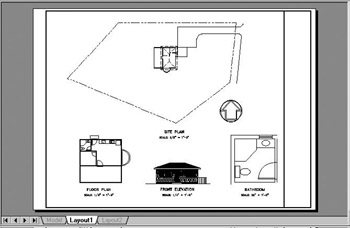
Figure 14.17: Preview of the site plot after readjusting the X value to 0.09 - Feel free to make minor adjustments to the Origin settings. You could also use the Stretch command to move the left side of the border to the right in order to gain a little more space for the binding. Because the border so closely fits the printable area, we could move the drawing on the sheet only a little more than 1⁄8" without lopping off the right side, so the results are barely noticeable. Normally you make these adjustments when you set up the layout.
- When you are finished making adjustments, return to the Plot dialog box. Click OK to start the print, or click Cancel to cancel it.
- Save this drawing as Site14a.
The last section in this chapter will consist of a discussion on a more advanced feature of plotting—plot styles.
A Few Words About Plot Styles
So far in this chapter, we have assigned lineweights to layers. We have assumed that any printer was monochromatic and was converting all colors in the AutoCAD drawing to black. Laserjet printers usually are monochromatic, but they may print the lighter colors in your drawing as screened. If you have access to a large-format inkjet plotter, you may have the option to print in monochrome or color. And you may have objects in your drawing that are one color, but you want them printed in another color. Plot styles offer a means to handle these kinds of situations. You don’t have to use plot styles in AutoCAD, but you may need to work on a drawing that uses them. We’ll finish this chapter with a tour of the various dialog boxes and procedures for setting up and assigning plot styles.
Plot Style Table Files
A plot style is a group of settings that is assigned to a layer, a color, or an object. It determines how that layer, color, or object is printed. Plot styles are grouped into plot style tables that are saved as files on your hard drive. There are two kinds of plot styles:
- Color-dependent, which are assigned to colors in your drawing
- Named, which are assigned to layers or objects
Leave AutoCAD for a moment, and use Windows Explorer to navigate to the following folder: C:Documents and Settingsyour nameApplication DataAutodeskAutoCAD 2005R16.0enuPlot Styles. Open the subfolder called Plot Styles. Figure 14.18 shows the contents of the Plot Styles folder. Thirteen plot style table files are already set up. Nine of them are color-dependent Plot Style Table files, with the extension .ctb, and four are named Plot Style Table files, with the extension .stb and called AutoCAD Plot Style Table File. (You may not be able to see the .ctb and .stb extensions.) Finally, there is the shortcut to the Add-A-Plot Style Table Wizard, which you use to set up custom plot style tables. Close Windows Explorer and return to AutoCAD.
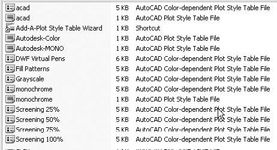
Figure 14.18: The contents of the Plot Styles folder
How Plot Style Table Files Are Organized
Plot style table files are assigned to a drawing and contain all the plot styles needed to control how that drawing is printed. Color-dependent plot styles control printing parameters through color, so there are 255 of them in each color-dependent plot style table, one for each color. Named plot style tables, on the other hand, have only as many plot styles as are necessary, possibly only two or three. Let’s look at a plot style table and see how it’s organized.
- In AutoCAD, choose File Plot Style Manager to open the Plot Styles dialog box. It is much like the Windows Explorer view of AutoCAD’s Plot Styles subfolder. In fact, it is another view of the same folder. Your view may have large icons and may not display all the details.
- Double-click the first acad file in the list. It’s the one that says AutoCAD Color-dependent Plot Style Table File in the right column of Figure 14.18. This opens the Plot Style Table Editor dialog box with acad.ctb in its title bar (see Figure 14.19). This dialog box has three tabs. The General tab displays information and a Description text box for input.
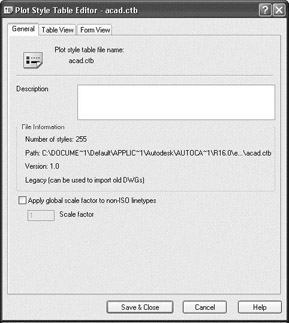
Figure 14.19: The General tab of the Plot Style Table Editor dialog box for the acad.ctb file - Click the Table View tab (see Figure 14.20). Now you see the actual plot styles across the top and the plot style properties listed down the left side. This tab organizes the information like a spreadsheet. Use the scroll bar to assure yourself that there are 255 plot styles here. Notice that there are 12 properties for each plot style. This tab displays the plot style information in a way that gives you an overview of the table as a whole.
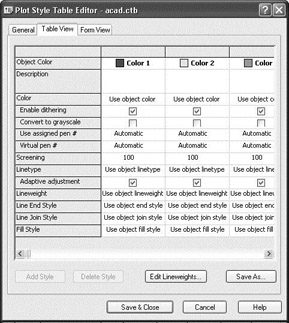
Figure 14.20: The Table View tab of the Plot Style Table Editor dialog box for the acad.ctb file - Click the Form View tab (see Figure 14.21). The same information is organized in a slightly different way. Here the plot styles are listed in the box on the left. You can highlight one or more plot styles at a time. The properties of the highlighted styles are shown on the right. This view is set up to modify the properties of chosen plot styles. Notice that the first property, Color, has Use Object Color assigned for all plot styles.
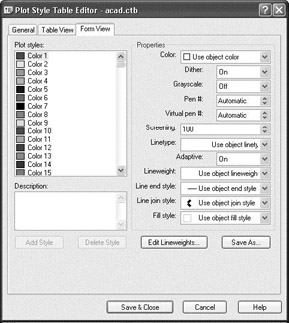
Figure 14.21: The Form View tab of the Plot Style Table Editor dialog box for the acad.ctb file - Close this plot style table and open the color-dependent monochrome file. Click the Table View tab. Now look at the Color property. All plot styles have the color Black assigned (see Figure 14.22).
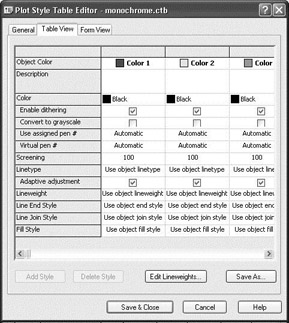
Figure 14.22: The Table View tab of the Plot Style Table Editor dialog box for the monochrome.ctb file - Close that plot style table file and open acad.stb and monochrome.stb to see how few plot styles they contain. (If you don’t see the .stb extension on the filenames, these files have a listing of AutoCAD Plot Style Table File in the column on the right in Figure 14.18, shown earlier.)
- Close the Plot Style Table Editor dialog box and close the Plot Styles dialog box.
The monochrome.ctb file will print all colors in your drawing as black, but won’t change them in the AutoCAD file.
Assigning Plot Style Tables to Drawings
Each drawing can be assigned only one kind of plot style table file: color-dependent or named. This is determined when the drawing is first created.
- Choose Tools Options to open the Options dialog box and click the Plot And Publish tab. Then click the Plot Style Table Settings button that’s near the lower-right corner of the dialog box. This opens the Plot Style Table Settings dialog box. In the uppermost area are the two radio buttons that control which type of plot style a drawing will accept, color-dependent or named (see Figure 14.23). New drawings will accept only the type of plot style that is selected here.
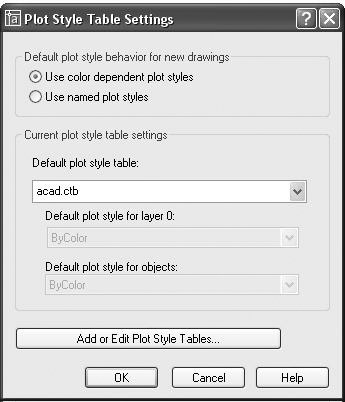
Figure 14.23: The Plot Style Table Settings dialog box - Below the radio buttons is the Default Plot Style Table drop-down list. Here you can select a plot style table file (of the type that is selected by the radio buttons) to be automatically assigned to new drawings. One of the options is None.
- Close the Plot Style Table Settings dialog box.
Note Even though the type of plot style for a new drawing is fixed in the Plot Style Table Settings dialog box, two utility commands let you switch the type of plot style that a drawing can have and assign a different one. They are the Convertpstyles and the Convertctb commands.
Throughout this book, all the drawings that you created (or downloaded) were set up to use color-dependent plot styles, so we can assign this type of plot style to the drawing. Usually this is done by assigning a particular plot style to a layout or to Model Space. To finish our tour, and this chapter, we’ll assign one of the available plot style table files to the Cabin14b drawing and use the Preview option to see the results.
- Make Cabin14b the current drawing, if it isn’t already.
- Click Layout1 to make it current, if it isn’t already.
- Start the Plot command, and make sure that the extension of the dialog box at the right is open. If it’s not, click the right-pointing arrow in the lower-right corner to open it. In the upper-right corner, make sure None is displayed in the Plot Style Table drop-down list, and then click the Preview button. AutoCAD displays the preview in the same colors used in the drawing (see Figure 14.24).
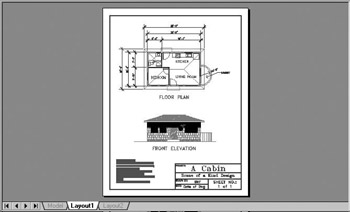
Figure 14.24: Preview of Layout1 without a plot style table assigned to it - Exit the Preview display, and then click the Cancel button to cancel the plot.
- Right-click the Layout1 tab, and choose Page Setup Manager. In the Page Setup Manager dialog box, highlight Cabin11a-L1 in the Page Setups list and click Modify. This opens the Page Setup dialog box.
- Notice that in the Plot Style Table (Pen Assignments) area, None is selected. No plot style table file has been assigned to this layout.
- Open the drop-down list.
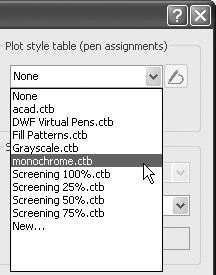
All the available .ctb (color-dependent plot style table) files are listed. You can choose one or click New at the bottom of the list and create your own. Once one is chosen, you can click the Edit button to modify it and make a new plot style out of it.
- Select monochrome.ctb, and then click OK.
- Click Preview in the lower-left corner. All lines and filled areas in the drawing are solid black (see Figure 14.25).
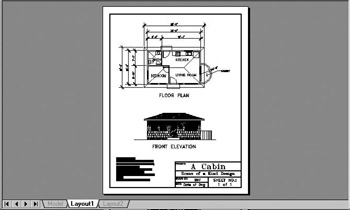
Figure 14.25: Preview with the monochrome.ctb plot style table assigned to Layout1 - Exit Preview.
- Repeat steps 5 through 10 and select a different .ctb file from the Plot Style Table drop-down list. (I recommend trying Screening 50%.ctb.) When you get back to the preview, you will see the difference.
- Exit the Plot dialog box and close the drawing without saving any changes.
This has been a quick tour of and introduction to the Plot Style feature that helps control how your drawing will plot. Getting consistently good output from your AutoCAD drawings involves an investment of time by you or the office CAD Manager/IT (Information Technologist) to set up the best configuration of your printers and AutoCAD. As you have seen, layouts provide a good tool for setting up plots, once the configuration is right.
The Appendix that follows contains tutorials and discussion about drawing in 3D (for AutoCAD users only). You will also find a glossary of terms related to AutoCAD, AutoCAD LT, building construction, and design that have been mentioned in the book. The Sybex website (www.sybex.com) offers the following downloads related to this book:
- A collection of all AutoCAD drawing files and adjunct files that are used or generated by the reader through the course of this book. Advanced readers can download these files and begin reading anywhere in the book.
- A bonus chapter that presents a survey of the various features of AutoCAD that will facilitate your use of the Internet with AutoCAD.
- A bonus Appendix that serves as an introduction to the AutoCAD attribute feature. This includes instructions on extracting attribute data from an AutoCAD drawing, calculating areas of rooms or closed spaces in your drawing, and an exercise in setting up a title block using attributes.
I hope that you have found the book useful in learning AutoCAD 2005 and AutoCAD LT 2005. Good luck in your future with AutoCAD. Please contact Sybex with any questions that arise while you work your way through the book
(www.sybex.com).
Are You Experienced?
Now you can
- set up a drawing to be printed
- assign lineweights to layers in your drawing
- select the area of your drawing to print
- choose a sheet size to print your drawing on
- control the orientation and origin of the print
- set the scale of the print
- preview a print
- print a layout
- navigate through the Plot Style features
Introduction
- Getting to Know AutoCAD
- Basic Commands to Get Started
- Setting Up a Drawing
- Gaining Drawing Strategies: Part 1
- Gaining Drawing Strategies: Part 2
- Using Layers to Organize Your Drawing
- Grouping Objects into Blocks
- Generating Elevations
- Working with Hatches and Fills
- Controlling Text in a Drawing
- Dimensioning a Drawing
- Managing External References
- Using Layouts to Set Up a Print
- Printing an AutoCAD Drawing
- Appendix A Look at Drawing in 3D
EAN: N/A
Pages: 159
