Performance Monitoring and Tuning
As reports grow in data size and complexity, ensuring optimal performance becomes increasingly important. This section serves as both a reminder of some performance tips already covered in the book to this point and as an introduction to some other tools and methods provided by Crystal Reports to optimize report performance in demanding environments.
Group By On Server
This Crystal Reports option enables you to push down the Grouping and Sorting activities to the database server. By performing these functions on the database instead of the Crystal server, less data is passed back to the Crystal Report and report-processing time is decreased. This option can be set locally under the Database main menu when the given report is being edited, or set globally on the Database tab of the Options menu accessed under the File main menu.
Some restrictions apply to the use of this option, including the following:
- The data source must be a standard SQL database.
- The report must have groups within it and the groups must be based on database fieldsnot formula fields.
- The groups cannot contain specified order sorting.
- The details section of the report must be hidden.
- Running Totals must be based on summary fields (that is, they do not rely on detail records for their calculations).
- The report cannot contain Average or Distinct Count summaries, or use Top N values.
When this option is applicable and used, the involved reports will perform faster. In addition, the detail level on these reports is still accessible through the standard drill-down functionality and will make dynamic connections to the database to bring back any user-requested detailed information.
SQL Expressions in Record Selections
As referenced and discussed previously in the book, SQL expressions are SQL statements that provide access to advanced database aggregations and functions. Using SQL expressions wherever possible in record selections and formula creation (versus using Crystal or Basic syntax) optimizes the amount of work that will get processed by the database server (versus the Crystal server)and this will increase your report's performance.
Some quick examples of SQL expressions that can be used in place of Crystal formula syntax:
|
Crystal Formula Syntax |
SQL Expression (SQL Server Syntax) |
|---|---|
|
IF/THEN/ELSE |
CASE [Database Field] |
|
Or |
WHEN Condition THEN Value1 |
|
SELECT CASE |
ELSE Value2 END |
|
Concatenate |
CONCAT([Database |
|
(x + y) |
Field1], [Database Field2]) |
|
MONTH(datefield) |
MONTH([Database Field]) |
You should investigate the SQL capabilities of the report's database thoroughly when report performance and optimization becomes a critical business issue. Mature databases like Oracle, DB2, SQL Server, and so on have mature SQL capabilities that can often be leveraged in lieu of the Crystal formula language in field selection and record selection. Using SQL expressions can dramatically increase report performance in many instances.
Use Indexes on Server for Speed
This is another performance option that is set under the Database tab of the Options dialog accessed from the main File menu. This option ensures that the involved Crystal Report uses any indexes that are present for the selected database and for the given report.
On-Demand or Reduced Number of Subreports
As discussed in the chapter on subreports, these objects are reports unto themselves and maintain their own database connections and queries. As you can imagine, if too many subreports are added to a main report, this can lead to runaway report-processing times. A typical scenario where this might happen is when you want to include the data inside a subreport for every group within the main report. In a large report with hundreds or even thousands of groups, this can lead to that subreport running thousands of timesa palpable performance hit even when the subreport is small and/or optimized.
To minimize this challenge, it is a good idea to ensure that in-place subreports (as opposed to on-demand subreports) are used judiciously and that they are indeed required in performance-sensitive reports. Often times, only a very small subset of the subreports are ever viewed by a user and an acceptable user experience can be provided with On-Demand subreports instead.
Performance Monitor
After a report has been functionally designed, Crystal Reports provides the Performance Information tool to facilitate performance testing. This tool provides information that helps in optimizing the current report for fastest performance. The Performance Information dialog shown in Figure 11.5 is accessed from the main Report menu.
Figure 11.5. The Performance Information window provides detailed report performance metrics.
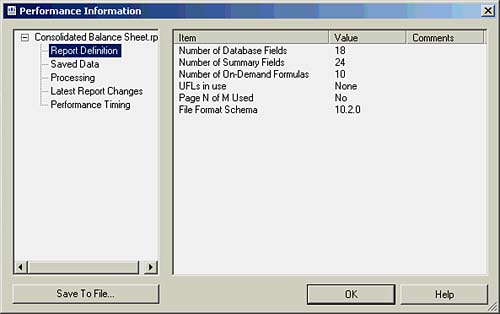
The left side of the Performance window provides a tree structure that facilitates navigation among the different report metrics areas maintained by this tool:
- Report Definition: This node provides information about the content of the report: the number of fields, the number of summaries, UFLs (User Function Libraries), Chart objects, and so on. Each of these objects will have some impact on the performance of the report dependent on their quantity and complexity. The Page N of M Used option is relevant because it specifies whether a third pass of the data is needed when processing this report. If not required, this can be eliminated by removing any Page N of M special fields on the report.
- Saved Data: This node provides information about the data captured in the involved report: the number of data sources used, the total number of records, recurring database record length, size of saved data, and so on. These metrics are of particular relevance when Group By On Server is properly used but can be generally used to monitor the effects of report changes.
- Processing: This node provides information about the processing of the selected report: Grouping on Server?, Sorting on Server? Total Page Count required?, Number of Summary Values, and so on. The metrics provided here have a clear impact on performance and can be used to monitor the effective implementation of the optimization techniques described in this section.
- Latest Report Changes: This node provides information about recent changes to the report to facilitate performance monitoring.
- Performance Timing: This node provides the timing metrics based on opening the involved report and formatting its pages. These metrics provide the ultimate benchmark to determine the effectiveness of any implemented report optimization techniques.
Additional tree branches and nodes are displayed if the involved report contains subreportseach of these nodes will appear under a new parent node for each subreport facilitating performance analysis at a granular level.
One final note on performance monitoring: to facilitate record-keeping on the progress of any ongoing database or report optimizations, the Performance Information window provides the capability to save the involved report's performance information to a file for future reference and time comparison.
Part I. Crystal Reports Design
Creating and Designing Basic Reports
- Creating and Designing Basic Reports
- Introducing the Crystal Reports Designer
- Understanding Data and Data Sources
- Introduction to the Data Explorer
- Adding Database Objects to Your Report
- Joining Database Objects Together
- Understanding the Different Join Types
- Using the Report Creation Wizards
- Understanding the Crystal Reports Gallery
- Using the Standard Report Creation Wizard
- Creating a Report Without Wizards
- Troubleshooting
Selecting and Grouping Data
- Selecting and Grouping Data
- Introduction
- Understanding Field Objects
- Working with Groups
- Understanding Drill-down Reports
- Troubleshooting
Filtering, Sorting, and Summarizing Data
- Filtering, Sorting, and Summarizing Data
- Introduction
- Filtering the Data in Your Report
- Learning to Sort Records
- Working with the Sort Expert
- Creating Effective Summaries
- Troubleshooting
Understanding and Implementing Formulas
- Understanding and Implementing Formulas
- Introduction
- Using the Formula Workshop
- Using the Workshop Formula Editor
- Creating Formulas with the Formula Expert
- Using the Formula Extractor to Create Custom Functions
- The Multi-Pass Reporting Process of the Crystal Reports Engine
- Troubleshooting
Implementing Parameters for Dynamic Reporting
- Implementing Parameters for Dynamic Reporting
- Introduction
- Understanding the Value of Parameters
- Creating and Implementing Parameters Fields
- Using Parameters with Record Selections
Part II. Formatting Crystal Reports
Fundamentals of Report Formatting
- Fundamentals of Report Formatting
- Introduction
- Positioning and Sizing Report Objects
- Modifying Object Properties for Formatting Purposes
- Exploring the Format Editor Dialog Common Options
- Combining and Layering Report Objects
- Configuring Report Page and Margin Properties
Working with Report Sections
- Working with Report Sections
- Introduction
- Formatting Report Sections
- Modifying Report Section Properties
- Using Multiple Report Sections
- Troubleshooting
Visualizing Your Data with Charts and Maps
- Visualizing Your Data with Charts and Maps
- Introduction to Charts and Maps
- Using the Chart Expert
- Using the Map Expert
- Modifying Chart and Map Properties
- Troubleshooting
Custom Formatting Techniques
- Introduction
- Making Presentation-Quality Reports
- Common Formatting Features
- Conditional Formatting Using Data to Drive the Look of a Report
Part III. Advanced Crystal Reports Design
Using Cross-Tabs for Summarized Reporting
- Using Cross-Tabs for Summarized Reporting
- Introduction to Cross-Tabs
- Benefits of Cross-Tabs
- Using the Cross-Tab Wizard
- Using Top N with Cross-Tabs Reports
- Using Advanced Cross-Tab Features
Using Record Selections and Alerts for Interactive Reporting
- Using Record Selections and Alerts for Interactive Reporting
- Creating Advanced Record Selection Formulas
- Adding Alerting to Your Reports
- Performance Monitoring and Tuning
Using Subreports and Multi-Pass Reporting
- Using Subreports and Multi-Pass Reporting
- Understanding Subreports
- Understanding Linked Versus Unlinked Subreports
- Considering Subreport Execution Time and Performance
- Using Variables to Pass Data Between Reports
- Emulating Nested Subreports
- Troubleshooting
Using Formulas and Custom Functions
- Using Formulas and Custom Functions
- Becoming More Productive with Formulas
- Choosing a Formula Language: Crystal Versus Basic Syntax
- Using Brackets in Formulas
- Using Characters in Formulas
- Recent Improvements to Formulas
Designing Effective Report Templates
- Designing Effective Report Templates
- Understanding the Importance of Reuse in Reporting
- Understanding Report Templates
- Using Report Templates
- Using Existing Crystal Reports as Templates
- Understanding How Templates Work
- Creating Useful Report Templates
- Using Template Field Objects
- Using Report Templates to Reduce Report Creation Effort
- Applying Multiple Templates
Additional Data Sources for Crystal Reports
- Additional Data Sources for Crystal Reports
- Understanding the Additional Crystal Reports Data Sources
- Connecting to COM-based Data Sources
- Connecting to Java-based Data Sources
- Understanding Solution Kits for Crystal Enterprise
- Troubleshooting
Multidimensional Reporting Against OLAP Data with Crystal Reports
- Multidimensional Reporting Against OLAP Data with Crystal Reports
- Introduction to OLAP
- OLAP Concepts and OLAP Reporting
- Recently Added or Changed OLAP Features in Crystal Reports
- Using the OLAP Report Creation Wizard and OLAP Expert
- Advanced OLAP Reporting
- Introduction to Crystal Analysis
Part IV. Enterprise Report Design Analytic, Web-based, and Excel Report Design
Introduction to Crystal Repository
- Introduction to Crystal Repository
- What Is the Crystal Repository?
- Why Implement the Crystal Repository?
- Installing the Crystal Repository
- Adding Objects to and from the Repository
- Migration of the Crystal Enterprise Repository
- Troubleshooting
Crystal Reports Semantic Layer Business Views
- Crystal Reports Semantic Layer Business Views
- Introduction to Business Views
- Why Implement Business Views?
- Performance and Implementation Considerations
- Business Views Architecture and Implementation
- Troubleshooting
Creating Crystal Analysis Reports
- Creating Crystal Analysis Reports
- Introduction
- Introducing Crystal Analysis
- Accessing OLAP Data with Crystal Analysis
- Designing Crystal Analysis Reports and Applications
- Adding Crystal Analysis Objects to a Report
- Troubleshooting
Advanced Crystal Analysis Report Design
- Advanced Crystal Analysis Report Design
- Introduction
- Advanced Crystal Analysis Designer Tools
- Custom Calculations and Advanced Data Analysis
- Setting Report Options
- Troubleshooting
- Crystal Analysis in the Real World MDX
Ad-Hoc Application and Excel Plug-in for Ad-Hoc and Analytic Reporting
- Ad-Hoc Application and Excel Plug-in for Ad-Hoc and Analytic Reporting
- Introducing Ad-Hoc Reporting Conceptually
- Introducing the Crystal Enterprise Ad-Hoc Reporting Application
- Crystal Reports Excel Plug-in
- Crystal Analysis Excel Plug-in
Part V. Web Report Distribution Using Crystal Enterprise
Introduction to Crystal Enterprise
- Introduction to Crystal Enterprise
- What Is Crystal Enterprise?
- Why Implement a Crystal Enterprise Solution?
- Versions of Crystal Enterprise
- Understanding the Core Functions of Crystal Enterprise
Using Crystal Enterprise with Web Desktop
- Using Crystal Enterprise with Web Desktop
- Introduction
- Crystal Enterprise User Launchpad
- Crystal Enterprise Web Desktop
- Customizing the Web Desktop and Report Viewers
- Publishing to the Web Desktop
- Customizing the Web Desktop
- Troubleshooting
Crystal Enterprise Architecture
- Crystal Enterprise Architecture
- Introduction
- Crystal Enterprise Architecture Overview
- The Client Tier
- The Application Tier
- The Server Tier: Introduction to the Crystal Enterprise Framework
- The Server Tier: Overview of the Crystal Enterprise Services
- The Data Tier
- The Crystal Enterprise Architecture in Action
- Taking Advantage of the Crystal Enterprise Distributed Architecture
- Extending Crystal Enterprise
Planning Considerations When Deploying Crystal Enterprise
- Planning Considerations When Deploying Crystal Enterprise
- Ensuring a Successful Crystal Enterprise Implementation
- Approaching the Project
- Identifying Business Pain
- Establishing Project Requirements
- Understanding Organizational Reporting Requirements
- Troubleshooting
Deploying Crystal Enterprise in a Complex Network Environment
- Deploying Crystal Enterprise in a Complex Network Environment
- Introduction
- Understanding Network Protocols
- Understanding Firewall Types
- Configuring the Crystal Enterprise Architecture for Your Network Environment
- Interaction Between the WCS and the WC
- Deploying Crystal Enterprise with an IP Packet Filtering Firewall
- Using Crystal Enterprise with NAT
- Exploring the NAT and Crystal Enterprise Relationship
- Crystal Enterprise and Proxy Servers
Administering and Configuring Crystal Enterprise
- Introduction
- Using the Crystal Management Console
- Managing Accounts
- Managing Content
- Introducing Servers
- Managing Crystal Enterprise System Settings
- Using the Crystal Configuration Manager
Part VI. Customized Report Distribution Using Crystal Reports Components
Java Reporting Components
- Java Reporting Components
- Overview of the Crystal Reports Java Reporting Component
- Understanding the Java Reporting Components Architecture
- Differences with the Java Reporting Engine
- Configuring the Application Server
- Delivering Reports in Web Applications
- Using the Crystal Tag Libraries
- Exporting Reports to Other File Formats
- Printing Reports from the Browser
- Common Programming Tasks
- Troubleshooting
Crystal Reports .NET Components
- Crystal Reports .NET Components
- Understanding Microsofts .NET Platform
- Understanding the Different Crystal .NET Components
- An Overview of the Crystal Reports 10 .NET Components
- The Report Designer
- The Report Engine Object Model
- Delivering Reports with the Windows Forms Viewer
- Delivering Reports with the Web Forms Viewer
- Database Credentials
- Setting Parameters
- Troubleshooting
COM Reporting Components
- COM Reporting Components
- Understanding the Report Designer Component
- Building Reports with the Visual Basic Report Designer
- Programming with the Report Engine Object Model
- Delivering Reports Using the Report Viewer
- Troubleshooting
Part VII. Customized Report Distribution Using Crystal Enterprise Embedded Edition
Introduction to Crystal Enterprise Embedded Edition
- Introduction to Crystal Enterprise Embedded Edition
- Introduction to Crystal Enterprise Embedded Edition
- Understanding Crystal Enterprise Embedded Edition
- Crystal Enterprise Embedded Edition Samples
- DHTML Report Design Wizard
- Troubleshooting
Crystal Enterprise Viewing Reports
- Crystal Enterprise Viewing Reports
- Viewing Reports over the Web
- Introduction to the Crystal Report Viewers
- Understanding the Report Source
- Implementing the Page Viewer
- Implementing the Part Viewer
- Implementing the Interactive Viewer
- Implementing the Grid Viewer
- Troubleshooting
Crystal Enterprise Embedded Report Modification and Creation
- Introduction
- Deploying RAS Environments
- Loading Report Files
- Locating RAS Components in a Network Architecture
- Installing the RAS SDK
- Best Practices in RAS Exception Handling
- The RAS SDK in Action
Part VIII. Customized Report Distribution Using Crystal Enterprise Professional
Introduction to the Crystal Enterprise Professional Object Model
- Introduction to the Crystal Enterprise Professional Object Model
- Understanding the Crystal Enterprise Object Model
- Establishing a Crystal Enterprise Session
- Querying the Crystal Enterprise Repository
- Viewing Reports
- The Crystal Enterprise Java SDK
- Accessing the Java SDK
- Troubleshooting
Creating Enterprise Reports Applications with Crystal Enterprise Part I
- Creating Enterprise Reports Applications with Crystal Enterprise Part I
- Advanced Scenarios with the Crystal Enterprise Object Model
- Scheduling Reports
- Scheduling to a Destination
- Using Crystal Enterprise Notifications
- Scheduling to a Server Group
- Scheduling to a Specific Format
- Setting Database Credentials
- Troubleshooting
Creating Enterprise Reporting Applications with Crystal Enterprise Part II
- Creating Enterprise Reporting Applications with Crystal Enterprise Part II
- Querying the Crystal Enterprise InfoStore
- Creating and Responding to Crystal Enterprise Alerts
- Creating Schedulable Program Objects
- Troubleshooting
Appendix A. Using Sql Queries In Crystal Reports
Creating Enterprise Reporting Applications with Crystal Enterprise Part II
EAN: 2147483647
Pages: 341
