Combining and Layering Report Objects
The concepts of combining and layering report objects becomes relevant when you need to precisely control the relationship between two or more objects when occupying a common space on the report. For example, assume that rather than having your country field read USA, you would like to combine the Country database field with a text object so that it reads Country/Pays: USAdisplaying the textual description for country in both English and French. To accomplish this, you can easily combine a text and a database field into one common report object.
The previous exercises can be enhanced by adding a more descriptive text object to your report as that described above. To complete this, start by adding a group definition to your report. The group definition enables you to logically present each customer within the country in which they are located. The following steps will add this grouping:
- From the Insert menu, select Group to present the Insert Group dialog. Select the Country field (located under the Customer table) from the uppermost drop-down list. Leave the sort order as Ascending and click OK to return to the report.
- Verify that you are working in the Design view of the reportclick on the Design tab if necessary. You should now see two new sections listed in the left column area of the design environmentGroup Header #1 and Group Footer #1. From the Insert menu, select Text Object and drop the object to the right of the Group #1 Name field in the Group Header section. Type Country/Pays: for the textual content of this new object (including a space after the colon), as shown in Figure 6.12.
Figure 6.12. The Insert menu enables you to quickly add a group and text object into your report.
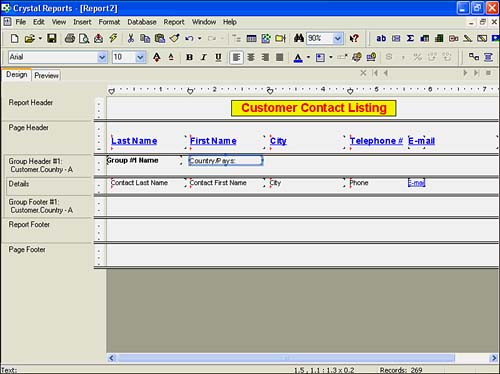
- Highlight the Group #1 Name field object, click and drag it over the new text object field (you can drag the entire object after the mouse pointer has turned into a four-way cross icon), and drop it onto the text object when the flashing vertical cursor indicates that it falls precisely to the right of the textual description you have entered.
NOTE
Dragging and dropping objects to combine them is a very precise maneuver and might require some practice. If you have dropped the Group Name field in the wrong place, click the Undo button (curved arrow pointing backward) and try again until you are comfortable and successful with this technique.
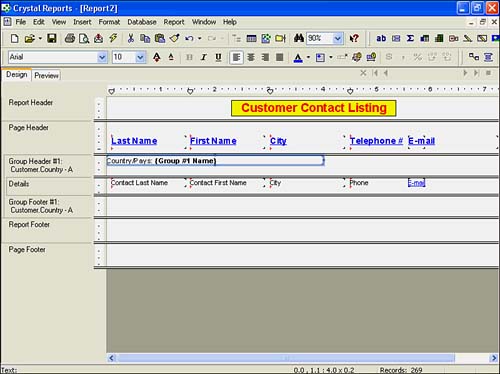
- After you have successfully combined these objects together, the design application still references the newly combined object as a Text object. You now need to widen the object's display area. Click this object to highlight it and drag the left-side perimeter handle farther to the left until you reach the left margin of the design area, as shown in Figure 6.13.
Figure 6.13. You have now combined a database field object with a text object to form one common report object.
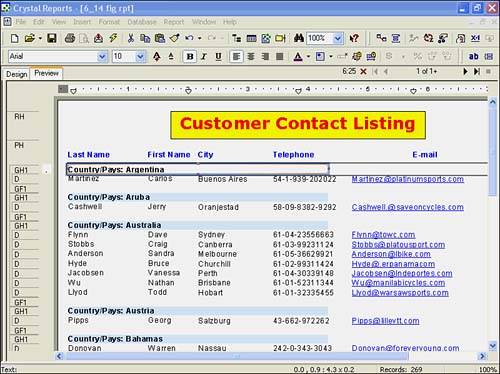
- With the combined text object highlighted, use the steps identified earlier in this chapter to modify the object's properties to present the field values in a bold red font style, as shown in Figure 6.14. Click the Preview tab to see how the report results are displayed. (Use the Refresh toolbar button if the Preview tab is not visible.)
Figure 6.14. After combining two or more objects, you can specify formatting properties for the newly combined report object.
- Now add a corporate logo to your report and use this to discuss object layering. You need to have a picture file saved in either bitmap, TIFF, JPEG, or PNG format available for use. Use the Business Objects logo downloaded from its Web site for this example. Select the Picture menu option from the Insert menu. Navigate to and select the Business Objects Logo image and drag it into the Report Header section. Drop the image into the Report Header section so that its left perimeter is aligned directly above the left perimeter of the Telephone Number column, as shown in Figure 6.15.
Figure 6.15. Drag and drop the Business Objects Logo image object into place in the Report Header section.
Notice, as illustrated in Figure 6.15, that you have partially covered the report title object with the new logo image. This could have certainly been avoided by placing the image object farther to the right, but for demonstration purposes, use the Move property of the report title field to once again make it visible.
- Right-click the report title text object, select Move, and then select To Front from the additional pop-up options. This positions the report title object on top of the logo image, as you can see in the report preview.
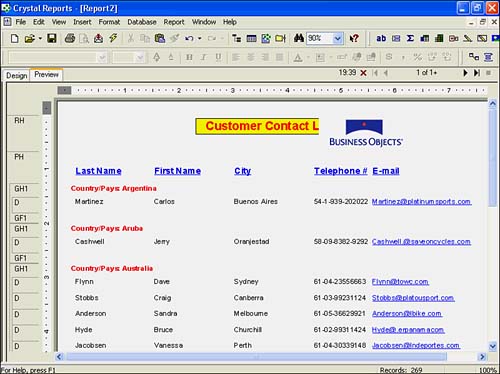
- To resolve the issue of overlapping objects in the Report Header section, adjust the two objects so that the report title is displayed farther to the left of the logo image, as shown in Figure 6.16. Save your report sample if you want.
Figure 6.16. By adjusting the objects located in the Report Header, you have resolved the need to layer these objects; however, layering does provide flexible display options.
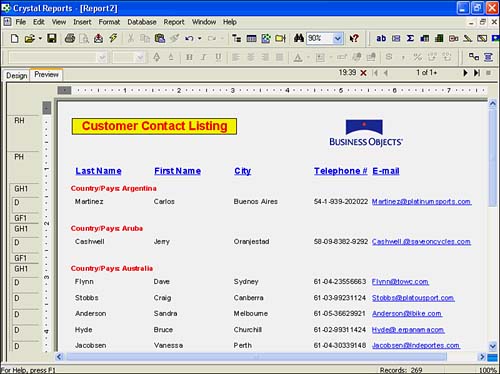
- As a final step to re-create the report in Figure 6.2, use the Format Expert dialog to modify the report title text so that it appears in a bold, navy blue, underlined, size 20 Verdana font with no displayed borders.
As a result of these exercises, you now have a very useful report that displays each customer contact record distinctively grouped within the country in which they are located. The formatting that has been applied introduces the capabilities that make Crystal Reports the undisputed champion of professionally formatted reports.
Part I. Crystal Reports Design
Creating and Designing Basic Reports
- Creating and Designing Basic Reports
- Introducing the Crystal Reports Designer
- Understanding Data and Data Sources
- Introduction to the Data Explorer
- Adding Database Objects to Your Report
- Joining Database Objects Together
- Understanding the Different Join Types
- Using the Report Creation Wizards
- Understanding the Crystal Reports Gallery
- Using the Standard Report Creation Wizard
- Creating a Report Without Wizards
- Troubleshooting
Selecting and Grouping Data
- Selecting and Grouping Data
- Introduction
- Understanding Field Objects
- Working with Groups
- Understanding Drill-down Reports
- Troubleshooting
Filtering, Sorting, and Summarizing Data
- Filtering, Sorting, and Summarizing Data
- Introduction
- Filtering the Data in Your Report
- Learning to Sort Records
- Working with the Sort Expert
- Creating Effective Summaries
- Troubleshooting
Understanding and Implementing Formulas
- Understanding and Implementing Formulas
- Introduction
- Using the Formula Workshop
- Using the Workshop Formula Editor
- Creating Formulas with the Formula Expert
- Using the Formula Extractor to Create Custom Functions
- The Multi-Pass Reporting Process of the Crystal Reports Engine
- Troubleshooting
Implementing Parameters for Dynamic Reporting
- Implementing Parameters for Dynamic Reporting
- Introduction
- Understanding the Value of Parameters
- Creating and Implementing Parameters Fields
- Using Parameters with Record Selections
Part II. Formatting Crystal Reports
Fundamentals of Report Formatting
- Fundamentals of Report Formatting
- Introduction
- Positioning and Sizing Report Objects
- Modifying Object Properties for Formatting Purposes
- Exploring the Format Editor Dialog Common Options
- Combining and Layering Report Objects
- Configuring Report Page and Margin Properties
Working with Report Sections
- Working with Report Sections
- Introduction
- Formatting Report Sections
- Modifying Report Section Properties
- Using Multiple Report Sections
- Troubleshooting
Visualizing Your Data with Charts and Maps
- Visualizing Your Data with Charts and Maps
- Introduction to Charts and Maps
- Using the Chart Expert
- Using the Map Expert
- Modifying Chart and Map Properties
- Troubleshooting
Custom Formatting Techniques
- Introduction
- Making Presentation-Quality Reports
- Common Formatting Features
- Conditional Formatting Using Data to Drive the Look of a Report
Part III. Advanced Crystal Reports Design
Using Cross-Tabs for Summarized Reporting
- Using Cross-Tabs for Summarized Reporting
- Introduction to Cross-Tabs
- Benefits of Cross-Tabs
- Using the Cross-Tab Wizard
- Using Top N with Cross-Tabs Reports
- Using Advanced Cross-Tab Features
Using Record Selections and Alerts for Interactive Reporting
- Using Record Selections and Alerts for Interactive Reporting
- Creating Advanced Record Selection Formulas
- Adding Alerting to Your Reports
- Performance Monitoring and Tuning
Using Subreports and Multi-Pass Reporting
- Using Subreports and Multi-Pass Reporting
- Understanding Subreports
- Understanding Linked Versus Unlinked Subreports
- Considering Subreport Execution Time and Performance
- Using Variables to Pass Data Between Reports
- Emulating Nested Subreports
- Troubleshooting
Using Formulas and Custom Functions
- Using Formulas and Custom Functions
- Becoming More Productive with Formulas
- Choosing a Formula Language: Crystal Versus Basic Syntax
- Using Brackets in Formulas
- Using Characters in Formulas
- Recent Improvements to Formulas
Designing Effective Report Templates
- Designing Effective Report Templates
- Understanding the Importance of Reuse in Reporting
- Understanding Report Templates
- Using Report Templates
- Using Existing Crystal Reports as Templates
- Understanding How Templates Work
- Creating Useful Report Templates
- Using Template Field Objects
- Using Report Templates to Reduce Report Creation Effort
- Applying Multiple Templates
Additional Data Sources for Crystal Reports
- Additional Data Sources for Crystal Reports
- Understanding the Additional Crystal Reports Data Sources
- Connecting to COM-based Data Sources
- Connecting to Java-based Data Sources
- Understanding Solution Kits for Crystal Enterprise
- Troubleshooting
Multidimensional Reporting Against OLAP Data with Crystal Reports
- Multidimensional Reporting Against OLAP Data with Crystal Reports
- Introduction to OLAP
- OLAP Concepts and OLAP Reporting
- Recently Added or Changed OLAP Features in Crystal Reports
- Using the OLAP Report Creation Wizard and OLAP Expert
- Advanced OLAP Reporting
- Introduction to Crystal Analysis
Part IV. Enterprise Report Design Analytic, Web-based, and Excel Report Design
Introduction to Crystal Repository
- Introduction to Crystal Repository
- What Is the Crystal Repository?
- Why Implement the Crystal Repository?
- Installing the Crystal Repository
- Adding Objects to and from the Repository
- Migration of the Crystal Enterprise Repository
- Troubleshooting
Crystal Reports Semantic Layer Business Views
- Crystal Reports Semantic Layer Business Views
- Introduction to Business Views
- Why Implement Business Views?
- Performance and Implementation Considerations
- Business Views Architecture and Implementation
- Troubleshooting
Creating Crystal Analysis Reports
- Creating Crystal Analysis Reports
- Introduction
- Introducing Crystal Analysis
- Accessing OLAP Data with Crystal Analysis
- Designing Crystal Analysis Reports and Applications
- Adding Crystal Analysis Objects to a Report
- Troubleshooting
Advanced Crystal Analysis Report Design
- Advanced Crystal Analysis Report Design
- Introduction
- Advanced Crystal Analysis Designer Tools
- Custom Calculations and Advanced Data Analysis
- Setting Report Options
- Troubleshooting
- Crystal Analysis in the Real World MDX
Ad-Hoc Application and Excel Plug-in for Ad-Hoc and Analytic Reporting
- Ad-Hoc Application and Excel Plug-in for Ad-Hoc and Analytic Reporting
- Introducing Ad-Hoc Reporting Conceptually
- Introducing the Crystal Enterprise Ad-Hoc Reporting Application
- Crystal Reports Excel Plug-in
- Crystal Analysis Excel Plug-in
Part V. Web Report Distribution Using Crystal Enterprise
Introduction to Crystal Enterprise
- Introduction to Crystal Enterprise
- What Is Crystal Enterprise?
- Why Implement a Crystal Enterprise Solution?
- Versions of Crystal Enterprise
- Understanding the Core Functions of Crystal Enterprise
Using Crystal Enterprise with Web Desktop
- Using Crystal Enterprise with Web Desktop
- Introduction
- Crystal Enterprise User Launchpad
- Crystal Enterprise Web Desktop
- Customizing the Web Desktop and Report Viewers
- Publishing to the Web Desktop
- Customizing the Web Desktop
- Troubleshooting
Crystal Enterprise Architecture
- Crystal Enterprise Architecture
- Introduction
- Crystal Enterprise Architecture Overview
- The Client Tier
- The Application Tier
- The Server Tier: Introduction to the Crystal Enterprise Framework
- The Server Tier: Overview of the Crystal Enterprise Services
- The Data Tier
- The Crystal Enterprise Architecture in Action
- Taking Advantage of the Crystal Enterprise Distributed Architecture
- Extending Crystal Enterprise
Planning Considerations When Deploying Crystal Enterprise
- Planning Considerations When Deploying Crystal Enterprise
- Ensuring a Successful Crystal Enterprise Implementation
- Approaching the Project
- Identifying Business Pain
- Establishing Project Requirements
- Understanding Organizational Reporting Requirements
- Troubleshooting
Deploying Crystal Enterprise in a Complex Network Environment
- Deploying Crystal Enterprise in a Complex Network Environment
- Introduction
- Understanding Network Protocols
- Understanding Firewall Types
- Configuring the Crystal Enterprise Architecture for Your Network Environment
- Interaction Between the WCS and the WC
- Deploying Crystal Enterprise with an IP Packet Filtering Firewall
- Using Crystal Enterprise with NAT
- Exploring the NAT and Crystal Enterprise Relationship
- Crystal Enterprise and Proxy Servers
Administering and Configuring Crystal Enterprise
- Introduction
- Using the Crystal Management Console
- Managing Accounts
- Managing Content
- Introducing Servers
- Managing Crystal Enterprise System Settings
- Using the Crystal Configuration Manager
Part VI. Customized Report Distribution Using Crystal Reports Components
Java Reporting Components
- Java Reporting Components
- Overview of the Crystal Reports Java Reporting Component
- Understanding the Java Reporting Components Architecture
- Differences with the Java Reporting Engine
- Configuring the Application Server
- Delivering Reports in Web Applications
- Using the Crystal Tag Libraries
- Exporting Reports to Other File Formats
- Printing Reports from the Browser
- Common Programming Tasks
- Troubleshooting
Crystal Reports .NET Components
- Crystal Reports .NET Components
- Understanding Microsofts .NET Platform
- Understanding the Different Crystal .NET Components
- An Overview of the Crystal Reports 10 .NET Components
- The Report Designer
- The Report Engine Object Model
- Delivering Reports with the Windows Forms Viewer
- Delivering Reports with the Web Forms Viewer
- Database Credentials
- Setting Parameters
- Troubleshooting
COM Reporting Components
- COM Reporting Components
- Understanding the Report Designer Component
- Building Reports with the Visual Basic Report Designer
- Programming with the Report Engine Object Model
- Delivering Reports Using the Report Viewer
- Troubleshooting
Part VII. Customized Report Distribution Using Crystal Enterprise Embedded Edition
Introduction to Crystal Enterprise Embedded Edition
- Introduction to Crystal Enterprise Embedded Edition
- Introduction to Crystal Enterprise Embedded Edition
- Understanding Crystal Enterprise Embedded Edition
- Crystal Enterprise Embedded Edition Samples
- DHTML Report Design Wizard
- Troubleshooting
Crystal Enterprise Viewing Reports
- Crystal Enterprise Viewing Reports
- Viewing Reports over the Web
- Introduction to the Crystal Report Viewers
- Understanding the Report Source
- Implementing the Page Viewer
- Implementing the Part Viewer
- Implementing the Interactive Viewer
- Implementing the Grid Viewer
- Troubleshooting
Crystal Enterprise Embedded Report Modification and Creation
- Introduction
- Deploying RAS Environments
- Loading Report Files
- Locating RAS Components in a Network Architecture
- Installing the RAS SDK
- Best Practices in RAS Exception Handling
- The RAS SDK in Action
Part VIII. Customized Report Distribution Using Crystal Enterprise Professional
Introduction to the Crystal Enterprise Professional Object Model
- Introduction to the Crystal Enterprise Professional Object Model
- Understanding the Crystal Enterprise Object Model
- Establishing a Crystal Enterprise Session
- Querying the Crystal Enterprise Repository
- Viewing Reports
- The Crystal Enterprise Java SDK
- Accessing the Java SDK
- Troubleshooting
Creating Enterprise Reports Applications with Crystal Enterprise Part I
- Creating Enterprise Reports Applications with Crystal Enterprise Part I
- Advanced Scenarios with the Crystal Enterprise Object Model
- Scheduling Reports
- Scheduling to a Destination
- Using Crystal Enterprise Notifications
- Scheduling to a Server Group
- Scheduling to a Specific Format
- Setting Database Credentials
- Troubleshooting
Creating Enterprise Reporting Applications with Crystal Enterprise Part II
- Creating Enterprise Reporting Applications with Crystal Enterprise Part II
- Querying the Crystal Enterprise InfoStore
- Creating and Responding to Crystal Enterprise Alerts
- Creating Schedulable Program Objects
- Troubleshooting
Appendix A. Using Sql Queries In Crystal Reports
Creating Enterprise Reporting Applications with Crystal Enterprise Part II
EAN: 2147483647
Pages: 341
