Introducing the Crystal Enterprise Ad-Hoc Reporting Application
The Crystal Enterprise Ad-Hoc Reporting Application uses the capabilities of Crystal Enterprise to present report modification and creation capabilities via a Web browser. HTML and CSP pages make up the application itself. These CSP pages interact with the COM CE-SDK and interact heavily with the Report Application Server (RAS), which provides the server-side report modification capabilities. Through heavy use of JavaScript in the browser, the Ad-Hoc application interacts with the end user more in the fashion of an application rather than a static Web page.
Because of the heavy level of interaction expected with usage of the Ad-Hoc application, administrators should carefully project and monitor usage at the Web server, Crystal Enterprise, and database levels.
The Ad-Hoc application consumes Business Views, Crystal Reports, or ODBC data sources, so database credentials, Crystal Enterprise credentials, and a data access policy should be in place to maximize effective use of the application. For organizations that have determined to use Business Views for all data access, appropriate Business Views should be in place to enable end users to create reports in the Ad-Hoc application, and appropriate permissions on those Business Views granted. For organizations that choose to enable direct access to the databases, again permissions should be granted.
Installing the Ad-Hoc Application
Installation of Crystal Enterprise, along with either the version 10 Premium bundle or Crystal Enterprise Professional with the appropriate "report modification and creation" key-code, are required before installing the Ad-Hoc application.
Note that the Ad-Hoc application supports the same platforms as Crystal Enterprise 10 with the exception of Netscape/Mozilla browser supportthe heavy use of JavaScript precluded the compatibility between Internet Explorer and Netscape/Mozilla.
Two versions of the Ad-Hoc program exist and require different installation methods: a CSP version and a JSP version, and a variant of the CSP installation where a Unix Web server works with a Windows Crystal Enterprise server. Depending on your environment and preferences, the proper version should be selected. The install.pdf file on your distribution of the Ad-Hoc application contains detailed instructions on the various installations.
Configuration of the Ad-Hoc Application
Several areas must be configured before deploying the Ad-Hoc application. Because the application heavily uses the RAS service/daemon, the settings for the RAS server should be specified for optimal performance. Also, because the Ad-Hoc application enables you to create and modify reports and save them back to the Crystal Enterprise system, you must modify or write appropriate rights to grant to the user or group on the particular folders affected.
 For more information on optimizing the RAS server performance, p. 559 and "Servers and Processing Options," p. 618
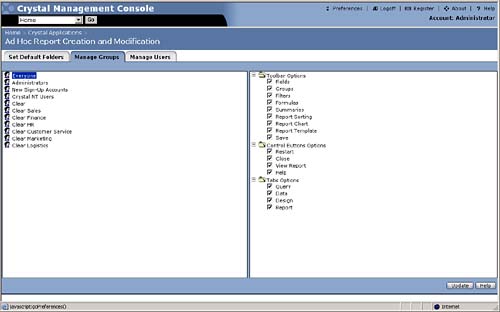
Further settings inside the Crystal Management Console, under Home, Crystal Applications, Ad-Hoc Report Creation and Modification determine which folders should be used for the default report templates and data sources. The actual contents of those folders display on the right side. In the displayed tree on the left, which shows Crystal Enterprise's folder structure, right-clicking a particular folder opens a menu to manage the folders (see Figure 21.1). At the bottom of the context menu the two options particular to the Ad-Hoc application let you designate the default folders to be used in the application for Data Sources (which displays the folder icon in red) and Templates (in blue). These folders, respectively, contain reports whose data definition provides a starting point for ad-hoc reporting and which you can use to re-format reports by using the template functionality. Often, for simplicity's sake, administrators create a root folder labeled Ad-Hoc and subfolders labeled DataSources and Templates, and then designate them accordingly using the right-click functionality.
Figure 21.1. The Crystal Management Console's Ad-Hoc application management display.

Checking the boxes to enable/disable Business Views or Reports as data sources determines what types of data sources the end users have access to. Business Views, a new feature of Crystal Enterprise 10, provides an easy way to define data in business terms, enabling end users to create reports in the Ad-Hoc application and provide self-service end-user scenarios.
The Manage Groups and Users tabs are identical and manage permissions for the Ad-Hoc application at the group and user level, respectively (see Figure 21.2). Using the group-level permissions enables more efficient management as fewer groups exist than users. You can then set individual user permissions by changing group permissions. If current groups do not map cleanly to the rights appropriate for this particular application, new groups can be created that map existing users or user groups to groups specifically created to manage Ad-Hoc application permissions. The permissions on the right part of the management screen manage which capabilities the end user can see in the toolbar that appears in the end-user application at the left side, the control buttons along the application's top right, and the tabs in the center of the application. Each of these capabilities is considered in the following sections.
Figure 21.2. The Ad-Hoc Application Manage Groups/Manage Users area in the Crystal Management Console.
Report Source Setup
The Ad-Hoc application enables an end user to create a report from either a Business View or a Crystal Report. Business View creators create and store the Business Views in the Crystal Enterprise system (refer to Chapter 18, "Crystal Reports Semantic LayerBusiness Views"). Creating an Ad-Hoc report from an existing Crystal Report requires a Crystal Report be in the Data-Sources folder as defined previously. You can either design this report in Crystal Reports and save it into the appropriate folder in Crystal Enterprise, move an existing report into that folder, or create it in an administrative area of the Ad-Hoc application itself. Exercise caution when moving an old report into the report definition folders because groupings and table names might confuse end users creating new reports from that definition. Testing in this situation is mandatory to ensure end user success.
To set up this report definition, start the Ad-Hoc application interface, which has two modes: an Administrator's mode and an end user's mode. Access the application by the application URL (by default, http:://Machinename/crystal/enterprise10/adhoc/). Logging on to this page with Administrator's credentials provides two options: to Define Report Datasource or to Create Ad-Hoc Report. The Create option refers to the end-user capability covered in the next section. The Define capability refers to the capability to create a report definition that can be used as a data source for an end user creating an Ad-Hoc report at a later time.
Set the report data source definition by choosing to either select an ODBC connection via the Select DB Data Source drop-down on the left under the toolbar, or by clicking on the Load Definition option immediately below it. The Load Definition accesses Crystal Reports stored in the Default Datasources folder designated earlier. Choosing a report here enables you to modify the way that this report's data definition is displayed to an end user creating an Ad-Hoc report. The drop-down list displays the data sources you can connect to if you want to create a Crystal Report from scratch. Typically it contains only the ODBC option. Choosing that option opens a dialog box asking you to select an ODBC connection existing on the server machine that hosts the Report Application Server service/daemon of the Crystal Enterprise system. By choosing the ODBC connection name (DSN), and then supplying the database credentials (username and password), and optionally any connection strings for the ODBC connection, you establish a connection to the database. Keep in mind that because this is a Web application, the dialog to choose the ODBC connection often has an approximately five-second lag, so wait for default values to show in the top line before clicking.
NOTE
After a data definition loads, you commence moving down the rest of the toolbarthe application design concept has the user start at the top of the toolbar and proceed down by first choosing the definition, selecting tables, linking them, choosing fields, determining filters and then formulas, and then saving this definition. Each of these items on the left is first single-clicked initially, displaying either a dialog box or a simple modification section immediately below it.
Because the dialogs and modification sections in the Ad-Hoc application behave very consistently, a short detour to discuss how you interact with them helps you move through the rest of the material smoothlyespecially because this Web application interacts with the end user so much and differs from many Windows conventions and Internet conventions for clicking and maneuvering. Note that the mere inclusion in this book of the following descriptions should trigger the thought that end users require training to successfully use this application. Although quite simple, the application does require some training even if this is only 15 minutes of introduction for the savvy user.
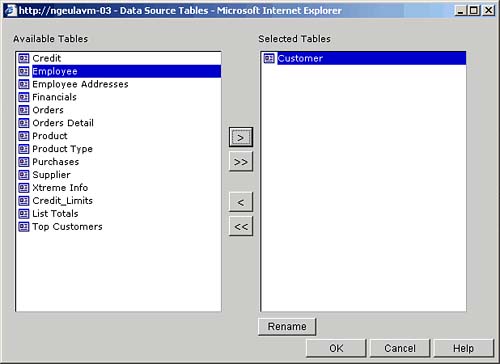
Each item in the toolbar on the left should be clicked once only to open it or its dialog box, and then clicked again to hide details that have displayed beneath it. Many users double-click on the toolbar items and wonder why they see nothing! Close dialog boxes by clicking OK or Cancel once. Most dialogs have a list on one side and another list on the other side (see Figure 21.3). In these cases, a single-click selects an item, Ctrl+click adds each clicked item to the current selection, and Shift+click selects everything between the item first selected and the item Shift+clicked. Moving items can be accomplished by double-clicking them, dragging a selection from one area to another, or by clicking the single chevron ( > ) to move a selection in that direction. Clicking the double-chevron ( >> ) moves all items in that direction, effectively clearing one area. Remember that response is always slower in a Web application and that clicking multiple times usually results in strange behavior because the application catches up with the user. Counsel end users to wait until they see the desired reaction visibly before going on to the next click or action so that they do not inadvertently cause strange behavior.
Figure 21.3. The Data Source Table dialog.
This cannot be stressed enough as a crucial part of the education process because end users also often click on an item to open a dialog box, and then click again somewhere else in the same window before the dialog box has opened, causing the dialog box to open behind the main window, effectively freezing the application. In cases like this, a savvy user simply minimizes the foreground window and finds the dialog waiting there. However, many times a frustrated user compounds the situation by clicking away in the vain hope that something will happen because he is clicking more, and eventually calls tech support with a frozen application. End users must be carefully instructed that although this application seems like a Windows application, it is still a series of Web pages, and that Web technology has these limitations. You gain by extending the capability to modify and create reports with nothing installed on the machineyou also must live with the resultant limitations.
Users might notice a similarity between the items in the toolbar and the Report Creation Wizard in Crystal Reports itself. This similarity is purposeful and makes migration to the concepts in the Ad-Hoc application simple for the user familiar with Crystal Reports. In addition, the underlying functionality of the Ad-Hoc application mirrors that of Crystal Reports, now presented more simply and over the Internet. Thus in an effort not to repeat information here about actual feature behavior, the reader can refer to the appropriate chapter on Crystal Reports for a more detailed understanding of the underlying concepts such as table linking, filter and formula creation, and the like.
The toolbar itself, incidentally, can be moved by clicking and dragging the Toolbar label on the top left, and restored by clicking on the x on the right of the toolbar. The original position of the toolbar on the left side, described as docked, also enables the end user to close it by clicking on the x, and then restore it by clicking on the triangle icon at the top left.
Returning to the flow of designing a report source, you click once on the Select Tables item to open the select tables dialog box (refer to Figure 21.3). Moving tables to the right includes them in the definition. After you've moved them to the right, you can rename tables by selecting them and clicking once on the Rename button. When you're finished choosing tables to include, choose OK. Again there is a pause after clicking OK as the page re-draws after a round-trip to the server. End users have to be instructed not to click before the page loads again.
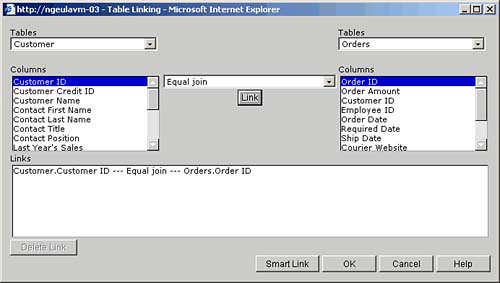
After selecting tables, you link them by clicking Link Tables in the toolbar, which opens the Table Linking dialog box (see Figure 21.4). To link tables, select a table on the left, another table on the right, and then the columns in the tables that will make up the link underneath the tables, respectively. Select the desired type of join from the drop-down list, and finally click the Link button once to create the link you have selected. This link now shows up in the Links area of the dialog box. Selecting a join and then clicking the Delete button deletes that join, and clicking the Smart Link button replaces all the current joins with joins that the server believes are the best based on column names and index and key positions in the database, if that information is available. Best practice recommends that if you want to use Smart Link functionality, attempt that first, and then examine the results. This way you save work if the joins are correct and can simply delete the incorrect links. When finished, click OK and move to the next item: field selection.
Figure 21.4. The Table Linking Dialog Box.
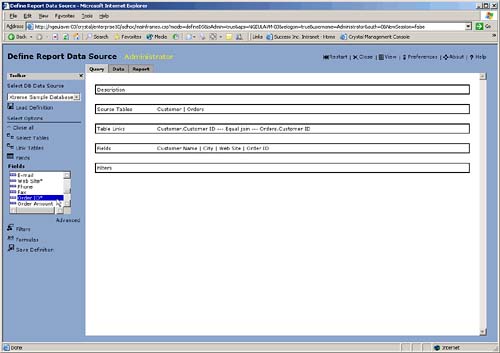
Clicking once on the Field item in the toolbar opens a mini-dialog box underneath the Fields item. Clicking again on Fields hides the mini-dialog. Each time you click on a field in the mini-dialog, an asterisk appears next to that field, and it appears to the right in the Fields area of the Query tab (see Figure 21.5).
Figure 21.5. The Field Selection mini-dialog.
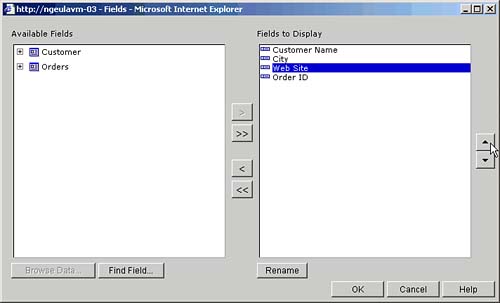
Clicking on the Advanced label underneath the Fields mini-dialog opens an advanced Field dialog box. This dialog enables you to bulk move items and arrange them left-to-right on the report by moving them up or down (up means to the left, and down to the right) in the Fields to Display area by selecting a field and then clicking the up or down arrows at the far right of the dialog box. This advanced dialog arranges available fields by table, but enables you to search for fields by clicking on the Find Fields button, as well as rename fields by selecting the field in the Fields to Display area, and then clicking on the Rename button (see Figure 21.6). Again click the OK button to finish this area and return to the main window.
Figure 21.6. The Advanced Field Selection dialog.
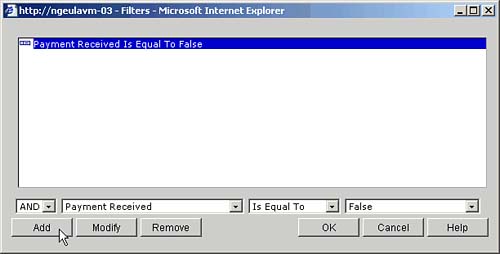
Clicking on the Filters item opens the Filter mini-dialog, which can be hidden by single-clicking on the Filters item in the toolbar. The process of adding a filter mirrors that in Crystal Reports. Choose the field to filter on in the top drop-down list and choose the operator in the next drop-down list. Then enter the value, or click the Browse button (this is represented by an ellipses […] on the button), which retrieves values from the database for that field, enabling you to select a particular value from the database if you do not remember the correct value. The Browse button might disappear if the field data type changes to a field type with limited values. For instance, a Boolean field type with only True and False values simply shows True and False in the Value drop-down list, and no longer includes a Browse button.
Remember to click the Add button on the left to add the filter to the top area of the dialog before clicking OK. Clicking OK before adding the filter is like clicking Cancel and results in no filter being applied. Once added, a filter can be modified or removed by highlighting it and then clicking on the proper button at the bottom left of the dialog box (see Figure 21.7).
Figure 21.7. The Filter dialog box.
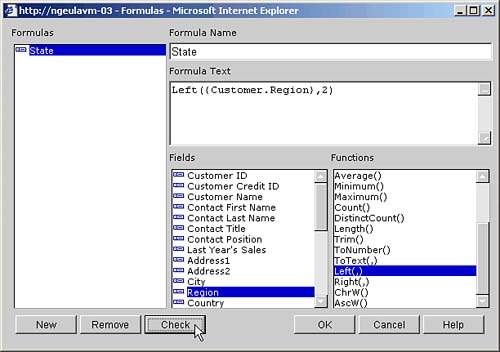
After creating the appropriate filters, you can add a formula. The formulas appear to end users as fields, and they will not know that these are calculated items. Thus if a database does not contain a necessary field for a query, but the field can be created in a formula from existing database values, the formula here can present the desired value. Clicking on the Formulas button opens a dialog (see Figure 21.8). After it opens, initiate the process by clicking on the New button on the bottom left, which enters a default formula name above at the top right that you can overwrite with the chosen field name for the formula you are about to create. By typing in a valid Crystal Reports formula in the Formula Text box, you create the desired expression. Double-clicking on either a field name or a Function name in the Fields or Functions boxes enters that value into the Formula Text dialog at the point where the cursor was last positioned in that box. For a more detailed discussion of formula syntax, refer to Chapter 4, "Understanding and Implementing Formulas," because the formulas here are exactly the same as formulas in Crystal Reports. In fact, should the report definition require very complicated formulas, the designer should either use Crystal Reports to create the report definition and save it into the correct data sources folder in Crystal Enterprise, or use the Business Views tool to create the formula in a Business View, as both Crystal Reports and Business Views feature a full formula editor. At the bottom of the left side of the dialog box are buttons to check the formula syntax and give a status on whether the formula is valid, and a Remove button, which deletes the formulas highlighted above on the left-hand side. When you've finished entering the desired formulas, choose OK.
Figure 21.8. The Formula dialog box.
Next save the definition you have created into the Crystal Enterprise system. The name you choose for the definition will be presented to end users who want to create reports based on that definition.
Although there are Query, Data, and Report tabs along the top of the screen, they are not important at this stage and are detailed in the next area. Additionally, at the top right, you have buttons to (from the left to right):
- Restart the process and clear any work you have just done
- Close the application window altogether
- View the report on which you are working
- Change preferences
- Give version information (About)
- Show the application help
The preferences enable you to do the following:
- Select default colors
- Determine which tab opens first
- Determine how the toolbar behaves in terms of whether it is docked at the left, floats in the window, or does not show up at all
- Choose whether to display mini-dialogs or the advanced dialogs initially
- Reset to default preferences
- Choose whether to use a report template to format the reports by default
- Choose how many values to show initially in the data grid
- Choose which areas to show in the Design tab.
Alternatively, creating a Business View provides much of the same capability, and should be the first method used to create data definitions for Ad-Hoc report design. However, in cases where the database administrator cannot access the Business Views tool, or where a Crystal Report has already been created and there is a need to quickly modify it into a data definition for Ad-Hoc report creation, the Report Definition process can be extremely useful.
Report Creation and Modification
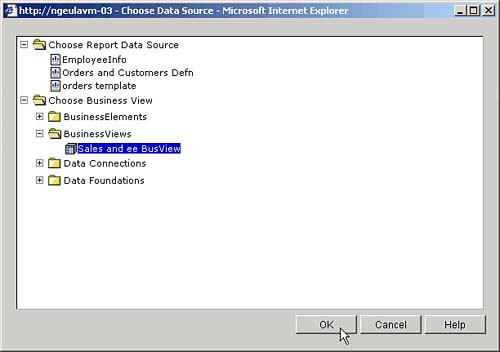
With the data definition or Business View in place, end users create reports by logging into the Ad-Hoc application, selecting the Create Ad-Hoc Report option, and then choosing the appropriate data source (see Figure 21.9). An examination of the application screen shows that the top-right area is identical to the section detailed previously, and behaves in exactly the same way. Again, most of the items on the left are also exactly the same as the section just covered, except that they do not include the same starting point. The assumption that the end user does not have database skills or desire to optimize the database query precludes those items from this end-user oriented section.
Figure 21.9. Choosing a Business View as a data source.
After choosing a Data Source, you choose Fields in exactly the same way that you chose them above. You then create groups by clicking on the Groups item on the toolbar, which behaves exactly as the Fields chooser, except the order of the groups might be more important because groups nest inside one another. Moving items up or down within the Advanced Groups dialog enables you to change the grouping order.
Again, the Filters and Formulas items mirror the previous section.
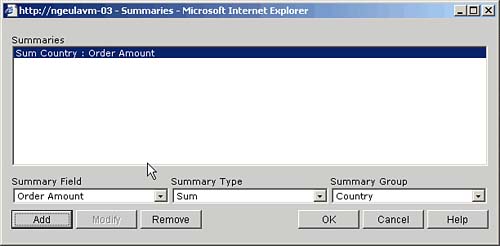
The Summaries area enables you to create summaries of values for each group and behaves exactly as the Filters dialog, except that the result is the summation of fields rather than filtering them (see Figure 21.10). You choose the field to be summarized, the type of summary desired (note that the options displayed depend on the field-type so string fields have different options than numeric and the like), and the level of the report (for example, the group name) at which the summary is desired. Again, make certain to click the Add button before clicking OK to add the summary to the report.
Figure 21.10. The Summaries dialog box.
The Report Sorting item on the toolbar defines sort orders for the report details or groups. You can enter a simple definition by selecting the field to sort on and the order (for example, ascending) in the mini-dialog. The advanced item opens a dialog box allowing more advanced sorting on groups or summaries in addition to sorting on fields. Note that multiple sorts can be created here (see Figure 21.11).
Figure 21.11. The Advanced Sort dialog box.
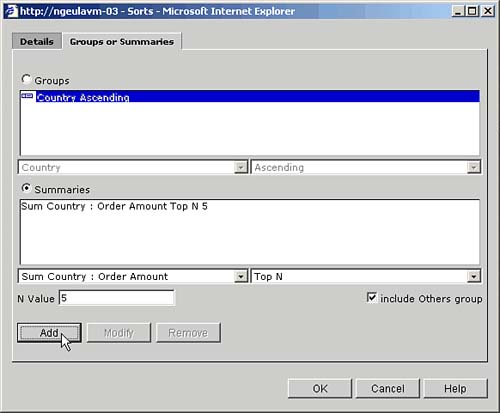
For more information on sorting options, including Top N and the like, p. 86
If you want a chart, click on the Report Chart item in the toolbar to open the Report Chart dialog box, which enables you to choose a chart type (Bar, Line, or Pie), provide a title for that chart, place it either in the report header or footer section, and if there are multiple groups or summary values, choose the appropriate values for the chart.
The Report Template item in the toolbar opens the door to one of the most advanced features in Crystal Reportsthe capability to format a report in one step. The report template dialog asks you to choose a template from several default templates, which will format the report accordingly. As you select any item in the template list in the dialog, a preview thumbnail image appears on the right giving you an indication of what the report might look like. Even more powerful is the capability to create your own templates, store them in your designated Report Templates folder (see the beginning of this chapter for more information), and then by clicking on the Templates button at the bottom left of the dialog (see Figure 21.12) apply the formatting in that report to the report you are designing, including fonts and other field formatting, headers and footers, and chart formatting.
Figure 21.12. Choosing a template to apply to the report.
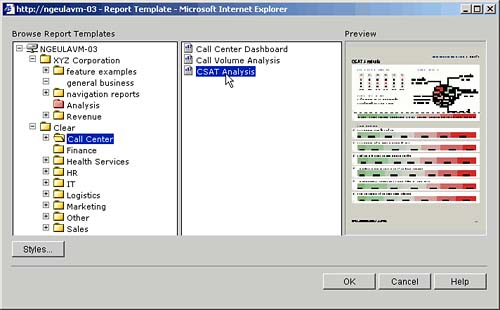
For a more complete discussion on templates, p. 296
Again, as per the previous section, end users can save this report into the folder of their choice, assuming that they have write permissions on that folder. Often end users save into their Favorites folders.
At any stage in the process end users can move to a different tab than the Query tab that you have used so far to work through different views of the material. Now this chapter takes a closer look at the Data, Design, and Report tabs.
The Data Tab
The Data tab shows you a data grid of the values selected in the report. Note that you can use this, or any other tab, while creating the report and see things develop as you add fields, filters, and the like to the report. When a report includes groups, a group tree shows on the left side of the view. This can be toggled on and off by clicking the group-tree icon at the top left of the report viewer toolbar (see Figure 21.13). Clicking on an item in the tree shows the values for that group in the display grid. The rest of the report viewer toolbar is a standard Crystal Reports toolbar with export and navigation capabilities, with two exceptions. Because the view includes row numbers, the white page with the red arrow icon (near the right side of the toolbar) enables you to navigate to a particular row number, and the Flat View icon (the second from the left) toggles between a grouped view, which enables drill-down by clicking blue-underlined values and a flat view, which has no grouping applied.
Figure 21.13. The Data tab of the Ad-Hoc application showing a group tree with several countries.
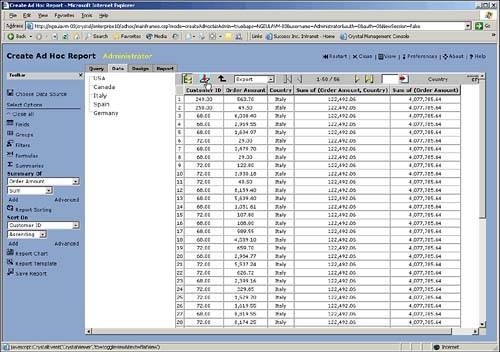
TIP
You can select information right from the grid and copy and paste it into Excel and it falls into the right row-and-column structure, which saves time for simple data transfer.
The Design Tab
Much like in Crystal Reports, the Ad-Hoc tool offers a Design tab for formatting the report in a detailed fashion. Many of the basic formatting options are available here. To move a field, click and drag it to the desired location. To select a field, click on it. You will know you have selected it when you see small gray blocks appear at the visible corners of the field. You can then move your mouse over the blocks and resize the field, or right-click on the field to access a menu that gives you formatting and alignment options. The formatting options are a subset of those in Crystal Reports and behave in exactly the same way (see Figure 21.14).
Figure 21.14. The Format dialog in the Design tab.
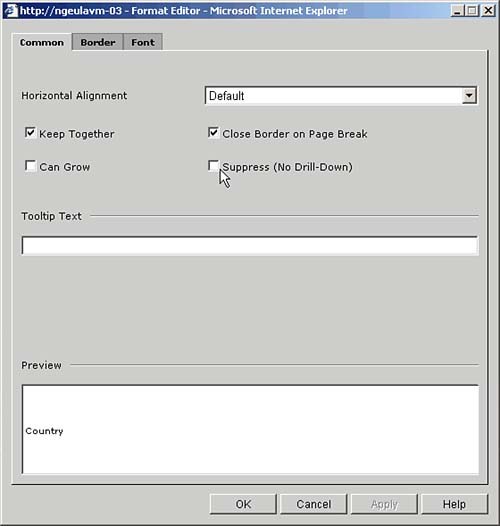
For more information on the options in the format dialog or the right-click menu, p. 155 and "Modifying Object Properties for Formatting Purposes," p. 151
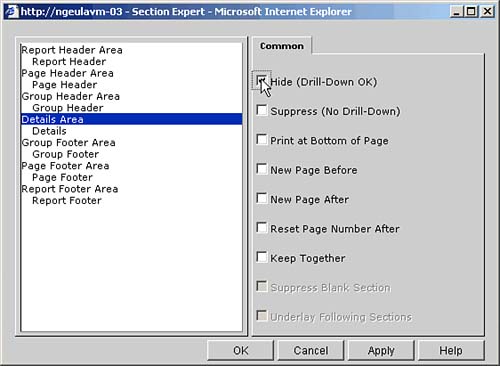
Right-clicking in a whitespace not occupied by a field, but still in the report sections, enables you to enter a text field or open the section expert. Like the section expert in Crystal Reports, you can determine here how sections should behave, and for instance, create a drill-down report section on the Web (see Figure 21.15). For a complete discussion of sections and section behavior, refer to Chapter 7, "Working with Report Sections."
Figure 21.15. The Section Expert dialog in the Design tab.
Ad-Hoc Report Design Summary
The Ad-Hoc tool provides powerful report creation and modification over the Web, with many of the core features of Crystal Reports exposed to an end user without any desktop installation. Coupled with the power of Business Views to simplify database interaction, most users can create or modify reports quite easily. Although out of scope in this chapter, the Ad-Hoc application can easily be modified to open existing reports for modification as well as the report creation capability detailed previously. The end users of this application can then share the newly created value with their colleagues by publishing their newly created or modified reports back into Crystal Enterprise directly from the Ad-Hoc application.
With the overview of the Ad-Hoc application completed, you now move to the second major Ad-Hoc tool in Crystal Enterprise, the Crystal Reports Add-in for Microsoft Excel.
Part I. Crystal Reports Design
Creating and Designing Basic Reports
- Creating and Designing Basic Reports
- Introducing the Crystal Reports Designer
- Understanding Data and Data Sources
- Introduction to the Data Explorer
- Adding Database Objects to Your Report
- Joining Database Objects Together
- Understanding the Different Join Types
- Using the Report Creation Wizards
- Understanding the Crystal Reports Gallery
- Using the Standard Report Creation Wizard
- Creating a Report Without Wizards
- Troubleshooting
Selecting and Grouping Data
- Selecting and Grouping Data
- Introduction
- Understanding Field Objects
- Working with Groups
- Understanding Drill-down Reports
- Troubleshooting
Filtering, Sorting, and Summarizing Data
- Filtering, Sorting, and Summarizing Data
- Introduction
- Filtering the Data in Your Report
- Learning to Sort Records
- Working with the Sort Expert
- Creating Effective Summaries
- Troubleshooting
Understanding and Implementing Formulas
- Understanding and Implementing Formulas
- Introduction
- Using the Formula Workshop
- Using the Workshop Formula Editor
- Creating Formulas with the Formula Expert
- Using the Formula Extractor to Create Custom Functions
- The Multi-Pass Reporting Process of the Crystal Reports Engine
- Troubleshooting
Implementing Parameters for Dynamic Reporting
- Implementing Parameters for Dynamic Reporting
- Introduction
- Understanding the Value of Parameters
- Creating and Implementing Parameters Fields
- Using Parameters with Record Selections
Part II. Formatting Crystal Reports
Fundamentals of Report Formatting
- Fundamentals of Report Formatting
- Introduction
- Positioning and Sizing Report Objects
- Modifying Object Properties for Formatting Purposes
- Exploring the Format Editor Dialog Common Options
- Combining and Layering Report Objects
- Configuring Report Page and Margin Properties
Working with Report Sections
- Working with Report Sections
- Introduction
- Formatting Report Sections
- Modifying Report Section Properties
- Using Multiple Report Sections
- Troubleshooting
Visualizing Your Data with Charts and Maps
- Visualizing Your Data with Charts and Maps
- Introduction to Charts and Maps
- Using the Chart Expert
- Using the Map Expert
- Modifying Chart and Map Properties
- Troubleshooting
Custom Formatting Techniques
- Introduction
- Making Presentation-Quality Reports
- Common Formatting Features
- Conditional Formatting Using Data to Drive the Look of a Report
Part III. Advanced Crystal Reports Design
Using Cross-Tabs for Summarized Reporting
- Using Cross-Tabs for Summarized Reporting
- Introduction to Cross-Tabs
- Benefits of Cross-Tabs
- Using the Cross-Tab Wizard
- Using Top N with Cross-Tabs Reports
- Using Advanced Cross-Tab Features
Using Record Selections and Alerts for Interactive Reporting
- Using Record Selections and Alerts for Interactive Reporting
- Creating Advanced Record Selection Formulas
- Adding Alerting to Your Reports
- Performance Monitoring and Tuning
Using Subreports and Multi-Pass Reporting
- Using Subreports and Multi-Pass Reporting
- Understanding Subreports
- Understanding Linked Versus Unlinked Subreports
- Considering Subreport Execution Time and Performance
- Using Variables to Pass Data Between Reports
- Emulating Nested Subreports
- Troubleshooting
Using Formulas and Custom Functions
- Using Formulas and Custom Functions
- Becoming More Productive with Formulas
- Choosing a Formula Language: Crystal Versus Basic Syntax
- Using Brackets in Formulas
- Using Characters in Formulas
- Recent Improvements to Formulas
Designing Effective Report Templates
- Designing Effective Report Templates
- Understanding the Importance of Reuse in Reporting
- Understanding Report Templates
- Using Report Templates
- Using Existing Crystal Reports as Templates
- Understanding How Templates Work
- Creating Useful Report Templates
- Using Template Field Objects
- Using Report Templates to Reduce Report Creation Effort
- Applying Multiple Templates
Additional Data Sources for Crystal Reports
- Additional Data Sources for Crystal Reports
- Understanding the Additional Crystal Reports Data Sources
- Connecting to COM-based Data Sources
- Connecting to Java-based Data Sources
- Understanding Solution Kits for Crystal Enterprise
- Troubleshooting
Multidimensional Reporting Against OLAP Data with Crystal Reports
- Multidimensional Reporting Against OLAP Data with Crystal Reports
- Introduction to OLAP
- OLAP Concepts and OLAP Reporting
- Recently Added or Changed OLAP Features in Crystal Reports
- Using the OLAP Report Creation Wizard and OLAP Expert
- Advanced OLAP Reporting
- Introduction to Crystal Analysis
Part IV. Enterprise Report Design Analytic, Web-based, and Excel Report Design
Introduction to Crystal Repository
- Introduction to Crystal Repository
- What Is the Crystal Repository?
- Why Implement the Crystal Repository?
- Installing the Crystal Repository
- Adding Objects to and from the Repository
- Migration of the Crystal Enterprise Repository
- Troubleshooting
Crystal Reports Semantic Layer Business Views
- Crystal Reports Semantic Layer Business Views
- Introduction to Business Views
- Why Implement Business Views?
- Performance and Implementation Considerations
- Business Views Architecture and Implementation
- Troubleshooting
Creating Crystal Analysis Reports
- Creating Crystal Analysis Reports
- Introduction
- Introducing Crystal Analysis
- Accessing OLAP Data with Crystal Analysis
- Designing Crystal Analysis Reports and Applications
- Adding Crystal Analysis Objects to a Report
- Troubleshooting
Advanced Crystal Analysis Report Design
- Advanced Crystal Analysis Report Design
- Introduction
- Advanced Crystal Analysis Designer Tools
- Custom Calculations and Advanced Data Analysis
- Setting Report Options
- Troubleshooting
- Crystal Analysis in the Real World MDX
Ad-Hoc Application and Excel Plug-in for Ad-Hoc and Analytic Reporting
- Ad-Hoc Application and Excel Plug-in for Ad-Hoc and Analytic Reporting
- Introducing Ad-Hoc Reporting Conceptually
- Introducing the Crystal Enterprise Ad-Hoc Reporting Application
- Crystal Reports Excel Plug-in
- Crystal Analysis Excel Plug-in
Part V. Web Report Distribution Using Crystal Enterprise
Introduction to Crystal Enterprise
- Introduction to Crystal Enterprise
- What Is Crystal Enterprise?
- Why Implement a Crystal Enterprise Solution?
- Versions of Crystal Enterprise
- Understanding the Core Functions of Crystal Enterprise
Using Crystal Enterprise with Web Desktop
- Using Crystal Enterprise with Web Desktop
- Introduction
- Crystal Enterprise User Launchpad
- Crystal Enterprise Web Desktop
- Customizing the Web Desktop and Report Viewers
- Publishing to the Web Desktop
- Customizing the Web Desktop
- Troubleshooting
Crystal Enterprise Architecture
- Crystal Enterprise Architecture
- Introduction
- Crystal Enterprise Architecture Overview
- The Client Tier
- The Application Tier
- The Server Tier: Introduction to the Crystal Enterprise Framework
- The Server Tier: Overview of the Crystal Enterprise Services
- The Data Tier
- The Crystal Enterprise Architecture in Action
- Taking Advantage of the Crystal Enterprise Distributed Architecture
- Extending Crystal Enterprise
Planning Considerations When Deploying Crystal Enterprise
- Planning Considerations When Deploying Crystal Enterprise
- Ensuring a Successful Crystal Enterprise Implementation
- Approaching the Project
- Identifying Business Pain
- Establishing Project Requirements
- Understanding Organizational Reporting Requirements
- Troubleshooting
Deploying Crystal Enterprise in a Complex Network Environment
- Deploying Crystal Enterprise in a Complex Network Environment
- Introduction
- Understanding Network Protocols
- Understanding Firewall Types
- Configuring the Crystal Enterprise Architecture for Your Network Environment
- Interaction Between the WCS and the WC
- Deploying Crystal Enterprise with an IP Packet Filtering Firewall
- Using Crystal Enterprise with NAT
- Exploring the NAT and Crystal Enterprise Relationship
- Crystal Enterprise and Proxy Servers
Administering and Configuring Crystal Enterprise
- Introduction
- Using the Crystal Management Console
- Managing Accounts
- Managing Content
- Introducing Servers
- Managing Crystal Enterprise System Settings
- Using the Crystal Configuration Manager
Part VI. Customized Report Distribution Using Crystal Reports Components
Java Reporting Components
- Java Reporting Components
- Overview of the Crystal Reports Java Reporting Component
- Understanding the Java Reporting Components Architecture
- Differences with the Java Reporting Engine
- Configuring the Application Server
- Delivering Reports in Web Applications
- Using the Crystal Tag Libraries
- Exporting Reports to Other File Formats
- Printing Reports from the Browser
- Common Programming Tasks
- Troubleshooting
Crystal Reports .NET Components
- Crystal Reports .NET Components
- Understanding Microsofts .NET Platform
- Understanding the Different Crystal .NET Components
- An Overview of the Crystal Reports 10 .NET Components
- The Report Designer
- The Report Engine Object Model
- Delivering Reports with the Windows Forms Viewer
- Delivering Reports with the Web Forms Viewer
- Database Credentials
- Setting Parameters
- Troubleshooting
COM Reporting Components
- COM Reporting Components
- Understanding the Report Designer Component
- Building Reports with the Visual Basic Report Designer
- Programming with the Report Engine Object Model
- Delivering Reports Using the Report Viewer
- Troubleshooting
Part VII. Customized Report Distribution Using Crystal Enterprise Embedded Edition
Introduction to Crystal Enterprise Embedded Edition
- Introduction to Crystal Enterprise Embedded Edition
- Introduction to Crystal Enterprise Embedded Edition
- Understanding Crystal Enterprise Embedded Edition
- Crystal Enterprise Embedded Edition Samples
- DHTML Report Design Wizard
- Troubleshooting
Crystal Enterprise Viewing Reports
- Crystal Enterprise Viewing Reports
- Viewing Reports over the Web
- Introduction to the Crystal Report Viewers
- Understanding the Report Source
- Implementing the Page Viewer
- Implementing the Part Viewer
- Implementing the Interactive Viewer
- Implementing the Grid Viewer
- Troubleshooting
Crystal Enterprise Embedded Report Modification and Creation
- Introduction
- Deploying RAS Environments
- Loading Report Files
- Locating RAS Components in a Network Architecture
- Installing the RAS SDK
- Best Practices in RAS Exception Handling
- The RAS SDK in Action
Part VIII. Customized Report Distribution Using Crystal Enterprise Professional
Introduction to the Crystal Enterprise Professional Object Model
- Introduction to the Crystal Enterprise Professional Object Model
- Understanding the Crystal Enterprise Object Model
- Establishing a Crystal Enterprise Session
- Querying the Crystal Enterprise Repository
- Viewing Reports
- The Crystal Enterprise Java SDK
- Accessing the Java SDK
- Troubleshooting
Creating Enterprise Reports Applications with Crystal Enterprise Part I
- Creating Enterprise Reports Applications with Crystal Enterprise Part I
- Advanced Scenarios with the Crystal Enterprise Object Model
- Scheduling Reports
- Scheduling to a Destination
- Using Crystal Enterprise Notifications
- Scheduling to a Server Group
- Scheduling to a Specific Format
- Setting Database Credentials
- Troubleshooting
Creating Enterprise Reporting Applications with Crystal Enterprise Part II
- Creating Enterprise Reporting Applications with Crystal Enterprise Part II
- Querying the Crystal Enterprise InfoStore
- Creating and Responding to Crystal Enterprise Alerts
- Creating Schedulable Program Objects
- Troubleshooting
Appendix A. Using Sql Queries In Crystal Reports
Creating Enterprise Reporting Applications with Crystal Enterprise Part II
EAN: 2147483647
Pages: 341
