Reducing Lead Time and Non-Value-Add Cost
Overview
Purpose of these tools
- To eliminate capacity constraints in a process
- ensure that the process can meet customer demand
- To reduce the lead time and cost of a process
- eliminate non-value-add cost and waste to improve process efficiency and profitability
Deciding which tool to use
Review the Basic concepts and definitions of Lean (p. 199). Then:
- Determine where and how time is used in your process:
- Identify process steps as value-add or non-value-add (in the eyes of the customer), see Chapter 3, p. 49
- Calculate the Total Lead Time (also known as process cycle time) for the process), p. 199
- Determine the desired average completion rate (customer demand rate, or takt rate), p. 200)
- Calculate the Process Cycle Efficiency, p. 201
- Locate and quantify the time traps and capacity constraints, pp. 203 to 206
- Compute the Workstation Turnover Times, p. 202
- Incorporate the data into your Value Stream Map (Chapter 3, p. 45)
The choice of tool or method to improve process flow and speed depends on what type of problem(s) you find after completing the value stream map (VSM).
- Process produces too much compared to customer demand
- Implement a Replenishment Pull System to link output directly to customer demand (in conjunction with a Generic Pull System), p. 216
- Calculate and adjust batch sizes to the minimum safe batch size to meet customer demand, p. 222
- Implement a Replenishment Pull System to link output directly to customer demand (in conjunction with a Generic Pull System), p. 216
- Process is not producing enough compared to customer demand
- Attack capacity constraints. Focus on removing non-value-add work through variation reduction (see Chapter 7 and use of the following tools covered in this chapter:
- Setup reduction, total productive maintenance, mistake proofing, process balancing
- Attack capacity constraints. Focus on removing non-value-add work through variation reduction (see Chapter 7 and use of the following tools covered in this chapter:
- Process is meeting customer demand but has long total lead times and high overhead cost
- Use 5S to improve the cleanliness and organization of workspace, p. 206. This is a basic technique that should be used in every workspace.
- Implement a Generic Pull System to stabilize, and then reduce, the number of "Things In Process," thus reducing total lead time so that follow-on improvements will have maximum benefit, p. 213.
- Reduce batch sizes to the minimum safe batch size for the given process parameters, p. 222.
- Apply Lean and Six Sigma improvement techniques as necessary to time traps in sequence from those injecting the most to the least delay
- If time trap is a non-value add step (p. 49), eliminate it
- If long setup or changeover times are an issue, implement the Four Step Rapid Setup method (p. 223)
- If downtime is the problem, use total productive maintenance (p. 229)
- If errors are causing rework, see mistake proofing (Poka-Yoke, etc.) (p. 233)
- If workload of process steps is uneven, apply process balancing principles to move work around (p. 235)
- If there is variation in demand, compute a safety stock, (p. 218)
- If there is too much variation, review Chapter 7
- Process steps have uneven workload leading to labor inefficiencies
- Use process balancing (p. 235)
- Process involves much movement of information/material; process flow is inefficient
- Use process flow improvement to reduce distance and time between process steps. See process maps in Chapter 3 or work cell optimization (p. 235)
- Process flow is efficient, but has too much non-value-add time
- Use value-add time analysis (Chapter 3, p. 49) to pin-point and quantify non-value-added time in process steps, then Lean and Six Sigma methods as needed to implement solutions
Once you've implemented these improvements, use Visual Process Controls, p. 237, to maintain the gains.
Basic Lean concepts
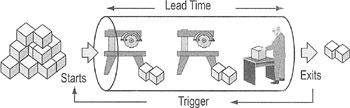
Total Lead Time (also called process cycle time, process lead time, or total cycle time): the time from when a work item (product, order, etc.) enters a process until it exists.
- Ex: Total Lead Time of a mortgage refinancing process could be measured as the elapsed time from when a homeowner calls to when the mortgage refinancing closes (average = 33 days)
Things-in-Process (TIP) or Work-In-Process (WIP): Any work item that has entered the process and not yet exited. The "work" can be anything: materials, orders, customers, assemblies, emails, etc.
- Ex: There were 3300 refinance applications in process at the end of the month
Average Completion Rate (Exit Rate or Throughput): The output of a process over a defined period of time.
- Ex: Average completion rate of the mortgage process = 100 mortgage refinance applications closed per day last month.
Capacity: The maximum amount of product or service (output) a process can deliver over a continuous period of time.
- Ex: The capacity of our process is 120 mortgage applications per day
Take Rate (customer demand rate): The amount of product or service required by customers over a continuous period of time. Processes should be timed to produce at the takt rate. Any lower and you will be disappointing customers; any higher and you will be producing output that cannot be used.
- Ex: The takt rate for mortgage applications is 130 applications per day
Time Trap: Any process step (activity) that inserts delay time into a process.
- Ex: data entry clerks gather up all mortgage applications for an entire day before entering them into the computer system—this causes delays for the mortgages received during the day, which is a time trap
Capacity Constraint: An activity in the process that is unable to produce at the completion (exit) rate required to meet customer demand (takt rate).
- Ex: Property appraisers can evaluate 120 properties per day, but customer demand is currently 130 applications per day—appraisers are a capacity constraint
Value-add (VA) time: any process step or activity that transforms the form, fit, or function of the product or service for which the customer is willing to pay
- Ex: The sum of the value-add times in the mortgage refinancing process is 3.2 hours
Non-value-add (NVA) cost: Waste in a process. Customers would be willing to buy a product or service that did not have these costs if it meant a lower price.
- Ex: having to print out the refinancing paperwork and walk it over to the appraiser's mailbox is non-value-add—everything should be electronic
See also p. 49 for more on value-add and non-value-add concepts, and the next section for metrics associated with Lean.
Metrics of time efficiency
The purpose of the tools in this chapter is to improve how time and energy are spent in a process. The three metrics described here can help you identify the sources and impact of inefficiency.
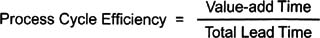
1 Process Cycle Efficiency (PCE)
The best measure of overall process health is Process Cycle Efficiency (PCE), the percentage of value-add time (work that changes the form, fit, or function as desired by the customer).
You can either measure total lead time directly by measuring the time it takes "things in process" to transit the process, or use Little's Law (see next page) to determine an average.
- PCE indicates how efficiently the process is converting work-in-process into exits/completions.
- Any process with low PCE will have large non-value-add costs and great opportunities for cost reduction. You can find these opportunities with a value stream map (p. 45). PCEs of less than 10% are common pre-improvement.
- The only way you can improve PCE is to get rid of non-value-add work and costs.
2 Little's Law
One component of PCE is Total Lead Time, which can be described by Little's Law:
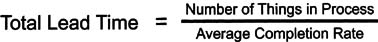
This shows how lead time is related to the number of things in process (TIP, also known as WIP) and the completion (exit) rate of the process.
To improve Total Lead Time, and in turn PCE, either increase capacity (average completion rate) and/or reduce TIP or WIP.
3 Workstation Turnover Time
Workstation Turnover Time (WTT) for a given process step or workstation is the amount of time needed to set up and complete one cycle of work on all the different "things" (work items, SKUs) at that step. WTT is important in improvement efforts because it helps highlight which process step (time trap) to work on first.
Calculating WTT for a process step
WTTk=Σ[(Setup Timei) + (Process Timei * Batch Sizei)]
- k = the process step (activity) in the process
- i = 1 to n (the number of things worked on at that process step)
Time Traps vs Capacity Constraints
Recap of useful definitions
Capacity: The maximum output a process can deliver over a continuous period of time
Capacity Constraint: An activity in a process that is unable to produce at the exit rate required to meet customer demand
Time Trap: Any process step that inserts delay into a process
Time traps
- Time traps insert delays into a process.
- They are sometimes erroneously labeled bottlenecks. The term "bottleneck" is imprecise because it does not distinguish between steps that inject delays (time traps) and those that cannot operate at required levels (capacity constraints)
- Time traps can create long lead times, large downstream inventories, and large amounts of WIP—but may not in fact be a capacity constraint
- Time traps are caused by poor management policies (such as launching batche sizes far larger than the minimum required), long setup times, machine or human downtime, or quality problems
- Time traps can change over time (monthly, weekly, even daily) based upon product mixes or special causes (new product introductions, special orders, etc.).
Focus on identifying time traps if the goal of your project is to improve efficiencies (in inventory, lead time, output rates, etc.). Work on the time trap that is injecting the most amount of delay into your process first.
Capacity constraints
- Capacity constraints limit the capacity of the process as measured in units per hour
- Capacity constraints often have less capacity than previous or subsequent steps/operations.
- Capacity constraints can change over time (monthly, weekly, even daily) based on product mixes or special causes (new product introductions, special orders, etc.).
Focus on identifying capacity constraints if the goal of your project is to increase output to meet real customer demand.
Attacking time traps and capacity constraints
- Fix the capacity constraints first so that you can meet customer demand; then attack time traps
- You can eliminate capacity constraints and time traps only through data and calculation. Relying on intuition will lead you astray.
Identifying Time Traps and Capacity Constraints
Purpose
To quantify how much time delay each step or activity introduces into the process
How to identify traps and capacity constraints Method 1
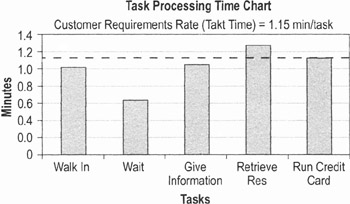
The basis of capacity constraint identification is takt rate (customer demand rate) analysis, which compares the task time of each process (or process step) to:
- Each other, to determine time traps
- Customer demand, to determine if the time traps are capacity constraints
Step 1: Gather needed data
Determine:
- Aggregate customer demand (units/time)
- Net operating time available = Gross Operating Time minus breaks, lunch, etc.
- Net resource capacity (units/time) by process step = Average output over time
Step 2: Calculate takt rate (customer demand)
Takt rate = (number of units to process)/(net operating time available)
Takt time = inverse of takt rate (net operating time available)/(number of units to process)
Step 3: Analyze the figures
- The process step with a net resource capacity closest to the takt rate is the Time Trap
- If the time trap does not have enough net resource capacity to meet customer demand, it is also a capacity constraint
How to identify time traps and capacity constraints, Method 2
To determine which process step is the biggest time trap, simply calculate WTT for each step in the process. Here's the WTT equation from p. 201:
WTTk=Σ[(Setup Timei) + (Process Timei * Batch Sizei)]
The step with the longest WTT is the time trap that is injecting the most amount of delay into the process.
Taking action
Examine the data you plugged into the WTT equation for the Time Trap. If the problem lies in setup time, use the Four Step Rapid Setup Method (p. 223); for Process Time, use 5S (see below) and other flow-improvement tools. Review Batch Sizing principles on p. 222 if that is the problem. Once improvements have been made, find the new "biggest" time trap and continue until you've reached your improvement goals.
S Overview
Purpose
To create and maintain an organized, clean, safe, and high-performance workplace.
- 5S enables anyone to distinguish between normal and abnormal conditions at a glance.
- 5S is the foundation for continuous improvement, zero defects, cost reduction, and a safe work area.
- 5S is a systematic way to improve the workplace, processes, and products through production line employee involvement.
Definitions
Sort: Clearly distinguish needed items from unneeded items and eliminate the latter
Set in order (also known as Simplify): Keep needed items in the correct place to allow for easy and immediate retrieval
Shine (also known as Sweep): Keep the work area swept and clean
Standardize: Standardized cleanup (the first three S's)
Sustain (also known as Self-Discipline): Make a habit of maintaining established procedures
When to use 5S
- Whenever a workplace is messy, unorganized
- Whenever people have to spend time tracking down tools, information, etc., required to complete a task
- In any of the DMAIC phases; best implemented.…
- In manufacturing, as one of the first Improve actions, because it will make other tools such as setup reduction more efficient
- In office environments as a later Improve step or as part of standardization and cross-training in Control
Implementing 5S
S1 Sort
Goal: Remove all items from the workplace that are not needed for current production or tasks.
- It does not mean that you remove only the items that you know you will never need
- It does not mean that you simply arrange things in a neater fashion
- When you sort, you leave only the bare essentials—"When in doubt, move it out"
- Identify, "red tag," the move potentially unneeded items: Question the need for each item in that quantity in the workplace. Typical items marked for removal include:
- Unneeded files, paperwork, reference manuals
- Defective, excess, or unneeded items that accumulate
- Outdated or broken tools, supplies, or inspection equipment
- Old rags and other cleaning supplies
- Non-working electrical tools/equipment
- Outdated posters, signs, notices and memos
Put a red tag on any item that is not essential to doing the work and move it to a holding area. (An example tag is shown below.)
RED TAG
Red Tag No.
Date Tagged
Department
Category
1
Inventory
2
Machines and Other Equipment
3
Dies, jigs, and fixtures
4
Tools and supplies
5
Other (Explain)
Item
Description
Qty.
Total Value $
Desposition/Evaluation
Date
a
Moved to Red Tag Location
b
Disposed of
c
Moved to More Suitable Location
d
Left Exactly Where It Was
- Evaluating and dealing with red-tagged (unneeded) items
After one week in a holding area, tagged items should be:
- Disposed of, if determined unnecessary—sold, relocated, thrown away
- Kept, if determined necessary
S2 Set in order (Simplify)
Set in order means to arrange needed items in the area and to identify or label them so that anyone can find them or put them away.
GOAL: To arrange all needed work items in line with the physical workflow, and make them easy to locate and use
1 Draw a current-state map
Show the location of all materials, supplies, forms, etc., needed in this workspace.
2 Draw a future-state map
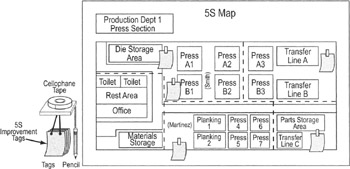
Draw a picture of how you think the workspace could be laid out for better efficiency and effectiveness. Make the map large enough so people can post improvement ideas on "5S tags." The new map should…
- Be based on the principles of motion economy (everything is within arm's reach, body motion kept to a minimum, stored in the sequence used, etc.)
3 Visually organize the workplace
- Draw borders to differentiate work areas: Draw a line around an item to identify its area/boundaries. Be sure to high-light: traffic lanes, stationary items, paths covered by mobile items, walkways, surface items
- Provide a "home address" for each bordered area. This is often a sign on the "shadowboard" at the item's home, describing what belongs inside the border. Label should include the item name, location, and a picture/silhouette (optional)
- Put a corresponding label on each item (tool, piece of equipment, etc.). The label should include name of item and item's home address.
S3 Shine
Shine emphasizes removing the dirt, grime, and dust from the work area. This is a program of keeping the work area swept area swept and clean of debris.
1 Determine the shine targets
Think about…
- Safety—Report unsafe conditions, clean up spills on floor
- Waste—Empty trash can, remove excess supplies from area
- Cleanliness—Sweep floor, place tools on shadowboard
2 Set a housekeeping schedule and assign responsibilities
List responsibilities in detail, including which areas to be cleaned, at which times of the day, and what "cleaning" involves. Assign responsibility for completing housekeeping chores.
|
IT Dept Housekeeping Assignments Week Ending ___/___/___ |
|||||||
|---|---|---|---|---|---|---|---|
|
Task |
Assigned To |
Mon |
Tue |
Wed |
Thu |
Fri |
Comments |
|
IT Request Inbox |
Daily |
||||||
|
Computers in Setup |
Daily |
||||||
|
Supply Table |
Weekly |
||||||
|
Repairs/Swaps |
Weekly |
||||||
|
Swap Cabinet |
Weekly |
||||||
|
Consumables: |
Daily |
||||||
|
Paper for Printer |
Daily |
||||||
|
Printer Cartridge |
Daily |
||||||
|
Blank CDs |
Daily |
||||||
|
Floppy Diskc |
Daily |
||||||
|
Office Furniture |
Weekly |
||||||
|
Priority Board |
Daily |
||||||
|
Archive (Equip List) |
Daily |
||||||
3 Create procedures for continued daily shine processes
Create a table that shows which housekeeping tasks must be performed, how often, and by whom.
4 Set periodic inspection and targets for machinery, equipment, computers, furnishings, etc.
S4 Standardize
Standardize mean creating a consistent way of implementing the tasks performed daily, including Sort, Set in order, and Shine. It means doing "the right things the right way, every time."
Tips for standardize
- Review procedures conducted for Sort, Set in Order, and Shine and incorporate elements into the everyday work activity
- It should be obvious at a glance when an item is not in its designated place
- Use Visual Process Controls and any other appropriate visual clues that help people keep everything where it should be
- Schedule 5S activities frequently enough to maintain a clean, orderly, and safe work environment.
- Create 5S Agreements to reflect decisions about which employees in the workplace will have what responsibilities
Elements of a 5S agreement
- Defines how a task should be done and the best way to do it
- Documents the procedures and guidelines for Sorting, Simplifying, Sweeping
- Guidelines on what visual controls to use; workplace arrangement standards
- Item and quantity requirements
- Schedules, including housekeeping standards
- Documents process steps and other operating instructions
- Documents all job aids (user guides, reference materials, trouble-shooting guides)
S5 Sustain
Sustain means that the 5S program has a discipline that ensures its continued success.
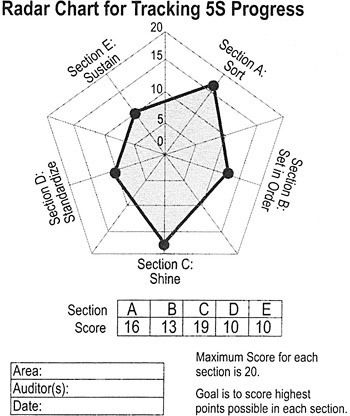
- Create 5S audit form or radar chart for summarizing results. Establish a company standard for the format.
- Establish periodic schedule for conducting audits
- Minimum of weekly for area supervision, monthly for management
- Participation of management in reviewing and using checklists is critical
5S audit sheet
A.
Sort
0
1
2
3
4
5
1>
Are there unnecessary items (peripherals, supplies) on the setup desk
X
2>
Are there scrap supplies in the supply bins
X
3>
ARE there old computers (off lease) in the swap cabinet
X
4>
Is there more furniture than necessary in the office
X
Score
0
0
0
0
0
20
B.
Set in Order
0
1
2
3
4
5
5>
Is the supply table arranged per drawing/layout
X
6>
Is setup desk arranged per layout (incl. a single computer)
X
7>
Is swap cabinet arranged per layout
X
8>
Can ANYONE determine normal from abnormal
X
Score
0
0
0
0
0
20
C.
Shine
0
1
2
3
4
5
9>
Is the desk clean and maintained or is there clutter (unnecessary supplies, etc.)
X
10>
Is Supply Table/Bins clean and organized
X
11>
Has the shine check sheet been updated (assignments been worked)
X
12>
Is dust filter clean
X
Score
0
0
0
0
0
20
D
Standardize
0
1
2
3
4
5
13>
Is the IT Dept Process Handbook in plain view
X
14>
Is the IT Dept Process Handbook updated
X
15>
ARE all supply bin, swap cabinet, and software shelf labels intact
X
16>
Have all setups gone accordingly to instructions this week
X
Score
0
0
0
0
0
20
E.
Sustain score
0
1
2
3
4
5
17>
Was the last audit less than two weeks ago
X
18>
Was the last departmental audit less than one month ago
X
19>
Is the 5S board up to date (pics, metrics, shine, etc.)
X
20>
Has anyone complemented the area on its cleanliness & organization
X
Score
0
0
0
0
0
20
Area:
Auditor(s):
Section
A
B
C
D
E
Date:
Sub-total Score
20
20
20
20
20
- Establish checklist for visitors to review
- With 5S, ANYONE should be able to tell the difference between normal and abnormal conditions
- Celebrate accomplishments and continue improving
- Keep everyone aware of 5S and its benefits by giving recognition where it is due
- Make time each week to brainstorm and implement improvement suggestions
Generic Pull System
Purpose
To place a limit, or cap, on the maximum number of things or work in process (TIP or WIP), so that the lead time is known and predictable (see Little's Law, p. 201). You can then apply improvement tools to reduce TIP or WIP by eliminating the effects of variation and batch size.
When to use a Generic Pull System
Whenever lead times are critical to satisfy customers and when non-value-add cost is significant compared to value-add cost.
How to create a Generic Pull System
Part 1: Determine the WIP Cap
(maximum amount of work or things that should be in process at any given time)
- Determine current Total Lead Time(TLT)
- Option 1: Track individual work items through the process to measure lead time
- Option 2: Use Little's Law (p. 202) to get an average lead time
- Determine current Process Cycle Efficiency (PCE)
(See p. 201 for more on PCE)
- Identify target PCE. The target PCE is the level at which the process should be operating based on "world-class" levels. If current PCE is&
<< low end, multiply current PCE by 10 (one order of magnitude improvement) for use as target PCE < low end, use low-end figure as target PCE = or > low end, use high end as target PCE >> high end, move towards one-piece flow
Application
Typical (low end)
World-Class (high end)
Machining
1%
20%
Fabrication
10%
25%
Continuous Manufacturing
5%
30%
Business Processes (Service)
10%
50%
Business Processes (Creative/Cognitive)
5%
25%
- Calculate target lead time for the process. Target lead time is the "best" or lowest process cycle time achievable based on the process characteristics.

- Calculate WIP cap
Determine the maximum WIP allowed within the process at any time.

Part 2: Releasing work into the system
Typically the current WIP level will be significantly greater than the WIP Cap level. Therefore, you need a plan to reduce current WIP and to release work into the system to match the exit rate.
- Count the WIP in your process
- Determine if you can release work or not:
- If the WIP ≥ WIP Cap, do not release any more work
- If this will harm customers your options are to temporarily increase capacity in order to lower the amount of WIP, or perform a triage of current WIP to see if some work can be set aside to make room for new work (see Step 4 for details on triaging)
- If current WIP < WIP Cap, release enough work to get to the WIP Cap
- If the WIP ≥ WIP Cap, do not release any more work
- Identify how you will know when more work can be released into the system
Caution as the PCE of a process approaches world-class levels, the effects of variation are magnified. Be careful not to reduce the TIP or WIP too much before addressing issues with variability, or a process step could be "starved" for work, creating a constraint!
- Create a triage system for determining the order in which future work will be released into the system
- Option 1: First-In, First-out (FIFO)— whatever comes in first gets processed first. This is commonly used in manufacturing to prevent obsolescence or degradation of supplies/materials.
- Option 2: Triaging— working on highest-potential items first. Not all customer requests or orders, for example, represent the same level of potential for your company. You need to set up criteria for rating or ranking new work requests so you can tell the difference between high-and low-potential requests. This is often used in sales and other service applications.
- Alternative to triage if you have the capacity for parallel processing: You can reduce the queue by shifting work from an overloaded step onto another step or adding/shifting resources intelligently. See Queue time formula, p. 222.
- Develop and implement procedures for maintaining the generic pull system
- Identify the person with authority to release work into the process
- Develop signals, alerts, or procedures that will tell that person when WIP has fallen below the Cap (so s/he will know when to release the work)
Ex: When people complete a work item, have them send an alert card or email to the "control" person (such as Kanban cards you often find in manufacturing)
- Train people in the new procedures
- Develop a plan to cover the transition period from the current high-WIP state to future WIP cap state
- Implement and monitor results; adjust as needed
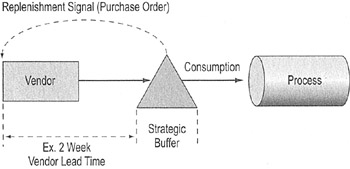
Replenishment Pull Systems
Purpose
To eliminate shortages or overstocking of supplies by creating a system where items are automatically replaced as they are used up.
When to use a Replenishment Pull System
Use a replenishment pull system for in-process or end-item products, supplies, consumables (or any other item for which shortages and stockouts are not acceptable), which meet the following criteria:
- Usage on the item is repetitive
- Demand for the item is relatively consistent (low variability)
- Stocking shortages have a significant impact on service levels to the customer (internal or external)
A replenishment pull system should never be installed without a Generic Pull System already in place.
How to create a replenishment pull system
- Determine work demand rate (DMD):
- Average weekly or average daily usage
- Base on history, forecast (backlog) or a combination
-
Warning historical usage may not reflect coming changes in the business (product or service mix, volume increases, etc.) So often a combination of factors should be considered.
- Recalculate frequently in order to capture changes
- Average weekly or average daily usage
Handling seasonality
- Resize monthly if demand changes passes a "hurdle rate" (such as if demand changes > 20%)
- Use historical data or forecasts to determine signals that mean a resizing is necessary
- Forecast window should be at least the average Lag Time weighted by volume to account for lag times between demand and order receipt
- Use historical/future demand weighting tools to smooth ramps-ups/downs
- Larger upswings >> higher weighting in forecast
- Smaller upswings >> lower weighting on forecast
- Determine Replenishment Lead Time (LT) and Order interval (OI)
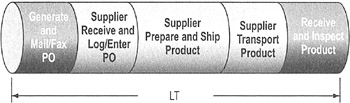
- Replenishment lead time (LT): the time from when a part or supply has been consumed until new supplies are received (replenishment time)
- For purchased items such as supplies, etc., add together: (1) Time to generate a purchase order, (2) Supplier lead time, (3) Transportation time, and (4) Receiving/inspection/stocking time
- For manufactured items, add together: (1) time to generate the Work Order, (2) Total process lead time, and (3) Receiving/inspection time
- Order interval (OI): Can be expressed as either the interval between orders (days, weeks) or the order quantity (items) to be purchased
- Changing OI allows trade-offs between transactions, capacity and inventory
- Replenishment lead time (LT): the time from when a part or supply has been consumed until new supplies are received (replenishment time)
- Determine optimal Safety Stock (SS) level
There are many ways to calculate safety stock. This method is based on empirical computations and experience.
- Key Assumption: The demand profile is normally distributed.
Safety Stock = σ*service level*(LT)β
Where.&
- Demand variability = standard deviation (σ). See p. 108 for formulas for calculating standard deviation.
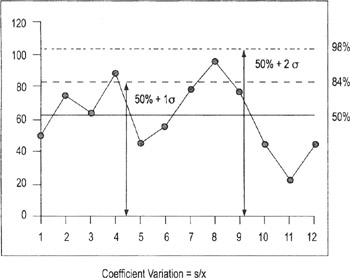
- Desired service level (stockout coverage) = the number of standard deviations, relative to the mean, carried as safety stock. For example:
- Service Level = 1 means that one standard deviation of safety stock is carried, and on average there will be no stockouts 84% of the time
- Service Level = 2 means that two standard deviations of safety stock is carried, and on average there will be no stockouts 98% of the time
- Lead Time (LT) = Replenishment lead time
- β = a standard lead time reduction factor (set at 0.7)
- The coefficient of variation = σ/Xbar
- Key Assumption: The demand profile is normally distributed.
Other useful formulas
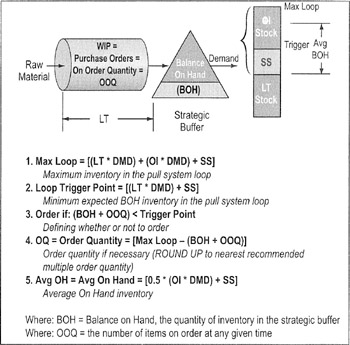
- Max Loop = [(LT * DMD) + (OI * DMD) + SS]
Maximum inventory in the pull system loop
- Loop Trigger Point = [(LT * DMD) + SS]
Minimum expected BOH inventory in the pull system loop
- Order if: (BOH + OOQ) < Trigger Point
Defining whether or not to order
- OQ = Order Quantity = [Max Loop − (BOH + OOQ)]
Order quantity if necessary (ROUND UP to nearest recommended multiple order quantity)
- Avg OH = Avg On Hand = [0.5 * (OI * DMD) + SS]
Average On Hand inventory
Where: BOH = Balance on Hand, the quantity of inventory in the strategic buffer
Where: OOQ = the number of items on order at any given time
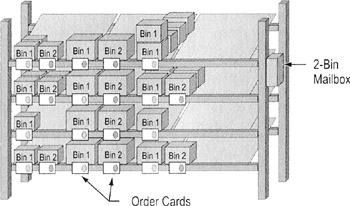
Two Bin Replenishment System
Highlights
A 2-Bin Replenishment Pull System is a simplified version of a standard replenishment pull system that uses just two bins of the stock item being replenished.
- Bin 1 has enough items to cover a calculated period of usage at the point-of-use
- When the bin runs out, Bin 2 is there to take its place while Bin 1 is being refilled/replenished
- The bins can be "Line-Side" (off to the side of the production line/work process) or "Point of Use" (immediately at hand on the production line or workspace—see diagrams, p. 221
When to use a 2 Bin system
- Items used repeatedly
- Relatively consistent demand/volume (low variability)
- Stocking shortages have a significant impact on service levels
- Supply costs are not in statistical control due to:
- Lost or misplaced items/supplies
- Lack of discipline or control over item dispersal
- Always pull stock from bin with GREEN card if it is there.
- Supply room staff replaces stocked items and switches RED card to items just replaced.
- Attached cards to magnetic strip labels (for ease of movement).
To use a 2 Bin Replenishment Pull System
- Same elements as basic replenishment pull system)—demand (DMD), replenishment lead time (LT), and order interval (OI).
- Safety stock typically set at 1/2 the max of [σ *Service Level * (LT) 0.7], or otherwise is dependent on individual conditions
- In addition, determine Box/Container Quantity
Bin Quantity = max (LT, OI) * DMD + SS/2
- The bin doesn't necessarily look like a "bin"
- Can be a standard plastic bin or tray, or the "standard pack" (the container an item is shipped in)
- For larger items, a "bin" can be represented by a card attached to the item (the card is returned to the supplier when the item is consumed)
- If stock/supply room or vendor cannot divide shipping quantity, set bin quantity at some multiple of the box/container quantity
Option 1: Line-Side replenishment
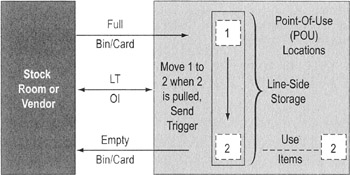
Option 2: Point-of-use stocking
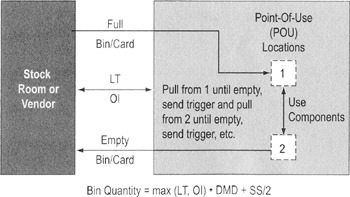
2-Bin POU stocking is used when restocking is not an issue
Computing minimum safe batch sizes
Note on Management Policy: the batch size is often set by management based on the EOQ formula or the demand for a fixed time period (a month's worth, a week's worth, etc.). Both methods result in lead times and inventory levels that are generally 30% to 80% larger than the process requires.
To have a Lean system operating at peak efficiency with lowest cost, you should compute the minimum safe batch size from the formula shown here.
Assumption: all products have the same demand and process parameters.
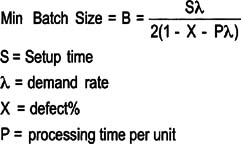
- S = Setup time
- λ = demand rate
- X = defect%
- P = processing time per unit
There is a more sophisticated version of the equation (protected by U.S. patents) that you can find in Lean Six Sigma, McGraw-Hill, 2001.
Accounting for Variation in Demand
The above formulas do not account for variation in demand, which is addressed two ways:
- Manufacturing: additional finished goods inventory must be built in accordance with the safety stock formula, p. 218
- Service: For service applications, safety stock is not possible and customers must wait in queue to receive their value add service time. The formula[*] for Queue time is:
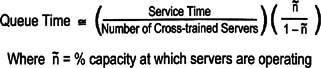
Where ñ = % capacity at which servers are operating
[*]This formula assumes an exponential distribution of arrivals and service times which is adequate to guide the improvement process.
Four Step Rapid Setup Method
Purpose
- To eliminate wasted time and non-value-add cost in a process
- To improve productivity rates
When to use setup reduction
- Use on any process step where there is a significant lag (setup or changeover time) between the completion of one task and full productivity on the next task
Step 1 Document setup procedures and label each as internal or external
Document all the setup activities and identify them as either:
- Internal setup, an activity that must be performed by the process operator even if it interrupts value-add work
- Manufacturing example: exchanging dies/fixtures in the machine
- Transactional example: Logging into a computer program
- External setup, an activity that could be performed while the equipment is producing parts or the process operator is conducting other value-add work
- Manufacturing example: retrieving tools and hardware
- Transactional examples: Preparing figures to enter into a service quote, loading software
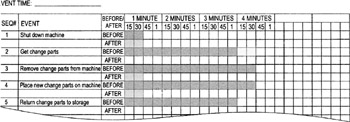
Tool # 1: Setup documentation worksheet
|
MACHINE: |
DOCUMENTOR: |
||||
|---|---|---|---|---|---|
|
DATE: |
Page 1 of_ |
||||
|
SEQ# |
START TIME |
EVENT |
ELAPSED TIME |
INT |
EXT |
|
1 |
0 |
Shut down machine |
:30 |
:30 |
|
|
2 |
0:30 |
Get change parts |
3:00 |
3:00 |
|
|
3 |
3:30 |
Remove change parts from machine |
3:30 |
3:30 |
|
|
4 |
7:00 |
Place new change parts on machine |
3:30 |
3:30 |
|
|
5 |
10:30 |
Return change parts to storage |
3:00 |
3:00 |
|
|
6 |
13:30 |
Load material onto machine |
1:0 |
1:00 |
|
|
7 |
14:30 |
Generate test piece |
:30 |
:30 |
|
|
8 |
15:00 |
Measure and inspect |
2:00 |
2:00 |
|
|
9 |
17:00 |
Adjust dies |
1:00 |
1:00 |
|
|
10 |
18:00 |
Generate test piece |
:30 |
:30 |
|
|
11 |
18:30 |
Measure and inspect |
1:30 |
1:30 |
|
|
12 |
20:00 |
Generate first good piece |
1:00 |
1:00 |
|
|
TOTAL TIME THIS PAGE: |
21:00 |
||||
|
TOTAL TIME ALL PAGES: |
21:00 |
||||
Tool # 2: Area Layout
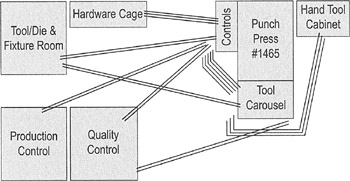
- Helps you understand what movement and motions are required by setup personnel
Tip You may discover inefficiencies in layout that can be solved with a 5S effort (see p. 206)
- Use the diagram to track pathways of operators/setup personnel to determine the total distance traveled during the operation
- This information can be used to compare to "after" foot traffic patterns to gain support for workplace changes
Tool # 3: The "before" timeline
Used to graphically show each event within the setup an highlight which take the longest. Leave room for the "after". See the end of this section for an example that includes both before and after data.
Tool # 4: Improvements worksheet
- Number the setup activities in sequence, then enter those numbers on a worksheet
SEQ#
IMPROVEMENT
STEP 1
STEPS 2, 3, & 4
1
Moving "get change parts" to external
3:00
2
Moving "return change parts" to external
3:00
SETUP REDUCTION BY STEP
6:00
TOTAL SETUP REDUCTION (STEP 1 and 2, 3, & 4)
(BST) BEGINNING SETUP TIME
% SETUP REDUCTION
(TSR/BST) 100
- Brainstorm and list improvement opportunities
- Estimate the net reduction in setup time from the improvement
Step 2 Offload internal setup to external setup wherever possible
- Focus on any activity or task that causes you to stop the process. Then ask why you have to stop, and figure out how to eliminate that source of delays or interruptions.
- Brainstorm ways to convert internal setup to external setup
- What could you to do make the information, equipment, materials, etc., available to the process operator without requiring him or her to interrupt value-add work?
- Ex: Have computer programs compile orders every evening so all that all the information is waiting for order processors the next morning
- Ex: Use Replenishment Pull systems (p. 216) that will automatically deliver required materials the workstation before the operator runs out
- What could you to do make the information, equipment, materials, etc., available to the process operator without requiring him or her to interrupt value-add work?
STEP 3 Streamline internal setup
Look for ways to make any setup that must be done by the process operator more efficient.
- Ex: Redesign the workplace to simplify, reduce, or eliminate movement (put manuals or tools within arm's reach, for example)
- Ex: Link databases so complete customer information is automatically filled in when an operator enters a name or address
STEP 4 Eliminate adjustments required as part of setup routines
- Adjustments and test runs are used in manufacturing to fix inaccurate centering, settings, or dimensioning
- Use mistake-proofing (p. 233), visual controls (p. 237), process document, and any other means you can think of to make sure that equipment settings, part placements, etc., can be performed perfectly every time
- Abandon reliance on intuition. Do studies to get data on what settings are best under what conditions, what procedures result in most accurate part placement, etc.
Document results
Highlight conversion to external setup
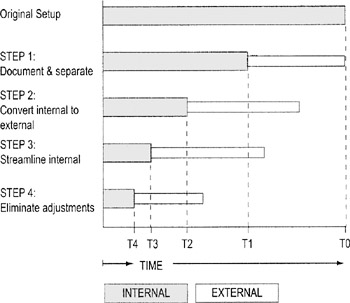
Before/After chart
Adapting Four Step Rapid Setup for service processes
(See p. 223 for background on setup reduction)
The underlying principle is the same for reducing setup in transactional processes as it is for manufacturing processes: you want to reduce interruptions to value-add work. The language is a bit different, however.
Step 1. Document and differentiate serial from parallel setup activities
Serial events are activities that cannot (or should not) be performed while any other task is being completed
Ex: All activities by a Teller when dealing with a customer face to face or over the phone (don't want to make customers wait)
Parallel events are activities that could be performed while another task is being completed
Ex: Loading software programs, processing data
Step 2. Convert serial setup activities to parallel setup activities
- Goal: Offload setup activities to some other person, activity, or process (so they no longer disrupt value-add work)
- Use brainstorming and multivoting techniques to identify and select improvement ideas
- Include Impact/Effort (p. 264) to help you prioritize which ideas to test first
- Re-examine serial events from Step 1 and verify they are actually serial (put on your creative thinking hat and see if there are any activities you classified as serial that could be done in parallel)
3. Streamline remaining serial activities
- Simplify, reduce, eliminate movement
Ex: Moving printers/copiers vs. walking to pick up hard outputs
- Use electronic aids where possible
Ex: Barcoding vs. typing/writing, electronic notepads (that can be hooked into master databases) vs. handwritten notes
- Manage system/network needs:
Ex: Computing equipment to sort disparate requirements offline (see Lean Six Sigma for Service, McGraw-Hill, 2003)
4. Eliminate adjustments/standardize work
- Examine the "ramp up" time in serial setup work—any time of reduced output
- Ask what prevents the process from operating at full speed during those time periods
- Be creative in finding ways to address those issues
Ex: if people need to look up information, have it available through linked databases and keyword searches
Total Productive Maintenance (TPM)
Purpose
To reduce scheduled and unscheduled downtime from typical levels of 30% to below 5%.
Useful definitions
Preventive Maintenance: maintenance that occurs at regular intervals determined by time (Ex: every month) or usage (Ex: every 1000 units)
Predictive Maintenance: maintenance performed on equipment based on signals or diagnostic techniques that indicate deterioration in equipment
Both are common sense approaches for proactively maintaining equipment, eliminating unscheduled downtime, and improving the level of cooperation between Operations and Maintenance.
When to use TPM
- Use when planned and unscheduled downtime are contributing to poor Process Cycle Efficiency
How to do TPM
Prework: Assess current operating conditions
- Evaluate machine utilization, productivity, etc. (see form below)
- Tally maintenance repair costs (parts and labor)
Availability
- Total time available___min
- Planned down time (Breaks, meeting, Prev. Maint.…)___min
- Run time A-B___min
- Unplanned Downtime 1+2+3=___min
- Breakdown minutes___
- Change over minutes___
- Minor stoppages___
- Net operating time C-D___min
- Available Percentage E/C × 100___%
Performance
- Processed Amount (total good and bad)___units
- Design lead time (ideal)___min/unit
- Performance percentage [(H×G)/E]×100___%
Quality
- Total Rejects___units
- Quality Percent [(G-J/G)]×100___%
- OEE
- Overall Equipment Effectiveness F×l×K=___%
Solution Phase #1: Return equipment to reliable condition
Inspect and clean machine, identify needed repairs, and tag defects that need attention.
- Clean machine thoroughly (done by all team members)
- Remove debris and fix physical imperfections
- Thoroughly degrease
- Use compressed air for controls
- Change filters, lubricants, etc.
- Lubricate moving parts and joints
- Remove unnecessary tooling, hardware, supplies, etc.
- Place a color-coded tag or note on areas requiring repair. Record all needed repairs in a project notebook.
- Information Needed on Tags
- Asset number of machine
- Location and relative position of defect on machine
- Name of originator and date
- Color coding of tags
- Oil Leaks—Orange
- Coolant Leaks—Green
- Air Leaks—Yellow
- Machine Defects—Pink
- Electrical Problems—Blue
- Information Needed on Tags
- Perform repairs
- Production Supervisor has to make machine available
- Manager/sponsor has responsibility to make sure tagged problems are fixed (by assigning individuals or teams, for example)
- Actual repairs can be done by any qualified person
Solution Phase #2: Eliminate breakdowns
- Review defect tags from Phase 1
- Eliminate factors contributing to failure:
- Secure and tighten all fasteners, fittings, bolts and screws
- Replace any missing parts
- Replace any damaged, worn or wrong size parts
- Resolve all causes of leaks, spillage, spray and splatter
- Improve accessibility to the part or area so you can regularly clean, lubricate, adjust, inspect
Solution Phase #3: Develop TPM information database
- Document all preventive and predictive maintenance procedures
- Often done by a team
- Documentation should include who has the responsibility for performing each task, and frequency of the task
Solution Phase #4: Eliminate defects
- Provide for early detection of problems by training operators in preventive and predictive maintenance techniques (PMs)
- Operators must be trained on all prescribed PMs
- Operator is responsible to perform PMs as documented
- Production Supervisor to insure PMs are effective
- Install visual controls (see p. 237 for details)
- Ex: Lubrication placards in place
- Ex: All air, water, gas, and coolant lines are labeled
- Ex: 5S Audit scores posted
- Help prevent future failures by training maintenance staff in proper techniques
- Preventive/Predictive maintenance procedures usually scheduled jointly by maintenance and production
- Implement 5S housekeeping and organization (see p. 210)
- Regularly review and improve machine performance
- Hold regular, joint TPM reviews with both Maintenance and Production representatives
- Track progress of ongoing activities
- Identify areas for future improvements
- Initiate corrective action when needed
- Use TPM metrics (below)
- Improve safety
- Use any safety procedures standard for your business (lock-out/tagout procedures, proper lifting techniques, use of personal protective equipment)
TPM Metrics
As with any process, metrics are needed to both monitor process performance and understand gains made from the TPM effort
- Operation Equipment Effectiveness (OEE)
OEE = Availability Level × Operating Level × Quality Level
- Mean Time Between Failure (MTBF)
- Mean Time To Repair (MTTR)
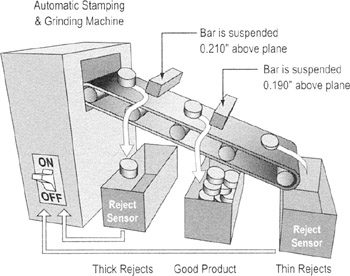
Mistake proofing prevention (Poka yoke)
Purpose
Mistake prevention is the ability to stop mistakes before they occur.
- Ex: Machine operations that make it very difficult or impossible to produce a defective product. Does not require human assistance.
- Ex: Electronic checklist built into a process
Mistake proofing is making it impossible for errors to be passed to the next step in the process.
- Ex: Devices or systems that either prevent the defects or inexpensively inspect each item to determine whether it is defective
- Ex: Software programming that makes is impossible to move onto the next step until all information is entered into a form
When to use mistake prevention and mistake proofing
Use when rework to correct errors or process delays downstream (perhaps caused by a lack of material or information) are hurting Process Cycle Efficiency.
Two mistake proofing systems
- Control/Warning Approach
- Shuts down the process or signals personnel when an error occurs
- Dials, lights, and sounds bring attention to the error
- Prevents the suspect work from moving on until the process step is complete
- Process stops when irregularity is detected (may be necessary if too costly to implement mistake proofing)
- High capability of achieving zero defects
- Prevention Approach
- Employs methods that DO NOT ALLOW an error to be produced
- 100% elimination of mistake (100% zero defects)
Steps to mistake proofing
- Describe the defect and its impact on customers
- Identify the process step where the defect is discovered and the step where it is created
- Detail the standard procedures where the defect is created
- Identify errors in or deviation from the standard procedure
- Investigate and analyze the root cause for each deviation
- Brainstorm ideas to eliminate or detect the deviation early
- Create, test, validate, and implement mistake-proofing device
Process balancing design principles
If overall lead time suffers because work is improperly balanced (see takt time chart on p. 53), use these principles to help you identify improvements.
- Minimize movement
- Stabilize lead time first before trying to minimize it
- Maximize resource efficiency
- Minimize number of process steps
- Balance tasks/labor across process steps
- Maximize space utilization
- Minimize takt variance
- Minimize NVA (conveyance, standby, and motion wastes)
- Minimize the need to rebalance as demand requirements change
- Minimize volume variability (combine product category demand)
- Maximize flexibility to allow for product introductions and discontinuations
- Use training and continual reinforcement to maintain gains
Work cell optimization
Purpose
To reduce the time needed to complete a task or set of tasks and eliminate opportunity for mistakes.
When to use work cell optimization
Whenever you have inefficient workflow (too much movement of people or materials).
Cell design principles
- Co-locate related work, use cellular layouts
- Cross-train employees for multiple jobs to create a flexible workforce
- Machine & resource layout follows process sequence
- Small and inexpensive equipment
- One-piece flow processing
- Easy moving/standing operations
- Production paced to takt (rate at which the customer buys the product)
- Standard operations defined
- Remove authorization barriers
How to optimize work cell design
You will never get the design perfect the first time around—get it in place, then use operator feedback and process performance to tweak the layout/design,
Phase 1: Prework
- Stabilize lead times throughout the entire process
- Eliminate part shortages
- Make sure the process AS A WHOLE is meeting customer requirements (demand, quality)
Phase 2: Redesign a work cell
- Design (layout, flow) for multiple machines or multiple steps per operator, but typically overstaff at first (don't sacrifice CTQs)
- Decide where raw materials and WIP inventory will be located
- Select a cell design (see options below) and put into place
- Apply operational improvements to reduce batch sizes
- Apply line balancing principles (see p. 235) to smooth task times
- End goal is a batch size of one (known as continuous flow manufacturing/one-piece flow)
Work cell optimization Design options
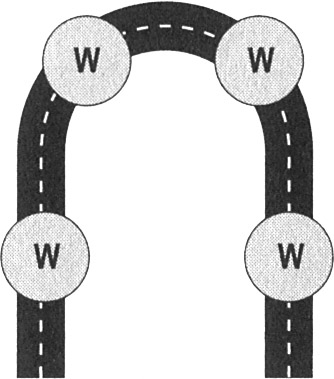
U cell
- Easy to see entire product path
- Easy for operators to operate multiple machines
- Material handling to/from cell typically at single location
- Facilitates ownership of process
T Line
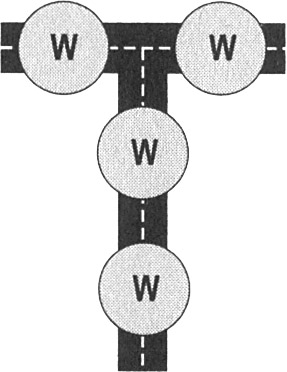
- Good for products requiring two or more sources of input (other cells?)
- Also good for cells that run two (or more) different end products with some operations in common
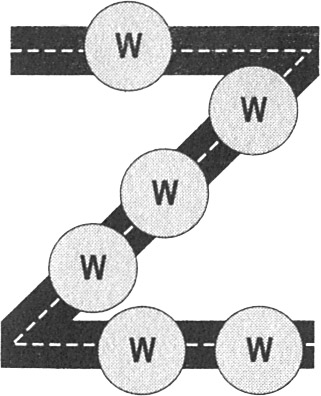
Z cell
- Good for building around monuments (structural beams, oven and machining centers, etc.) or other capacity constraints (receiving, shipping, etc.)
- Still allows operators to manage more than one machine/operation
Visual Process Controls
Highlights
Visual controls include a variety of displays and visual markers in the workplace that help you:
- Establish and post work priorities
- Visually display whether expected daily performance was met: "Was today a good day or a bad day?"
- Better understand the flow of inputs and production
- Quickly identify abnormal conditions
- Display standardized methods in use
- Communicate performance measures
- Display the status of all elements critical to safe and effective operations
- Provide feedback to/from team members, supervisors, and managers
- Eliminate the need for meetings!
Safety Indicators
Takt boards Production Summary Boards
- Takt boards monitor the output of a process or process step so you can judge if it is meeting customer demand
- Takt boards should provide at least three key pieces of information:
- The work being done (be specific)
- The desired speed (completion rate)
- Actual completion rate
|
Takt Board: Order Entry Department |
||||
|---|---|---|---|---|
|
Yesterday: 443 Orders 1.61 Orders/Hr |
||||
|
Today 440 Orders 1.66 Units/Hr |
||||
|
Hour |
Scheduled |
Actual +− |
Diff |
Comments |
|
7-8 AM |
60 |
53 |
−7 |
System down f/5 min |
|
8-9 AM |
60 |
59 |
−8 |
|
|
9-10 AM |
45 |
48 |
−5 |
|
|
10-11 AM |
60 |
61 |
−4 |
|
|
11-12 PM |
30 |
34 |
0 |
Took late lunch |
|
12-1 PM |
60 |
59 |
−1 |
|
|
1-2 PM |
50 |
50 |
−1 |
|
|
2-3 PM |
40 |
41 |
0 |
|
|
3-4 PM |
35 |
35 |
0 |
Over 7 min: Software issue |
|
Totals |
440 |
440 |
||
Production process boards
Issue boards are used to communicate information about the improvement project or ongoing process management.
Process summary
Lists information relevant to your workplace:
- Jobs in process
- Amount of WIP and its dollar value (cost or potential revenue)
- Daily takt rate
- Productivity rates
- Actual vs. desired output, lead time
- Unresolved issues—divided between those the work team can handle and those where they need help from someone with particular expertise (an engineer, lawyer, etc.) or authority (a sponsor or manager)
Dashboard Metrics
- Rolled throughput yield
- On-time delivery
- Weekly takt rate average
- Equipment uptime/downtime (unscheduled maintenance)
- Productivity
- Sigma level
Personnel Skill Training boards
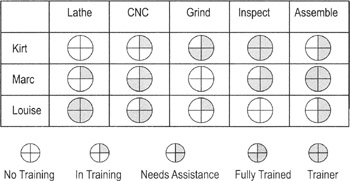
A posted board that lists individuals and summarizes their status with respect to desired training. Can help set priorities for training and help staff know whom to consult with a particular question.
S boards
Displays status of 5S Project
- Set-in-order maps
- Standardize checklists
- 5S audit results (checklist)
- 5S audit results (spider graph)
- Action plan for improvement
- Before/After photos
The Lean Six Sigma Pocket Toolbook A Quick Reference Guide to Nearly 100 Tools for Improving Process Quality, Speed, and Complexity
- Using DMAIC to Improve Speed, Quality, and Cost
- Working with Ideas
- Value Stream Mapping and Process Flow Tools
- Voice of the Customer (VOC)
- Data Collection
- Descriptive Statistics and Data Displays
- Variation Analysis
- Identifying and Verifying Causes
- Reducing Lead Time and Non-Value-Add Cost
- Complexity Value Stream Mapping and Complexity Analysis
- Selecting and Testing Solutions
EAN: N/A
Pages: 185
