Raising the Stakes in Service Process Improvement
Overview
Inevitably, both the types of projects you select and the methods you use will evolve as your skills in and understanding of Lean Six Sigma increase. The main reasons why some projects aren’t addressed until after you and your organization have gained experience with Lean Six Sigma are:
- The problem has proven resistant to improvement (which likely means the underlying causes are complex or interwoven).
- Achieving significant gains requires application of more sophisticated Lean Six Sigma methods or tools, or tools that will work only after people have developed a basic trust of the underlying methodology.
- Solutions require the involvement of external suppliers or customers.
- The culture needs to evolve to a point where people are more accepting of the fact that they need to change the way they do their work.
- There is no single silver bullet solution, and there needs to be the resolve to make multiple (incremental) changes in parallel and avoid quick hit “solutions” that won’t produce the desired results.
Notice that these issues encompass not only the need for technical expertise, but situations where teams also need well-developed people- and project-management skills. In such situations, the challenges and risks are elevated. Failing to solve a long-standing problem could disillusion staff and be a setback to your initiative, just as asking teams to apply methods they don’t understand can create frustration. And you wouldn’t want to involve external customers or suppliers on a poorly run project, even if the solutions didn’t require any particular expertise.
This chapter looks at case studies from our contributors that are more suitable for second-wave projects—that is, after the organization has some experience under its belt—either because of the need for more sophisticated tools or because they involve cross-functional and/or customer collaboration.
A Quick Guide to the Cases…
Case #6: Gaining control over process complexity [a service Kaizen project]
Case #7: Collaborating with internal customers
Case #8: Improving response time on signature services
Case #9: Cleaning up your workspace (a 5S+1 project)
Case #10: Knowing what’s here (and where It Is)
Case #11: Changing professional practice
Case #12: Developing supplier relationships through Lean Six Sigma
Case #6 Gaining control over process complexity [a service Kaizen project]
Why do this particular project?
In February 2002, Bank One held a strategy meeting where key operational managers talked about and prioritized improvement specific opportunities. The issue of “overnight courier packs” used in their Wholesale Lockbox operations rose to the top of the list. This involves corporate-to-corporate payments that customers would overnight to Bank One and want processed ASAP the day the payments arrive.
As described at the beginning of Chapter 5, what started out as a modest service comprising a few deposits each day soon exploded into a high volume, highly complex operation with a lot of “exception processing” (where staff would need to follow non-standard procedures because of varying customer needs). Besides the obvious cost associated with excessive complexity, Bank One was also losing a revenue opportunity—the competition charged for similar services, but Bank One didn’t feel comfortable doing so until they could guarantee a specific service level. As one of the largest Wholesale Lockbox providers nationwide, the lost opportunity was estimated at millions of dollars per year to be had if the process was improved.
The Event
An initial improvement event in this area had generated some improvements, but the changes recommended to achieve a quantum improvement in service were deemed to risky, so a second event was launched to reexamine the process. The project was launched using the NEO’s group standard improvement event (Kaizen) format:
Day 1: Training and Define. Team members receive baseline training in Lean and Six Sigma concepts, such as the 7 types of wastes.
Day 2: Measure and Analyze. Team members physically walk through the process, following the path that an item of work would follow. They collect data on cycle time, queues, travel distance, and so on to complete the value stream map.
Day 3: Improvement testing. Generating ideas for process improvements continues with an impact/effort analysis to focus in on areas contributing the most to waste. The team then brainstorms solutions for the high-impact areas, and reorganizes the value-stream map to reflect appropriate changes via “should” (future state) mapping (how they’d like the process to operate).
Day 4: Improvement simulation. Participants gather data to evaluate the selected improvements, document proposed changes to the procedures, and simulate the process with these new procedures (as much as is feasible).
Day 5: Evaluate and report out. The team reviews results with the sponsors and celebrates the results.
A portion of the value stream map developed by this team is shown in Figure 13.1.
Figure 13.1: Lockbox Value Stream Map Data
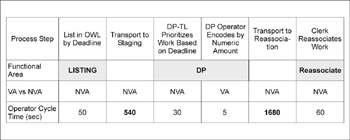
This chart shows the data collected by the Lockbox team to quantify various forms of non-value-add (NVA) time in their process.
Solution ideas
The team generated several dozen process improvement ideas they thought would have the biggest impact on turnaround time for the least investment. In general, they covered areas such as:
- Establishing clearer policies about what would qualify for an guaranteed 4-hour turnaround time.
- Being clear about their capability. This topic had several aspects. First, the team evaluated what staffing levels would be needed under the redesigned process in order to deliver a 4-hour turnaround time. Second, they also identified a keystroke limit beyond which they would knew it would take too long to process the request, which allowed them to establish guidelines around when they could promise a 4-hour turnaround time.
Participants
Team members; Sohail Khan, Stacey Hartman, Yolanda Johnson, Mike Gallagher, Keith Guarneri, Tammie Jones, Karyl Miller, Dannie Paz, David Medina, Karen Mieszala
Support: Doug Hartsema (executive sponsor), Mike Hendershott (project sponsor), Jim Kaminski
Results
Together, these ideas allowed for a 35% improvement in cycle time, and a reliable turnaround within the promised service level of 4-hour turnaround. That means the company can now feel confident in generating a revenue stream (see Table 13.1, below, and Figure 13.2, next page).
Figure 13.2: Total Cycle Time (Before/after)
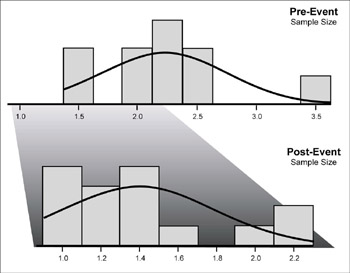
This frequency plot shows the results before and after process changes. The lower, dotted “before” curve reflects an average cycle time of over 2.5 hours. The “after” curve shows a 30% gain in cycle time.
|
Objectives |
Pre |
Post |
% Improv |
Type of gain |
|---|---|---|---|---|
|
To charge a fee that reflects the added value that customers receive from this service |
$0 |
$MM (Identified) |
100% |
Revenue |
|
Reduce Operator Processing Time |
1:03 |
:38 |
39% |
|
|
Reduce Transportation/Delays |
1:33 |
1:02 |
32% |
|
|
Reduce Total Cycle Time |
2:36 |
1:41 |
35% |
What it took to make this work
- Adjusting to the readiness of the organization: As noted, Bank One’s NEO group had actually held an initial improvement event in the overnight courier pack process where there were no limitations on what the team could try. The team came up with some radical ideas, including the application of some Lean principles to completely redesign the workspace. But at the report out from that first session there was some pushback. The sponsors told the team they could go back in and hold a second event (the project discussed here) designed to just make process improvements without radically changing the infrastructure of the operations.
- Sponsor involvement: The sponsors were involved prior to the project helping to identify priorities and define the project scope. During the improvement event, they met with the team at the end of every day to hear updates and provide input.
- Wise use of IT: In most service organizations, the IT resources are already running at or beyond capacity. In some cases, the NEO group has told teams not to even considering IT-related solutions, which they’ve found actually produces a greater level of creativity. For this project, the IT staff didn’t participate in the entire event, but came in during the solution phase where they could help recommend solutions.
- Best Practice dissemination: The project described here was conducted at just one of the Bank One sites. But Bank One is a nationwide company, and they needed to be able to guarantee the same service level at all sites before they could start advertising and charging for the service. The internal consulting group therefore had to evaluate the other sites where overnight courier packs were handled, and communicate and adapt what this team learned in order to build company-wide capability.
Case #7 Collaborating with internal customers
At one point, the procurement operations at the Lockheed Martin facility we’ve visited many times in this book discovered there was a very low first-pass yield on certain types of purchasing requests—meaning few requests made it all the way through the process without being stopped because of some defect (such as missing or incorrect information). The buyers could not solve this problem themselves because many of the problems originated with the internal customers (the people making the requests).
In many ways, this project could be considered “first wave” in that it used basic Lean Six Sigma tools and principles—developing work standards, mapping the process, and so on. But to use these tools effectively, the buyer team had to work effectively across organizational boundaries, carefully avoiding any appearance that they were simply trying to blame others for problems. Working across boundaries takes both credibility (so people outside your work area will be willing to support and/or participate on the project) and a degree of comfort with the tools. That’s why significant cross-functional projects are often more suitable as later projects.
Why do this particular project?
Improving cycle time is a strategic goal for any service function. Here, a cross-functional team, which included a customer representative, was assigned to investigate situations or factors that contributed to significant delays. In this case, they realized that 2% of purchase requests (over 1600 annually, or a 3.38 sigma level) were “rejected back” to the requester because of defects (missing, incorrect information, etc.). These rejects extended the lead time from a mode of 11 days with an average of 37 days—more than tripling the cycle time. That meant on any given workday, there were at least three irate customers and helpless buyers on the phones expediting an order impacted by these rejects.
The Analysis
The first issues the team encountered should sound familiar by now: they discovered there was no consistency in how request rejects were handled, no data available on just how many rejects there were, no documentation on how the process should work, a lot of differences in defining what a “reject” was, and so on. The team manually collected data for two months just to establish baselines. In fact, the majority of its work (75%) was spent developing standard work definitions and data collection procedures.
Participants
Team members: Tony Ceneviva, Dave Anderson, Luis Escalante, Catherine Jeffries, Ken Mortimer, Rich Schneider, Zakiya Slayton, Ron Varnum, Myles Burke (BB)
Support: Dan Grant, Martha Derry, Gary Harrer, Rolf Eklund, Lou Diapollo, Ken Klobus
Once they had clear definitions of reject types, the team took a natural first step, analyzing the data on the reasons why a request would get rejected. The results are depicted on the Pareto chart shown in Figure 13.3.
Figure 13.3: Pareto Chart of Reject Reasons
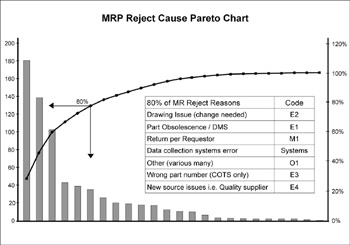
Pareto charts give a team a focus and set the goals for the remaining DMAIC steps. Here, five causes drove 80% of the rejects.
The team also performed an impact/effort assessment for each of these reject reasons (how much effort would it take to solve that problem; what kind of impact would it have if they could). The results are shown in Figure 13.4. As you can see, most of the issues that scored highest on the Pareto would also require a lot of effort to address.
Figure 13.4: Impact/Effort Analysis for Reject Causes
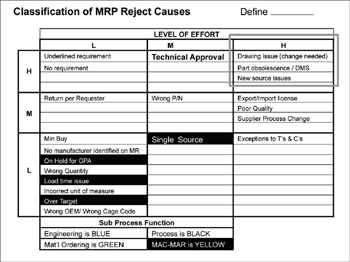
This matrix was used to identify causes that had both a high impact on the observed problem (rejected purchase requests), and the amount of effort needed to fix them. Drawing and Part obsolescence scored “high” on both scales, so you’ll see them in the upper right corner (they were the top two in frequency and also in effort to correct).
Other data analysis included looking at what factors contributed to the length of time a rejected request would sit “in queue” before being addressed.
Solutions Results
The key ideas the team implemented were to…
- Document the process and standardize work
- Address technical approval, which is a restriction that engineering puts on certain purchases
- Process improvements on Single Source Justification (a federal requirement) to put the form online and add mistake proofing features to assure the initial submittal to the buyer is complete and acceptable
- Implement queue ownership to monitor aging. Give all staff access to upgraded computer system that provides email notification and a daily downloading of the MRP reject queue. This will help prevent excessive loss of lead time.
As a result of the many actions:
- Reject rate dropped immediately from just over 2% to 1.7%
- Verifying Single Sole Source problems went from 100% reviews to just 30% needing review
- All remaining MRP rejects are now corrected in 50% less time than before due to having the standardization and training in place
What it took to make this work
- This team overcame one of the biggest barriers to improvement in service functions: developing reliable data collection and analysis systems. It’s not easy work. It took them four months to get the basic system in place, and even longer to refine it. Part of the problem was that in order to collect data, buyers had to perform extra work to enter codes when a request was rejected. It wasn’t time consuming, but it is an add-on to the way they were used to doing their work. After the team realized its goal the manual data coding ended.
- Another key lesson they learned was the need to be open-minded to new ways of envisioning their work. What might have historically been viewed as a good use of buyer expertise (using their knowledge to correct mistakes and make sure customers got what they wanted) was soon viewed as total waste. Setting up a system to simplify the process and automate key steps prevented the need for all the rework. In fact, the buyers are now able to use more of their professional skills in value-added work such as developing relationships with suppliers and customers.
Case #8 Improving response time on signature services
Every business has signature services, the ones that are most visible and therefore have the biggest effect on how customers view you. In the city of Fort Wayne, one of the most visible departments is Street, responsible for everything from leaf collection to paving streets (they even have their own asphalt plant). Here’s one of their case studies:
Why do this particular project?
Anyone who’s driven on streets in the northern states knows that the continuous freeze-thaw cycles wreak havoc on pavement. And the problems are made worse if the city Street department is too busy to do preventive maintenance. Pothole repair is therefore a highly visible city service, and a failure to provide timely response has significant impact on citizen satisfaction and on the number and cost of claims filed against the city. Historically, it has also been the cause of huge overtime expenses that provide another drain on city services.
Employees of the Fort Wayne Street department knew that street repair and maintenance had suffered in recent years. The result was a large and growing number of complaints. Under new leadership, the department began a two-pronged initiative to get the problem under control:
- Increase the number of miles of streets that receive preventive maintenance treatments, such as sealing of cracks, asphalt paving, and so on (services that are largely invisible to citizens but failure to do them results in highly visible problems)
- Improve response time to repair existing potholes
There was one more reason for putting effort in developing the pothole repair system. “We have a heavy concentration of street department workers in the leaf season and the snow-removal season,” explains Mayor Graham Richard. “If we didn’t have other work for them to do at other times, we’d have tremendous dips and valleys in employment.”
Participants
Support team members: Brad Baumgartner, Jill Morgan, Brooks Beatty
Bob Kennedy (Black Belt)
Ted Rhinehart (Champion)
The Analysis
The first question most teams want to answer is “just how bad is the problem.” Figure 13.5 shows a dotplot of response times once a complaint was received. The average response time was well over 20 hours, with many trailing off much longer.
Figure 13.5: Quantifying the Problem
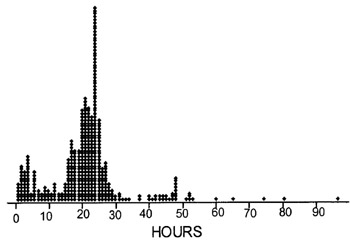
On this chart, each dot represents the amount of time it took to complete one repair. The plot shows a typical pattern seen whenever time is being measured: there is more than just one peak, and the points trail out on the long end. Patterns like this are seen when there are some types of jobs that go quickly (the small peak toward the left), a majority of work that has almost a normal distribution, and a few jobs that, for whatever reason, take a long time to complete.
The team also mapped out the process then brainstormed ideas about possible causes of problems. The team discovered that there was a lot of inefficiency in the repair process. For example, if a crew had a repair on the northeast and one on the southwest, they’d go to the northeast and then to southwest and do nothing in between. Furthermore, standing orders were to repair only the potholes for which they had repair orders—so a team could drive over a pothole in one block on their way to fix one in the next block, and not do anything about it. (Actually, most processes have some version of this problem.)
In discussing problems with the process, the team decided to focus on:
- How the work orders were filled out (timeliness and correctness)
- Communication of the work orders to the appropriate supervisor
- Factors affecting delays in completing the repairs (such as whether there was sufficient staff, weather conditions)
Solutions Results
The process changes made by the team improved communication about where the problems were and made better use of the crews’ time. The key changes were:
- “If you see it, fix it.” The new norm is to fix all potholes even if an official complaint hasn’t been lodged or hasn’t reached the crew. (This type of solution works when delays because of transportation time are far longer than value-added processing time.)
- Supervisors started picking up orders from the dispatchers at least 3x/day.
- Repair orders are checked daily instead of weekly.
- Creation of a specialized crew for pothole repair during leaf season (so the repair work can continue in parallel with leaf collection).
- Using the 3rd shift to provide additional capability when needed.
- Centralizing control over repair assignments and completion.
Each truck is now equipped with communication equipment so crews can be updated immediately of any changes in their work orders.
Results
Defining a defect as any repair not completed within 24 hours, the original Sigma level was 1.2, which quickly went up to 3 Sigma. (In fact, that continues to rise: by December 2002, the average pothole repair time was less than 9 hours, with 100% of all reported pot holes repaired in less than 24 hours—meaning their defects have held at zero for a number of months). With lead time reduced so dramatically (see Figure 13.6), there essentially is no WIP to clog up the process. Perhaps the most important result is that positive citizen response has inspired the crews, and increased their job performance, job satisfaction, and self-image.

Figure 13.6: Improvements from the Pothole Repair Project
This time plot shows a dramatic (and sustained) drop in repair time soon after the project was launched in September 2001. Currently, 98% of the repair orders are addressed within 24 hours.
What it took to make this work
- Waiting until the time was right. Mayor Richard points out they staged the timing of this project purposefully so that the head of the Street department could build rapport and actually get everyone to the point that when the project started, they knew they could accomplish it. “We have so many people looking over our shoulders that part of our challenge in building trust and pride of spirit is project choice,” says Richard. “Project definition and managing expectations are key.”
- Empowering employees to act. The traditional command-and- control style of bureaucracy had contributed to waste and inefficiency. Instituting the “see it, fix it” policy allowed employees to exercise initiative and use their time more effectively and complete repairs more quickly.
Case #9 Cleaning up your workspace (a 5S+1 visual office project)
Disorganization and clutter in a workspace are big contributors to wasted time in service functions, and, if allowed to exist in public areas, will give customers a poor first impression. The way out of that clutter and dis-organization is a Lean technique known as the 5S’s, introduced in Chapter 11 (see p. 301–302). The five steps are:
Sort—>Straighten—>Shine—>Standardize—>Sustain
…and some add a 6th S —>Safety
The buyers at the Lockheed Martin procurement center decided to put the 5S+1 method to the test. Here’s what happened…
Participants
Team: Jennifer Sharpe, Judy Liang, George Sholtis, Natalie Stewart, Glenn Harden, Nicole Plair
Resources: Manny Zulueta (Champion), Ranga Srinivas (coach), Myles Burke (BB)
Why do this particular project?
During a value stream mapping event, it became obvious just how much variation there was among the buyers in how they performed the same job. The data showed the more productive buyers were also those who were the most organized in folder management, files, and general workspace usage. The team therefore launched an initiative called “Visual Workplace” with a very simple goal: To reach the point that when anyone was away from their desk, someone else could easily fill-in temporarily without spending all their time searching for the right files, information, or status. The scope of the effort was defined as follows:
- Paper/desktop organization (visual workplace) to clearly identify the status and backlog of work-in-process
- Labeling
- Paper consolidation, dissemination of the use of some Best Practices in organizing electronic files, schedules, contacts, queuing tools
The Project
The team studied other companies then held weekly meetings to develop a plan for achieving a clean, organized workspace. For each “S,” they talked about what it meant in their situation, and talked about how they would achieve that goal. For example, the first S is Sort, getting rid of unneeded work (usually paper files or other documentation) from the area, and keeping only what’s truly needed. To achieve this goal, the team follows the Red Tag process:
- Each person examines their workspace and puts a red tag on anything they don’t immediately need
- The red-tagged items are all dealt with:
- All “live” but currently unneeded folders are moved to a central file room; they are taken out when needed then moved back upon completion of a task
- Outdated publications are removed
- File cartons are removed from the work area
- All remaining work (which is “needed”) is organized in the workspace according to its purpose
In the next step, Straighten—based on the simple phrase “a place for everything and everything in its place”—any extraneous paperwork, furniture, etc., is eliminated. The team continued this way through all of the S’s, developing guidelines for desk organization that would make it possible for anyone to easily find information in someone else’s workspace, etc.
This same process works for both physical and computer workspaces; in the latter case, people delete old files, archive files that should be kept for business reasons but are no longer active, and so on.
Results
The team estimated it cost about $100 per person on average to complete this project, which included purchasing of standard supplies to make the work organization possible (In/Out boxes, hanging file baskets, file dividers, etc.). The time investment per person included a 1-hour introduction to 5S+1 process, plus 6 hours on average to complete all the sorting, straightening, shining, and so on (see Figure 13.7 for examples of improvements). The results are priceless in productivity and attitude.
Figure 13.7: Before and After Workspaces


Team member Judy Liang shows her office before the 5S+1 project (top). One action taken by the team was to post charts that help them track daily work (bottom).
What did it take to make this work?
- Having the project originate from the buyers rather than a management edict. This is an important factor since the issue boils down to having people rearrange their own personal desk space.
- Allowing some degree of flexibility based on job function and personalities. The team did not want to mandate that all desks look exactly the same. Rather everyone just had to have their work organized such that “strangers” could easily navigate in their workspace.
- Translating what could be perceived as a manufacturing tool to the office environment.
- Maintaining focus on 5S+1 objectives.
“I was at a customer’s facility in Florida and received a panic call from my boss about a hot placement that needed to occur that morning. With my workplace organized it was simple to walk my coworker through the status to exactly describe where the files were for her to place the order.“
—Natalie Stewart; MAC-MAR Buyer, Visual Workplace team leader.
Case #10 Knowing what s here (and where it is)
Most programs at Lockheed Martin rely on Government Furnished Property (GFP), equipment or materials that are owned by the U.S. government and furnished to Lockheed Martin. Knowing exactly when this equipment arrives and getting it to the proper location at the needed time has been challenging in the past. An earlier initiative failed to produce the desired results, so a team at the Naval Electronics Surveillance Systems–Moorestown, NJ, location (NESS-SS) was commissioned to take on the effort.
Why do this particular project?
There are two very powerful reasons why Lockheed Martin wanted to gain better control over the GFP it receives:
- First, the use of GFP is to be controlled in accordance with strict Federal regulations. Violations occur if property is not utilized in accordance with the terms of the government contract.
- Second, and perhaps more importantly, many times the GFP is being used to support programs that are crucial to national defense. If the GFP tracking and delivery system fails, critical program schedules may suffer.
Participants
Team members: Edna Winans, Glenn Carlson, Steven Ezzyk, Jeffrey Lewis, Edward Maisel, Robert Ogbin, William Quail, Robert Wolfe, Paul Zurcher, Richard Winans, Joanne Smith, Kevin Fast (BB)
Support resource: Lara Cribb
Naval / Customer representatives: Charles Deitch, Kenneth Hornback
The project goal was straightforward: getting the GFP equipment to show up in the right place at the right time. High level goals of the project were to:
- Develop better metrics
- Reduce cycle time
- Reduce labor
- Document the process
Before the Project Picking the Team
In this project, team membership would be an important determinant of success. Rather than limit the team to like-minded individuals, the Black Belt pushed for a significant cross-functional team, ending up with 15 people representing diverse functions inside NE&SS-SS and 2 customer representatives. This positioned the team to define and understand the process many times better than if they had limited themselves to one or two functional groups.
Analysis
After some discussion the team defined the boundaries of its project from when the GFP was received at the warehouse until it was delivered to its final destination. The box was drawn here to ensure that the project was not too large and to ensure that the tasks remained within the team’s sphere of influence.
Once the boundaries were clear, the team developed a flowchart then started measuring the performance of the process. Fortunately, a wealth of data was at their fingertips: by the nature of the process, documentation is well maintained and data mining was relatively straightforward. In addition, the team conducted a survey to understand how well participants and stakeholders understood the GFP processes. The data exposed numerous defects in the process:
- 69% of the deliveries had incoming documentation that was not consistent with engineering’s definitions
- 48% of the deliveries had no local point of contact identified who could determine program use and resolve issues
- 29% of the deliveries had not been defined in their contracts
- 21% of deliveries were unauthorized direct shipments to end users (bypassing the warehouse receiving point)
- 19% of the deliveries had incomplete or missing packing lists for warehouse inventory
“Not only didn’t people know what they were doing wrong, they did not know what they were doing right.”
—Glenn Carlson, GFP Lead
Because of these problems, GFP tracking and delivery occurred seamlessly only 10% of the time (a low first-pass yield). The other 90% of the time, some data was missing or incorrect: orders without problems had a cycle time of 2 days on average; orders with problems could take 2 days to 2 weeks. What the team discovered:
- The survey revealed that engineers who initiate orders or request GFP for use on their programs did not understand the process nor the ramification of incomplete information.
- The requirements definition and the ordering processes (and related documentation) were inconsistent and often incomplete. It was difficult for staff to ascertain the nature of the GFP.
- In some cases, inconsistencies were the result of naming conventions.
- There was no single process owner to monitor process performance.
- There was no one procedure to integrate the processes across the organization. While most individual functions had work instructions, they were not defined and integrated as a system.
- Though the GFP receiving point was the warehouse (for in-processing functions to be performed), sometimes direct end-user deliveries occurred. This resulted in the need for additional personnel and trans-shipping, thereby delaying the availability of the GFP for the program.
Solutions Results
It was obvious that NE&SS-SS employees needed to be trained, and convincing the stakeholders of the need was easy. What was most exciting, however, was the active participation the customer (= the Navy) assumed in order to train those in government. Other improvements included:
- The team developed and implemented a standard procedure that applied to the entire organization, not just local functional areas.
- Process owners were identified who are responsible for managing the process across the organization.
- The database used to generate required documentation was enhanced to provide more information to identify the equipment received.
- A feedback mechanism was implemented that automatically raises a flag if the proper internal documentation isn’t timely. Management is involved, by design, to encourage proper behavior.
- Key stakeholders have volunteered to help educate everyone touched by the GFP process.
“No one was doing anything wrong. The Navy ordered a Gateway computer, Gateway shipped a Gateway computer. And our defined requirement was for a ‘simulator’—which was a Gateway computer.”
—Glenn Carlson, GFP Lead
Results:
- When you add up all of the labor across the organization required to resolve various problems and combinations of problems, this team estimated that more than 2,700 work hours may be saved a year. A tremendous return on a $30K investment!
- The team eliminated potentially huge liability and customer satisfaction issues.
- The new process encourages people to follow the procedures without penalizing a program for last minute fire drills.
- The process ensures that GFP is delivered on time—eliminating potential impact to important military program schedules.
What did it take to make this work?
- Having the right people on the team—including customers. Issues with the customer that would have otherwise been outside of the NE&SS-SS’s control were addressed (a continuing partnership ensured continued accuracy). Team members realized they each had knowledge of only a portion of the process, and they needed everyone on the team to participate in order to get an accurate picture of the process as a whole.
- Convincing people of the importance of process documentation. Because employees have gotten along “just fine”_in their jobs without documentation, they take some convincing of the necessity for establishing procedures. As Kevin Fast puts it, “Today, more than ever, procedures mean something, they have teeth. These documents can no longer be put on a shelf like they may have been in years past—they must be followed.”
- Ability to recognize an over-reliance on “heroes.” In every organization, there are heroes like Edna Winans. With her 20 years of experience she was so familiar with the way the GFP system worked that she could usually overcome limitations in the documentation or process (by accurately guessing where certain types of equipment should be delivered, etc.). But when Edna was gone, or a new employee came on board, no one could perform to Edna’s level. The conversion of tribal knowledge to standardized procedures reduces the complexity of the process.
- Using stakeholder influence. This team leveraged stakeholders to obtain authority and buy-in necessary to be successful. On this project the customer proved to be the ultimate stakeholder and friend to the team.
“We considered starting at the beginning of time—when an engineer thought that he might just need some sort of GFP. However, as we considered all of the variables—all of the different development engineers, many scenarios, vendors of all types, GFP of all types— it was clear that such a scope would be too large and too complex. Keeping the project manageable is a key to success.”
—Kevin Fast, GFP Project Black Belt, Lockheed Martin
A few bonus cases
As in Chapter 12, we were unable to present all of the cases our contributors have shared with us. We have compiled the cases described in this chapter and others at our website (www.georgegroup.com). Here’s a quick peek at two of the additional cases you’ll find there.
Case #11 Changing professional practice
Once we’re trained on a given way to perform any work, be it a simple task or heart surgery, it’s human nature to continue doing the work that way (as long as we think it’s working). One example of this phenomenon comes from Stanford Hospital and Clinics. For several years, staff had been aware that different cardiac physicians prescribed different pre-discharge procedures for their patients. But the issue of asking physicians to change their practice was deemed so politically charged that the topic sat on the back burner… until the cardiac surgery team decided to confront the issue head on. As it turned out, one set of pre-discharge practices was more expensive than another, with no perceivable advantage to patients. A standard practice was then adopted by all the physicians in the group.
The solution to this problem turned out to be relatively simple, but the key lesson is that the outcome may not have been so positive had the issue been tackled at the very beginning of Stanford’s quality initiatives. Rather, over several years of being on and around improvement teams, the physicians (and everyone else at Stanford) started developing an “improvement mentality” that made them more open to critically examining their own practices.
Case #12 Developing supplier relationships through Lean Six Sigma
The basic philosophy that drives MAC-MAR’s service is that their customers deserve to buy the best products made from the best suppliers in the world. “And if the best suppliers in the world are not our current suppliers… then we must make them the best!” They use a formal four-phase, fourteen-step engagement process with a goal of having the suppliers be self-sufficient in their Lean Six Sigma journey and to bring these suppliers into design efforts early on (and they’ll have the opportunity to become a sole source supplier for their product). They make it a win-win engagement by telling suppliers, “We are after your waste, not your margins.”
But the challenge here was that most of MAC-MAR’s suppliers fall closer to the “mom & pop” end of the spectrum than to “worldwide conglomerate”—that is, they are small operations without a lot of flexibility in staffing or spending. The last census showed 75% are facilities of less than 250 people. Small suppliers have fewer managers to deploy strategic plans or drastically reorganize work to cut costs while improving outputs. There are few green fields, a lot of heritage, and many single sole sources. They are always asked to reduce cost without always having corresponding reductions in their own costs—and thus eventually they hit a price wall.
To decide which of their thousands of suppliers to work with, the procurement staff rated each supplier according to…
- How much business they do with each supplier
- Which suppliers were strategically critical either because they were sole source suppliers or because of the volume, technology, or criticality to providing Lockheed Martin’s services and products
- How much leverage Lockheed Martin has with the supplier
- The current relationship between Lockheed Martin and the supplier
This evaluation was balanced against decisions concerning how much Lockheed Martin could afford to do ($s and personnel) to help suppliers improve. The result of this analysis was a list of 200 suppliers that Lockheed Martin’s MAC-MAR and specific programs wanted to work with, and an understanding of WHY for each one—e.g., to reduce lead times, improve delivery, improve new product introductions, improve risk management, reduce cost, and so on. Over the past few years, they have used this information to help them structure and launch dozens of supplier development projects, which ranged from holding Kaizen improvement events (centered around value stream mapping) at the suppliers’ locations, to holding supplier symposiums, to deploying Lockheed Martin experts full- or part-time to work with the suppliers.
Lessons We Can Learn
There is no substitute for conducting a rational project selection process, such as that described in Chapter 4. But the final list of candidate projects should also be filtered against the likelihood that your organization can complete the project successfully. There are no hard and fast rules about what kinds of projects an organization should work on first, or second, or not at all. But, in general, the kinds of cases in this chapter work better once an organization has some experience because they…
- Crossed organizational boundaries—both in terms of bringing together multiple internal departments and in including suppliers and customers
- Used tools/methods that might seem threatening to someone new to Lean Six Sigma (such as the 5S method, which requires people to change their own workspaces)
- Required a degree of cultural readiness and enthusiasm for improvement
These types of projects can be attacked by novice teams, if they have expert coaching by Black Belts or Master Black Belts who have both excellent people skills and technical skills.
This is an excerpt of the first House of Quality the Caterpillar team developed as part of the credit card project. This house relates customer (or “Process Partner”) statements of needs (left column) to critical requirements (top columns). The individual scores for each requirement are multiplied by the importance (far right), then summed at the bottom to get a Priority rating.
Part I - Using Lean Six Sigma for Strategic Advantage in Service
- The ROI of Lean Six Sigma for Services
- Getting Faster to Get Better Why You Need Both Lean and Six Sigma
- Success Story #1 Lockheed Martin Creating a New Legacy
- Seeing Services Through Your Customers Eyes-Becoming a customer-centered organization
- Success Story #2 Bank One Bigger… Now Better
- Executing Corporate Strategy with Lean Six Sigma
- Success Story #3 Fort Wayne, Indiana From 0 to 60 in nothing flat
- The Value in Conquering Complexity
- Success Story #4 Stanford Hospital and Clinics At the forefront of the quality revolution
Part II - Deploying Lean Six Sigma in Service Organizations
- Phase 1 Readiness Assessment
- Phase 2 Engagement (Creating Pull)
- Phase 3 Mobilization
- Phase 4 Performance and Control
Part III - Improving Services
EAN: 2147483647
Pages: 150
