Seeing Services Through Your Customers Eyes-Becoming a customer-centered organization
Overview
“It was not the fair market value of inventories, receivables, or fixed assets that produced [See’s Candies’] premium rates of return, rather it was a combination of intangible assets, particularly a pervasive favorable reputation with consumers based on countless pleasant experiences they have had with both product and personnel. Such a reputation creates a franchise that allows the value of the product to the purchaser, rather than the production cost, to be the major determinant of selling price.”
Berkshire Hathaway Annual Report of 1983
# # #
“Charlie and I, not fully aware of the value of an economic franchise, looked at See’s mere $7 million in tangible net worth (and $4.2 million in earnings) and said $25 million (not $30 million) was as high as we would go (and meant it). Fortunately, the transaction was not derailed by our dumb insistence on $25 million. Over the past 20 years, See’s has distributed $410 million to Berkshire Hathaway for an increase in retained earnings of only $18 million!”
Berkshire Hathaway Annual Report of 1991
Warren Buffett is renowned for his view that value is created by “sustained rates of return higher than the cost of capital.” It’s a view supported by the stock market data shown in Figure 1.2 in Chapter 1, which demonstrated that companies with the highest market-to-book value showed strong revenue growth and economic profit.
No one would consider Buffett anything but a self-interested investor, but his comments on See’s Candies reinforce a long-standing improvement theme at the heart of Lean Six Sigma: quality and value can be defined only by the customer. In order to provide quality, we therefore have to learn to see through our customers’ eyes, learn to judge what we do and don’t do the way that they would judge us.
Much has been written about techniques for gathering Voice of the Customer (VOC) data (see sidebar, next page, for a quick review). The purpose of this chapter is broader: to create a vision of what it’s like when customer awareness pervades every aspect of business operations. We’ll cover four topics:
- Incorporating customer information into strategic decision making
- Using VOC data in product/service design
- Weaving VOC data into process improvements
- Shaping job descriptions/skill sets around customer needs
VOC Use #1 Strategic business decisions
At the broadest level, an understanding of your customers (and the markets they create) should be an integral part of decisions about your organization’s market positioning and strategic goals. Five types of customer-related information are useful for this purpose:
- How well your current services/products meet (or don’t meet) customers’ needs
- What customer needs exist that you are not currently meeting (market opportunities)
- What offerings customers feel are unnecessary (product/service line analysis)
- How your offerings compare to the competition
- What world-class levels of performance are (benchmarking)
The first lesson that comes with collecting any of the above data is to make sure you’re speaking your customer’s language. “We sit down with our internal customers—who measure everything in great detail—and discuss their metrics and our metrics,” says Manny Zulueta, the VP of Lockheed Martin’s MAC-MAR procurement center. “The question is whether these metrics are still important, how they would prioritize them. That way we make sure we’re measuring something that is important to them. These ‘critical-to-customer’ metrics form the basis of integrating our initiatives with our customers.’ Done properly, the results we get contribute directly to achieving our customers’ goals. Our never-ending goal is to always exceed their expectations.”
Review of VOC collection
There are two basic ways to gather VOC information: to go out and get it (proactive methods) or let it come to you (reactive methods).
Reactive methods mean that information comes to you through a customer’s initiative. It encompasses customer calls (complaints, compliments, queries, technical support, sales), web page hits, emails or cards that customers send to you, point of sale survey cards they fill out, contract negotiations, referrals, and so on. Having well-developed methods for gathering, tracking, and using this information is absolutely vital in retaining current customers because it tells what they think about your current offerings. Because customers are more likely to contact you when they have problems or questions, reactive methods are better at detecting product/service weaknesses than strengths. They may also be biased in terms of representing some customer segments more than others.
Proactive methods mean that you take the initiative to contact customers. They include surveys/questionnaires, focus groups, interviews, site visits or tours, point-of-sale contact, and so on. Because you control the timing and content of the contact, proactive methods can be used for a wider range of purposes than reactive methods, including product/service design, process improvement, performance monitoring, market analysis, and so on. In recent years, it has also become increasingly popular to include representatives from one or two customers on problem-solving/process improvement teams.
Remember that data “costs.” So if you’re going to be investing time and dollars in gathering VOC data, make sure you use that investment wisely by getting timely, accurate, reliable customer information that is easy for employees to use and easy for them to access.
An example of how such information can be used is shown in the “Bubble” diagram below (Figure 3.1). This company has five value streams (in this case corresponding to brands) and simply began an analysis of their strategic position by gathering Voice of the Customer data (“how well do our offerings compare to the competition”). Such research can focus on any combination of price, features, related support services, and so on.
Figure 3.1: “Bubble” diagram of strategic position
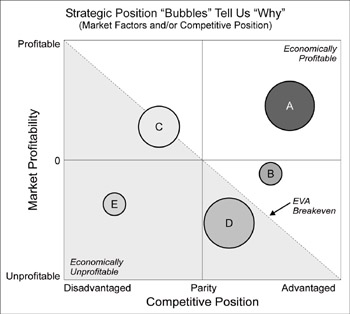
The Y axis shows whether the industry as a whole for each product or service is on average producing economic profit. The size of the circles reflects the revenues for that brand; the location on the graph is a combination of competitive position and market profitability. Brand A is in the best position: it generates a lot of revenue (it’s a big circle), it’s in a profitable market (indicated by being in the upper half of the graph), and it is competitive (it’s on the right side of the graph). Brand E is in the opposite position: it’s small, and in the lower left corner of the graph (meaning it generates few revenues and is in a bad competitive position in an unprofitable industry).
A product/service line in which the industry as a whole earns negative Economic Profit is an “unattractive industry.” This is not to say that no company does well, just that the average company will not. (For example, from its inception, the airline industry has earned negative economic profit. But competitively advantaged companies, like Southwest Airlines, have had a positive Economic Profit.)
The analysis shows that Brand C is in an attractive industry but is competitively disadvantaged. The company could decide to abandon this brand line, but since the market is profitable, it’s more likely they would choose to capture VOC data and implement Lean Six Sigma improvements to improve Brand C’s competitive position.
(The analysis can’t stop here: obviously this company needs to make decisions about what to do with each of its brand lines. But you’ll have to read Chapter 4 to find the answers.)
VOC Use #2 Product service evaluation and design
The strategic use of VOC information relies on broad market-level patterns; here, the focus is much narrower, on customers’ reactions to specific product or service designs, features, functionalities, etc. The two situations where you typically need this information are:
- Evaluating how well current services/products match Critical-to-Quality (CTQ) needs
- Gathering VOC data to generate design requirements for new or redesigned services/products
Both of these uses revolve around understanding what is important to your customer and what isn’t.
A Do your priorities match your customers ?
Customers don’t purchase a service or product based on overall market trends. They react to individual features or functions. That’s why you should always check whether the features/functions of your service or product match what your customers need.
An example of this type of analysis is shown in Figure 3.2 (below). This company asked an important customer to identify what they thought was most important in the company’s offering, then rate how well this company and several competitors did. The bars on the chart indicate the customer’s importance rating; each line tracks how well one of the companies did relative to those ratings. The most important takeaway from this chart is that the company did poorly on the customer’s top seven attributes; they only did well on the remaining eight attributes, which weren’t all that important to the customer!
Figure 3.2: Do Your Priorities Match Your Customers’?
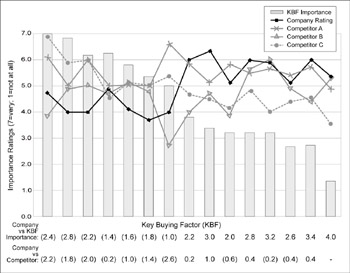
As you can see, none of the companies performed consistently well relative to the customer’s top priorities; most of them performed much better on attributes that weren’t nearly as important to the customer. If the company that did this analysis can improve performance across all customers’ priorities, they could gain an advantage compared to their competitors.
In short, this company (and its competitors) had mistakenly focused on attributes that were lower in importance to the customer. The results showed up in the offering’s poor financial performance. Whether the company can afford to stay in this market and fix this offering would take further investigation.
B Using VOC in design decisions
You can avoid situations like that shown above by weaving the Voice of the Customer into your service/product design decisions. The standard Six Sigma methodology used for this purpose is called Quality Function Deployment (QFD), a technique for converting customers needs into specific product/service design features. There are two basic steps in this process, depicted in Figure 3.3 (below).
- Determine VOC (understand what is critical to customers)
- Use QFD to transform customer needs into functional requirements then into design requirements
Figure 3.3: Turning Customer Needs into Design/Performance Requirements
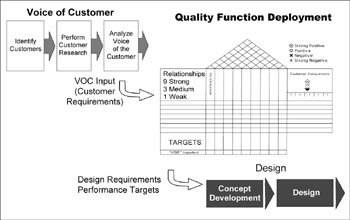
Service/product design process needs to start with the Voice of the Customer—what your customers say they want. Quality Function Deployment is a rigorous methodology for converting these requirements into a final design. The conversion happens through a series of steps, captured in a form called the “house of quality” where issues like functionality are related to product capabilities.
These steps encompass very specific and sometimes sophisticated procedures. Going into detail is beyond the scope of this book; here’s a quick overview to give you a taste of what’s involved.
Step 1: Determine the Voice of the Customer
The objectives here are to understand what your customers want and need from your service/product (their Critical-to-Quality requirements), organize that information, analyze the patterns it contains, then develop priorities and strategies. The output is a complete and organized list of customer requirements; the highest priority requirements are the input for design. The process is…
- Identify the customers (external, regulatory, internal) of the given product/service: whose needs must it meet. You’ll need to decide whether different subsets of customers are likely to have significantly different needs (speak with different “voices”). If so, you’ll need to gather information from different segments, and look for differences between segments. Typical segmentation factors include economic information (frequency of purchase, revenues generated, etc.), descriptive factors (geographic, demographic, product/service features, industry), and product/service preferences (price, value, features). What you want to do is focus on segments that align with your company’s business strategy. Keep in mind that not all customers represent the same level of value to the company.
- Perform the customer research. Use market research, focus groups, interviews, surveys, etc., as appropriate. Besides proactive customer information, look into market research reports, completed evaluations, industry reports, competitor assessments, web page hits. Capture your decisions in a Customer Research Plan (see Figure 3.4).
- Analyze the information. The goal is to translate VOC input into customer requirements. The tools used most often here are affinity diagrams (to identify themes) and tree diagrams (to organize the themes in increasing levels of detail).
Figure 3.4: Example of customer research plan
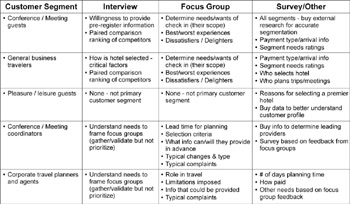
A customer research plan helps organize a team’s decisions about which market segments to pursue, how representatives from each segment will be contacted (interviews, focus groups, surveys), and for what purpose.
|
Current level of knowledge |
Research method |
Output (what you get) |
|---|---|---|
|
No knowledge |
Interviews & focus groups |
Customer wants and needs (general ideas, un-prioritized, not clarified, all qualitative) |
|
Know preliminary wants and needs |
Interviews & focus groups |
Customer wants and needs (clarified, more specific, preliminary prioritization) Customer input to list of competitors, best-in-class |
|
Qualitative, prioritized customer wants and needs |
SurveysFace to face Written/mail Telephone Electronic |
Qualified prioritized customer wants and needs Competitor comparative information |
Making sense of qualitative data is an iterative process, involving interpretation and prioritization. You will likely go through several rounds of data gathering as you refine your understanding of customer needs (see Table 3.1, previous page).
Step 2: Use QFD to translate the VOC into design/performance requirements
Quality Function Deployment (QFD) is a very customer-focused method for product and service design. It emphasizes “outside in” quality (bringing the VOC into your company, rather than relying on internal experts to take their best guesses. QFD is a more efficient, effective planning method, reducing the cost and time of development (see Figure 3.5).
Figure 3.5: QFD gets you to market sooner than traditional methods
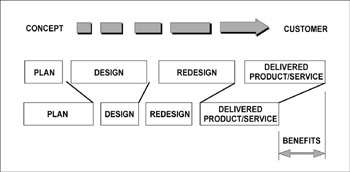
A traditional service/product development process puts too little emphasis on planning and capturing VOC information. As a result, the design phase usually takes a long time, as does the redesign phase as conflicts are worked out. By putting in more emphasis up front, in the planning phase, a QFD process avoids many problems further on, leading to a shorter overall cycle time and an earlier release-to-market.
Investigate Quality, Cost, and Speed Attributes
It used to be that customer research was largely focused on quality- and cost-related attributes. But now that your organization is becoming more Lean-focused as well, be sure to include questions about lead time, delivery time, etc., in your research.
QFD encompasses a series of analyses linked to the construction of a “House of Quality” that succinctly captures an enormous amount of information: what customers said they wanted, what importance was attached to those needs, how the needs translated into functional requirements, and how the proposed product/service compares to the competition. An example from a company studying their loan process is shown in Figure 3.6.
Figure 3.6: QFD Analysis for Loan Process
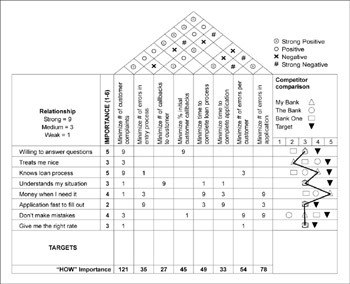
This format, called the House of Quality, is a central feature of a QFD process. It summarizes key discoveries and decisions made by a team throughout the design process. The left side lists functionalities the customers want and the importance to them (here, what they want as they experience the loan application process). The top shows capabilities the company could use to address those requirements and interactions between the capabilities (the “roof” with the symbols). The right side shows the company currently compares to the competition in meeting customer requirements. As a team goes through the QFD process, they methodically fill in the House of Quality piece by piece.
Rather than go into detail here, see Chapter 14 for an example of how an internal company process was designed using the QFD methodology and more explanation around the House of Quality and its role in service/product design.
VOC Use #3 Process improvement and problem solving
The DMAIC (Define-Measure-Analyze-Improve-Control) methodology associated with Six Sigma is very good at reinforcing VOC awareness. In the Define stage, for example, instructions for creating a team charter include capturing any available VOC information relevant to the project and defining targets based on customer needs. (If the information is not available, teams are instructed to gather VOC data before proceeding.)
In addition, it’s becoming increasingly popular for teams to include customer representatives on their teams. (See Chps 12 and 13 for examples of projects where customers were included.)
VOC Use #4 Shaping job descriptions skill sets around customer needs
Organizations that are truly learning to see through their customers’ eyes usually take steps to build customer awareness (internal or external, as appropriate) among all employees, not just those involved in Lean Six Sigma projects, not just managers making strategic decisions.
An example of how this works comes from Nick Gaich, the Vice President of Materials Management and Customer Service at Stanford Hospital and Clinics (SHC). His area encompasses a combination of several logistic departments (mail delivery, etc.) surrounded by professional areas such as purchasing and contract management.
“Materials management touches every customer in some way, every day,” says Gaich. “So our first step was getting the Materials group to understand how well and how far they contribute to ultimate patient care.” As part of this effort, which began a number of years ago, Gaich recalls drawing a bull’s-eye: patients were at the center, surrounded by a ring of caregivers, which was surrounded by the rest of the organization. “Every activity we do daily hits one of those points in the bull’s-eye, and if we’re hitting those points it means we have a value to what we do ultimately in the delivery of care,” says Gaich.
What Gaich was trying to achieve should sound familiar to any organization dedicated to providing superior customer service: “Our role in purchasing is to understand our clinicians’ needs so well that we can [identify] opportunities they couldn’t identify themselves in contract negotiations, in technology advancements, and so on. Our main objective is to contribute at such a high level of service that our work promotes and fosters the continued advancement of our clinical programs.”
This growing focus on customer needs didn’t stop at this general level. Gaich’s group imbues a customer-focused awareness of value into every job. Here’s one example: The mail room at SHC has a relatively small (but expert) staff, handling well over 100,000 pieces of mail each week. “If you look at mail services, ultimately the biggest trigger point [for providing value to our customers] is the sorting of the mail,” explains Gaich. “Some of the secondary outcomes, obviously, are the final distribution and timing of when mail is delivered, but if you take a look at the amount of mail coming through that small mail room, if we don’t have the skills and quickness in how we sort that mail, we’re either delivering the wrong mail to the wrong areas, wrong individuals, or patient mail isn’t getting through on a timely basis.” The mail room group, therefore, worked to build the knowledge and enhance their individual skills to help support that function.
Annual evaluations like this allow the Materials Management group to keep on top of the changing needs of the organization and refine or expand their skill sets accordingly.
This work not only improves the services offered to internal staff and patients, but has helped elevate the status of many within the materials management group: “For our purchasing director and his staff, for example, it took them from a world of measuring how many POs are cut a day and how many line items there are on a PO, to allowing them to be more professional in what they do, both in understanding the market well enough to provide the technologies and opportunities for clinicians, and to be the best negotiators in-house, to provide the best economics to the decisions we’re bringing in based on clinical need.”
Creating this awareness and working to change the professional image among those within the Materials group and, more importantly, beyond that to other groups in SHC was not simple. “We went through a progression where materials management was once an afterthought to changes being made in the organization,” says Gaich. “Now we’ve progressed to where we have become an integral part of the organization’s preplanning process because we are now offering what I call intelligent services based on a strong professional knowledge base. That is a great feeling for both the individual and the materials management department as we consistently strive to raise our level of professionalism with our peers in the organization.”
Eliminate the Complexity of Outdated Services
The type of approach used by Nick Gaich’s Materials Management group to constantly re-examine whether what they are doing is still adding value to the organization is a model that can be adapted for any service, whether internal or external focused. Allowing outdated services to linger in your suite of offerings creates excess complexity and its associated costs (discussed in Chapter 5).
Conclusion
Meg Whitman, CEO of on-line superstar eBay, describes how developing a true customer focus can happen and the importance of listening to the Voice of the Customer in a recent interview with American Way magazine (April 15, 2002).
AW: In addition to online and phone input from customers, you fly some of them to headquarters to talk face-to-face. With all of the comments you already get, is that really necessary?
MW: You’re referring to our “Voice of the Customer” program. Every two months, we invite about 12 eBay users to San Jose to learn firsthand about their trading experiences on eBay.
The users meet with the senior managers of virtually every department, such as marketing, customer support, policy, technology, and community outreach. During these sessions, we get a great deal of feedback about the features and services that work well and how others could be improved. Following their visit to San Jose, we reassemble the group each month for six months via conference calls to discuss emerging issues. This program provides us with invaluable, ongoing feedback from an instant “focus group” of steady, reliable, and active users.
AW: When you revamped your Collectibles category, nearly 10,000 customers gave you suggestions for changes. Isn’t that overkill?
MW: We rely on the feedback of our users for almost all changes to the site. Our users know the site really well – some are on the site up to eight hours a day. As our Collectibles team was looking to restructure the ever-expanding category, we tapped the expertise of our users on how they use the site. The result is a Collectibles page that is much like a portal tailored to the collector. The updated structure is more convenient and easy to use, while better reflecting the trading areas that are important to our users.
The immediate interaction we have with our users allows them to be part of the product-development team, so to speak. Their involvement multiplies the strength of our own management team. For example, one of our users suggested a way to speed up auctions for impatient bidders, so we introduced “Buy It Now,” a feature that lets bidders end an auction at a set price. Now, 45 percent of listings use this feature, which attracts more buyers and helps close auctions much faster.
As you can see eBay’s approach involves direct contact between customers and the company’s leaders as well as project teams.
The benefits of such an approach are illustrated by the quotes about See’s Candies at the beginning of this chapter. They provide the basis for establishing a relentless focus on serving customers. Making your organization a delight to work with is key to maximizing long-term economic profit. Quality can be defined only by our customer.
Part I - Using Lean Six Sigma for Strategic Advantage in Service
- The ROI of Lean Six Sigma for Services
- Getting Faster to Get Better Why You Need Both Lean and Six Sigma
- Success Story #1 Lockheed Martin Creating a New Legacy
- Seeing Services Through Your Customers Eyes-Becoming a customer-centered organization
- Success Story #2 Bank One Bigger… Now Better
- Executing Corporate Strategy with Lean Six Sigma
- Success Story #3 Fort Wayne, Indiana From 0 to 60 in nothing flat
- The Value in Conquering Complexity
- Success Story #4 Stanford Hospital and Clinics At the forefront of the quality revolution
Part II - Deploying Lean Six Sigma in Service Organizations
- Phase 1 Readiness Assessment
- Phase 2 Engagement (Creating Pull)
- Phase 3 Mobilization
- Phase 4 Performance and Control
Part III - Improving Services
EAN: 2147483647
Pages: 150
