Using DMAIC to Improve Service Processes
Overview
No matter how you approach deploying improvement teams in your organization, they will all need to know what it is you expect of them. That’s where having a standard improvement model such as DMAIC (Define-Measure-Analyze-Improve-Control) is extremely helpful because it provides teams with a roadmap.
There are a lot of resources out there that describe the DMAIC process. The purpose here is to focus on special considerations for using the Lean Six Sigma DMAIC process in a service environment, including both methods and tools that are particularly helpful as well as hints on how to handle the people side of each phase. You’ll also find case studies demonstrating the use of many of the tools and concepts in Chapters 12 and 13.
A table of Lean Six Sigma tools is shown in Figure 11.1 (next page). One of the key advantages of Lean Six Sigma is its ability to prevent the creation of competing Lean or Six Sigma camps. By training your employees, and especially Black Belts, on both sets of tools simultaneously, they will understand why both process speed and process quality are necessary to maximize ROIC.
Figure 11.1: Lean Six Sigma DMAIC Tools
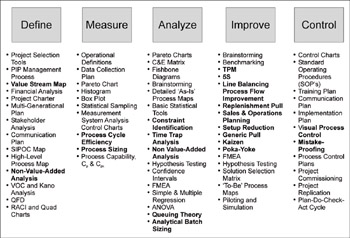
An integrated Lean Six Sigma training course for Black Belts typically covers all the tools listed here (Lean tools in bold). Some of the most important and most common tools are discussed in this chapter.
Project Chartering The transition into Define
Typically, a Lean Six Sigma Champion will work with P&L managers/sponsors to create a first draft of a project charter before the team is officially commissioned because project ideas need to be better defined before they will be ready to undergo a final prioritization. Their task will be to turn the “postcard” of information generated during the project selection process into a more robust project description. The Champion needs to communicate sufficient detail about the project to other audiences like a project selection committee, the managers of the Lean Six Sigma program, and the company’s senior management so they can make informed decisions about which projects to launch first. Some companies find it helpful to use a project definition form (PDF), similar to that shown in Figure 11.2 for this purpose. These forms become living documents that evolve as the project teams are formed and begin work on their project. While they capture more information than was represented on the postcard or in a spreadsheet, it is not necessary to go into excruciating detail yet because the project teams will augment and refine the information as they proceed.
Another reason for simple project definitions initially is the burden that will be placed on the selection committee in becoming familiar with each project they must prioritize. An ideal PDF therefore is just a single page, with an absolute maximum of two pages, and sufficient data to compute benefits, resource requirements, and ROIC estimates.
Figure 11.2: Sample Project Definition Form
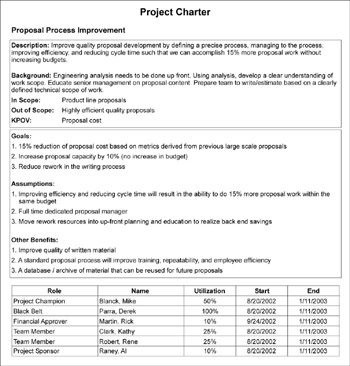
An ideal project definition form captures enough information to allow a project selection committee to prioritize among many ideas without swamping them in detail.
Basic Elements of Define
In the Define step, a team and its sponsors reach agreement on what the project is and what it should accomplish. Presuming that a draft of the project charter is already in place, the main work in Define is for the team to complete an analysis of what the project should accomplish and to confirm their understanding with their sponsor(s). They should…
- Agree on the problem: what customers are affected, what their “voices” are saying, how the current process or outcomes fails to meet their needs, and so on
- Understand the project’s link to corporate strategy and its expected contribution to ROIC
- Agree on the project boundaries
- Know what indicators or metrics will be used to evaluate success
The last two issues often prove particularly important in service environments. When processes have been mapped and studied, defining project boundaries is usually a simple matter of identifying the start and end points on the map. Since most service processes have not been mapped prior to improvement, there is often some dialog between a team and its sponsors in the early stages as the team creates a SIPOC or value stream map and then has the means to identify exactly what they should include as part of their project and what they shouldn’t. Scoping the project is critical to success.
Setting project boundaries
Choose projects that are too big, and you’ll end up with floundering teams who have trouble finishing in a reasonable time frame. Choose ones that are too small or insignificant, and you’ll never convince anyone that Six Sigma is worth the investment. Choose projects that don’t significantly contribute to financial payback (increased revenue or decreased costs), and everyone from line managers to the senior executives will quickly lose interest.
Another factor in project scope is the skill level of the Black Belt and participants. During their training period, Black Belts will likely work on only one project of limited scope. With experience, they can start to take on larger projects or multiple projects.
As for metrics of success, the issue isn’t that people can’t understand what metrics are, but rather just aren’t used to thinking about how to quantitatively measure administrative or service processes. Here are some suggested metrics:
- Customer satisfaction, usually measured through surveys to ensure that all customer segments are represented
- Speed / lead time (see sidebar, next page)
- Sigma level (DPMO) improvement, which requires that a team carefully define “defects” and “opportunities” (see p. 25 for details)
- Financial outcomes, focus on revenue retention and growth, or on cost reduction and/or avoidance
If very little data has been collected on the process being studied, it’s unlikely you will have numbers to plug into the lead time (speed) equation (aka Little’s Law) or to estimate other key variables. If that’s the case, make some reasonable sample estimates of these values up front, then be sure to revisit them once you have accurate data in hand.
Options for measuring speed or lead (cycle) time
One way to measure cycle time is to track individual items through a process. For example, put a tag or form on the printout of a purchase request and see that it gets time-stamped at each process step. Or use a stopwatch and physically follow an item through a process. This procedure is usually time consuming and subject to a lot of variation.
Alternatively, you can more quickly get a sense for lead time by recalling the now-ubiquitous Little’s Law:
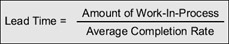
If you know or can make a reasonable estimate of average completion rate and can count the number of items in process, then just plug those values into the equation to determine lead time. This process is instantaneous, is easy to do even on a daily basis, and quickly highlights previously hidden problems with work-in-process.
Key Define Tools for Service Applications
The tools used in Define help in confirming or refining project scope and boundaries. Two common tools are:
- SIPOC Diagrams
- Multigenerational Plans
SIPOC diagrams
A core principle of Lean Six Sigma is that defects can relate to anything that makes a customer unhappy—long lead time, variation in lead time, poor quality, or high cost, for instance. To address any of these problems, the first step is to take a process view of how your company goes about satisfying a particular customer requirement. Because many organizations still operate as functional silos—and the fact that no one person owns the entire process, just steps in the process—it’s likely that few if any people will have looked at the process from start to finish.
The tool for creating a high-level map of process is called SIPOC, which stands for:
- Suppliers: The entities (person, process, company) that provides whatever is worked on in the process (information, forms, material). The supplier may be an outside vendor or another division or a coworker (as an internal supplier).
- Input: The information or material provided.
- Process: the steps used to transfer (both those that add value and those that do not add value).
- Output: the product, service or information being sent to the customer (preferably emphasizing Critical-to-Quality features).
- Customers: the next step in the process, or the final (external) customers.
A SIPOC diagram (see Figure 11.3) usually takes shape during the Define stage of DMAIC, but its impact is felt throughout the rest of the improvement project as well. The team will be Measuring the lead times and quality levels wherever the process fails to meet Critical-to-Quality (CTQ) requirements of the customer. In the Analysis phase, the team will be relating each CTQ and each Time Trap (the output, or Y, in Six Sigma parlance) to a few process parameters (the Xs) whose change will improve that CTQ or Time Trap. In Improve, the team makes changes to the inputs and process steps that affect the critical output; these improvements are then the target of Control measures to make sure the gains are retained.
Figure 11.3: SIPOC process diagram
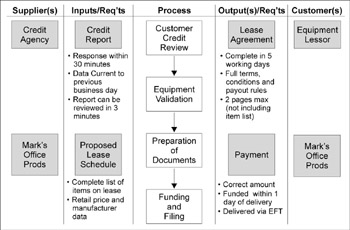
This figure shows a SIPOC diagram for an organization that leases equipment. It not only shows all the S-I-P-O-C elements, but also CTQ indicators (such as “complete in 5 working days”).
Multigeneration plans
There are many reasons why you may want to look at defining different generations of improvement for the service or process being studied. For example, Chapter 10 presented a model for setting realistic expectations (p. 267) that had one message: you have to first bring your current process under control before you can aim for best-in-class performance levels. So an early project may be “bring the process under control,” followed by a second project to “raise the performance level.”
Similarly, if there are a lot of customer requirements you’re trying to meet, you may divide them into groups to be attacked sequentially (e.g., first do a project to fill gaps in the minimum requirements your service/product has to meet, then do a second phase to improve additional features. A third factor is simply practicality: how much improvement you can reasonably hope to achieve within the timeframe of any single project.
A multigeneration plan helps capture this notion by setting out the current goals plus targets for future generations of the product or service. Having such a plan facilitates dialogue between the team and the leadership on which objectives are most important for the current project, and lets them be clear about the boundaries of the current project. For an example of a multigeneration plan, see p. 366 in Chapter 14.
The People Side of Define
There are two key people issues in Define:
- Making sure the right people are on the team. This decision should be influenced not only by which people are representative of the work area(s) likely affected by the project and which have the knowledge, experience, and training that match the project goals, but also by an evaluation of team dynamics (such as using the Belbin approach described in Chp 10 or a comparable alternative).
- Making sure that everyone involved in the project is starting from the same page, with the same expectations. That includes team members, process owners, Champions, Black Belts, other staff who work on the process but aren’t on the team, and so on. The more that all these people understand what is going to happen and the importance of the project to the organization, the likelier it is that the project will go smoothly.
Communication is a significant challenge in any initiative involving change. The team should develop a communication plan to proactively provide information and solicit feedback on the progress and direction of the project. It is very important for the Black Belt to meet often with the Project Sponsor/Process Owner, the individual(s) from the leadership team who is championing the project and who will have responsibility for the results and process once changes have been implemented. The Sponsor’s feedback and alignment with project direction is critical to its success and implementation.
Basic Elements of Measure
One of the major advances of Six Sigma is its demand for data driven management. Most other improvement methodologies, including Lean, tended to dive from identifying a project into Improve without sufficient data to really understand the underlying causes of the problem. The result was a lot of quick-hit projects with short-lived or disappointing results. Combining data with knowledge and experience is what separates true improvement from mere process tinkering.
If you’ve ever tried to gather data in your own work area, you’ve probably encountered one or more of the following roadblocks common in service environments:
- The needed data have never been collected before
- The data have been collected, but for all practical purposes are unavailable (e.g., they are not tracked by computer or they exist in an obscure part of a software program that only a handful of people know how to access)
- So much data it’s difficult to separate the wheat from the chaff
- The data does not measure what it purports to measure
If a service process has not been studied before, you have to expect that any team trying to improve that process will spend a great deal of its time dealing with data problems. Here are some tips for those tools and techniques that are particularly helpful in service environments:
Establish baselines
Chapter 4 introduced a number of metrics associated with creating a complexity value stream map. Below is a recap of metrics you’ll want to monitor:
Work-in-Process (WIP)/Things-in-Process: The amount of work that has entered the process but has not been completed.
Average completion rate: The average number of work items that are completed in a given time period (usually a day).
Cycle or lead time: How long it takes for any work item to make it through the process from beginning to end.
Demand variation: The amount of fluctuation in the demand for the output of your process. The amount of work that arrives at a given activity is measured in terms of units/day and as an average completion rate per unit. Variation can be used in queuing theory to estimate the resulting delays that this variation causes. (See p. 49.)
First-pass yield: The percentage of “things-in-process” that make it all the way through the process the first time without needing to be fixed or rehandled in some way. First-pass yield is a good overall indicator of how well the process is functioning. It also reflects both Lean and Six Sigma goals: in order to have a high first-pass yield, your process must operate smoothly (i.e., with good process flow) and with few errors.
Approvals or handoffs: Two characteristics almost always seen in slow processes are (1) a lot of approvals before work can be completed or (2) a lot of handoffs back-and-forth between people or groups. In contrast, Lean processes operating at high levels of quality are characterized by much fewer approvals and handoffs. While having low numbers of approvals or handoffs doesn’t guarantee having a Lean process, this is relatively easy data to collect and will almost certainly drop as your process improves.
Setup, downtime, learning curves: Any delays or productivity losses that occur when people switch tasks. (See the Setup discussion later in this chapter, p. 292.)
Defects/Sigma capability: If you’ve studied Six Sigma principles before, you know that the Sigma level is the rate of defects that occur per defect opportunities. The key is to come up with definitions that: (1) everyone in the team will interpret the same way, and (2) are consistent with other definitions used in the organization. For example, when filling out a form, do you count every keystroke as an opportunity for someone to make a mistake? Or is the whole form one “opportunity”? Do typos count the same as omissions? One hint: focus on the things that are important to your customer. There are a lot of ways that a form, a report, or a service can be technically “defective” in some way without it mattering to your internal or external customers. For example, perhaps different employees do the work in a slightly different sequence. If “sequence” affects quality as perceived by the customer, then doing the steps in the wrong order is a defect that should be tracked. If sequence does not affect the customer, then you probably have bigger fish to fry elsewhere.
Complexity: The number of different tasks that an activity is called upon to process each day/week/month (which is a function of how many different options there are in your products/services). An estimate of this figure is needed to calculate the effect of the complexity-related WIP on process delays.
If your process has a lot of steps and/or a lot of throughput (volume of work), consider measuring on a sample basis at first (e.g., randomly sample key steps).
Observe the process
In the famous words of Yogi Berra, “You can observe a lot by watching.” There simply is no substitute for impartial observation as a way to confirm what really happens in a process and identify waste and inefficiencies that are built into how work is currently done.
In an office environment, you can’t easily observe “materials” and “products”; instead, you’d need to track things like e-mails, reports, phone calls, or inputs to screens—work products that may exist only in a virtual sense. Since we can’t really observe these things directly, process observation in service environments means watching people and what they do. Think for a minute about how you’d feel having someone sitting at your shoulder, watching your every move, and you’ll understand why this is a tricky proposition. Having a stranger barge in holding a clipboard and writing down notes will do more harm than good. Process observation works best when trained neutral observers are used, and you involve office staff in setting the goals for the observation (“what do we want to learn from this?”) and in deciding when the observation will happen, which staff will volunteer to be observed, and so on.
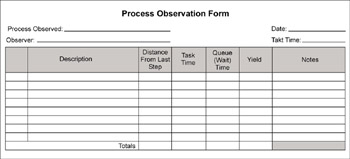
Figure 11.4 shows a form that Lockheed Martin uses for process observation. They’ve found it to be invaluable in the early stages of improvement for verifying (or refuting) everyone’s ideas about what they think is happening, and for helping them zero in on areas that need attention.
Figure 11.4: Process Observation Form from Lockheed Martin
Collect data by participating in the process
What better way to evaluate a particular service than by acting as a customer of that service? Roger Hirt of Fort Wayne recalls one project where a team wanted to improve the quality of response to citizen calls.
Instead of doing an after-the-fact survey of callers, they used the increasingly common practice of using “secret shoppers,” people who interact with the process just as real customers would. First, they provided the secret shoppers with standard scripts relating to different types of inquiry and complaint calls. They had these people call the city department at different times (so they would talk to different staff), then looked at how the staff had handled the calls. They discovered a lot of inconsistency in how staff recorded and categorized information, with the result that citizens weren’t always provided with correct answers or responses. This information allowed the department to develop training for everyone who received calls. A second secret shopper trial showed dramatically improved results.
Collecting data this way is a sensitive issue. On the one hand, you want to know that the service you’re getting is similar to what real customers would experience, but on the other hand you can raise people’s hackles if the data collection comes as a complete surprise. There’s no right or wrong answer here; your Black Belts and improvement teams will have to make a judgment call about how much to tell people ahead of time.
Key Measure tools
A typical Measure toolkit includes everything from data collection sheets to brainstorming methods and prioritizing tools (such as Pareto charts). There are a lot of Measure tools listed in Figure 11.1 that aren’t covered here because you can find out about them in other books. The tools serve one or more of the following Measure purposes:
- Process description
- Focus/prioritization
- Data collection and accuracy
- Quantifying and describing variation
Here is a quick overview of some of the most common tools for each of these categories.
Measure Tools #1: Process description tools
- Complexity value stream maps: Process flow maps that label work as value-add or non-value-add and capture data on time and complexity (see Chp 4 for a detailed description)
- Process cycle efficiency: A calculation that relates the amount of value-added time to total cycle time in a process (see Chp 2, p. 28)
- Time value analysis: A chart that visually separates value-added from non-value-added time in a process (see example, p. 37)
Measure Tools #2: Focus/prioritization tools
- Pareto charts: A chart in which bars are used to represent the relative contribution of each cause or component of a problem. The bars are arranged in descending order. Typically, only a few of the contributors will account for most of the problem, as shown in Figure 11.5. A team will want to focus their efforts on understanding those few contributors. A flat Pareto chart (that is, where the bars are basically all the same height) is indicative that complexity may be involved or that you’re looking at common cause variation in the process.
Figure 11.5: Pareto Chart of Freight Billing Errors
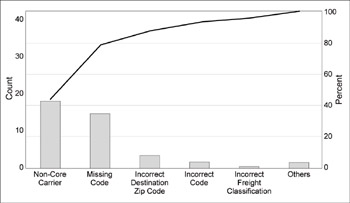
Pareto charts help a team focus on the biggest contributors to a problem. This chart shows how often different types of billing errors occurred. The team would want to focus its efforts on the first two types of errors, since solving those would reduce the number of defects by 80%.
- Failure Modes and Effects Analysis (FMEA): a table relating potential types of failure of a product, service, or process to three criteria on a scale of 1 to 10:
- The likelihood that something will go wrong (1 = not likely; 10 = almost certain)
- The detectability of failure (1 = likely to detect; 10 = very unlikely to detect)
- The severity of a failure (1 = little impact; 10 = extreme impact, such as personal injury or high financial loss)
FMEA tables are gaining increasing popularity as a way for service teams to organized their ideas. (One example is depicted in Figure 11.6; you’ll find another completed example from Fort Wayne on p. 329.)
Figure 11.6: FMEA Form
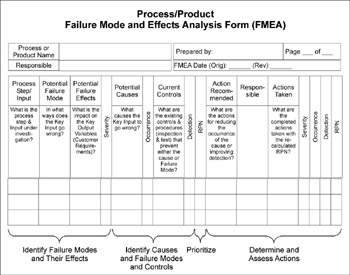
Failure Modes and Effects Analysis is a planning tool that helps teams anticipate and prevent problems. For each step in a process, the team asks what can go wrong, and decides what they can do.
Measure Tools #3: Data collection & accuracy
- Gage R&R (Gage Repeatability and Reproducibility) is a method for studying and adjusting measurement systems to improve their reliability. “Repeatability” means that someone taking the same measurement on the same item, with the same measuring device or procedure, will get the same answer. “Reproducibility” means that different people taking a measurement on an individual item will get the same answer. Gage R&R was historically used to make sure that manufacturing instrumentation was working properly and that operators were all using those instruments in the same way. In service situations, instrument accuracy isn’t as much an issue as whether the people gathering data are all doing it the same way. E.g., are the people measuring cycle time all “starting the stopwatch” at the same point in the process? Are team members counting defects in the same way? Many Six Sigma references contain a description of the full Gage R&R methodology.
What Gage R&R means in services
Whether or not you follow the full Gage R&R method for evaluating a measurement system, you should pay attention to the underlying message: that no measurement system should be considered accurate until it is proven to be so! If you’re on a team or reviewing a team’s work, explore what steps they took to make sure that data collected by one person or at one time would be consistent with that taken at another time or by other people.
Measure Tools #4: Quantifying and describing variation
- Control Charts: A control chart shows data points charted in time order, with calculations performed to determine whether the variation seen in the data is a normal part of the process (known as “chance” or “common cause” variation) or if something different or noticeable is happening (“special cause” or “assignable” variation). The reason to use them in the Measure phase is so you can determine which type of variation is present, and respond accordingly (see Figure 11.7). They are also used in the Control phase for monitoring ongoing process performance. Though the theory behind control charts can initially seem intimidating to people unfamiliar with data, most teams can pick up the basic skills fairly quickly with support or training from a Black Belt.
Figure 11.7: Sample Control Chart
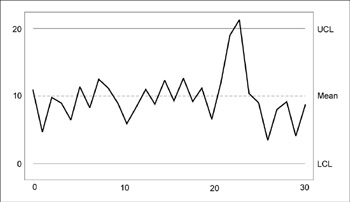
The basic structure of a control chart is always the same. The charts show (a) data points plotted in time order, (b) a centerline that indicates the average, (c) control limits (lines drawn approximately 3 standard deviations from the average) that indicate the expected amount of variation in the process. If the variation in a process is the result of random variation due to factors that are always present, data points will be randomly distributed. Points that form patterns within the control limits, or points that go beyond the control limits, are indicators that something “special” is going on that requires immediate investigation.
The People Side of Measure
Unfortunately, the only experiences that many people in service environments have had with “data” are negative: figures used to prod greater performance or punish low-performers, facts used to justify layoff or cutbacks, statistics misused to justify spurious arguments. Therefore, you should expect some level of distrust or wariness when teams first begin data collection efforts. As with most people issues, the solution lies in communication and involvement: asking staff to help decide what data should be collected and why, how it will be used, getting their help whenever appropriate in developing data collection forms or gathering the data itself, and so on.
Basic Elements of Analyze
The purpose of the Analyze phase is to make sense of all the information and data collected in Measure, and to use that data to confirm the source of delays, waste, and poor quality. A challenge that all teams face in Analyze is sticking to the data, and not just using their own experience and opinions to make conclusions about the root causes of problems. The most common tools used in Analyze are those used to map out and explore cause-and-effect relationships (5 Whys analysis, cause-and-effect diagrams, scatter plots, design of experiments, etc.).
Analyze Tools
The data tools used in the Analyze phase serve the pimary functions of allowing a team to make sense of the data it’s collected and to find patterns that point towards underlying or root causes that will need to be addressed in Improve.
Scatter Plots
The scatter plot is a simple tool that can help determine if a relationship exists between two measures or indicators. For example does the “backlog of work” correlate with the “error rate of computer data entry”? Scatter plots provide a powerful visual image of how potential input variables are (or are not) related to the targeted process outcomes.
Often, the visual impression is enough to confirm (or rule out) a specific course of action—such as whether a potential cause should be specifically addressed by countermeasures. If necessary, more advanced statistical tools such as regression analysis can be used to quantify the degree of relationship between the two factors (see Figure 11.8, previous page, and Lean Six Sigma, pp. 199–200).
Figure 11.8: Scatter Plot
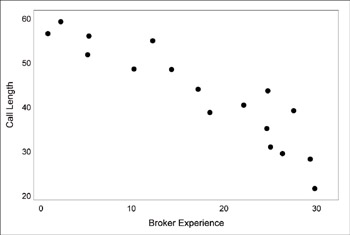
A team will look for the pattern on a scatter plot to determine whether two factors are related. This plot shows a “negative correlaion”—as “broker experience” gets larger, “call time” gets shorter. In other words, inexperienced brokers take longer to complete a call than more experienced brokers.
Time Trap Analysis Complexity value stream analysis
One of the major themes of Lean Six Sigma is that slow processes are expensive processes. In most processes, the work (forms, calls, requests) spends only 5% of its time in value-add and the rest waiting around, being reworked, and so on. By increasing value-add to 20%, you can reduce non-value-add work (and costs) by 20–50%. How to achieve such a substantial increase in value-added time in a process? Another theme of this book is that 80% of the delay is caused by a few Time Traps. By identifying these Time Traps, we can identify the improvement projects that will drive the cycle efficiency over 20% and hence make a major impact—typically improving operating profit by 5% of revenue and reducing WIP by 50%.
A trained Black Belt can facilitate a team through a value stream mapping event to calculate minimum batch size, identify the hidden Time Traps, and so on. As discussed in Chapter 4, specialized complexity value stream mapping software is available as a supplement to manual calculations. It can link traditional capacity planning capability that your company likely uses already and the new information needs associated with Lean Six Sigma projects.
The People Side of Analyze
The biggest people challenge in Analyze is overcoming the unfamiliarity that most team members will have with data analysis tools. Having expert guidance from a trained Black Belt or other coach is invaluable, especially if he or she takes the approach of helping the team do the analysis themselves.
Basic Elements of Improve
The sole purpose of Improve is to make changes in a process that will eliminate the defects, waste, costs, etc., that are linked to the customer need identified in a team’s Define stage. Common tools and strategies you’ll find referenced in any discussion of the Improve phase of DMAIC are those such as solution matrices that link brainstormed solution alternatives to customer needs and the project purpose, and methods for implementing desired solutions.
Lockheed Martin has developed its own version of a solution matrix they call a PICK chart that their service teams have found very useful to prioritize the ideas for implementation (see Figure 11.9).
Figure 11.9: PICK Chart (sample from Lockheed Martin)
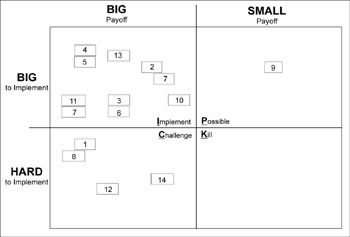
A PICK chart helps a team organize and prioritize its solution ideas by separating them into four categories: Possible, Implement, Challenge, or Kill. Here, most of the solution ideas were easy to implement and would have a big payoff—they fell into the Implement quadrant. Four ideas would have a big payoff but were harder to implement, so the team needed to Challenge these ideas (was the payoff really that big? were there easier ways to accomplish the same effect?). Only one idea had a small payoff, and therefore was considered Possible; no ideas fell into the automatic Kill category. The next step is to schedule, secure sponsor approval, and fund the activities selected by team consensus, implement them, and track the implementations.
Many of the Lean tools play their most important role in Improve. Pull systems have been discussed extensively in Chapter 2 and again in Chapter 10; here’s a quick look at three others:
Lean Improve Tool #1 Setup reduction
A P&L manager who wants to prepare a monthly report starts gathering together the information he needs. He realizes that this month’s sales figures aren’t broken out by region, so he
calls over to accounting and tells them to email the regional split as quickly as they can. He also discovers that he has updates on only three of the four Lean Six Sigma projects in his unit. The Black Belt for the missing project is out on the floor that day, so he spends a few minutes tracking her down and getting a verbal update. Then all he has to do is get the month’s wages/benefits figures from HR, and he’s ready to work on that report.
# # #
Dave, one of the more experienced technicians in IT knows more about PCs than nearly anyone else in the company. Trouble is, the graphic design group is on Macintoshes. So even though Dave spends 95% or more of his time supporting the PC users, he still has to answer a handful of calls each month from the Mac users. He describes the experience as having to “reconfigure” his brain so he can switch from thinking in Windows to thinking in OS X.
# # #
Marcie over in Personnel is the gatekeeper of incoming job applications, some of which arrive by mail, some by fax, and some via the company’s website. She’s found it is more convenient if she waits until she has a stack of at least 20 applications that she can log into the database all at once, rather than trying to do them as they come in.
Odds are that at least one of these examples reflects what happens in your job—needing to track down information to finish a task, switching from one set of tasks to another, having some element of your job that you only rarely perform, processing work items in batches because it seems more convenient and efficient that way. What’s common among these situations is that people involved are diverted from being able to perform the value-added work associated with their jobs.
Perhaps now that you’re becoming a Lean thinker, you can start to recognize that although each of these job practices are common in service functions—and usually accepted as “the way work is done”—they each represent non-value-add work that increases delays and WIP. That means they also impede the quick completion of value-add work.
In Lean terminology, the three situations described above are all considered setup problems that delay or interrupt people as they try to complete their value-add work: The first case, there are delays as the person tracks down the information. The IT support employee is less efficient at work he performs infrequently because of the learning curve, having to switch his brain from one way of thinking to another. Job applications are delayed because the gatekeeper prefers to work in batches.
A good example of the impact of setup time was described in Chapter 2, where the buyers at Lockheed Martin’s MAC-MAR procurement center ended up “locking onto” their internal customer sites (rather than purchasing all priority orders first) because of the length of time needed to switch from site to site, and the learning curve costs from having to remember 14 different sets of product codes. In that case, the solution was a custom software tool that allowed the buyers to see all customer requirements in priority order, rather than batched one customer at a time. Discussion of this example also showed how setup occurs anytime a change in task causes a drop in productivity, because it will force us to stay on that task for a longer period of time, delaying service to other tasks.
The tool for attacking setup time is the Four-Step Rapid Setup method. The principle of this method is to eliminate anything that interrupts or hinders productivity. Here’s how it works in service applications:
STEP 1: Identify and tabulate any process-related work that fits into one or more of the following categories:
- that delays the start of value-added work
- causes interruptions to value-add activities
- where it takes people time to get up to “full speed”
- that is very similar or identical to another task in the process
This is where your ability to recognize waste really comes into play. Typically, it’s the hardest part for people in service functions because there is so much waste and non-value-add work that is taken for granted. What you have to learn to do is objectively observe people as they perform the tasks of a process and note anything that prevents them from performing the value-add work.
- Try to develop an awareness of when you or the person you are observing is delaying, slowing down, or stopping value-add work and ask yourself why.
- As shown in the examples above, for instance, the “why” could be the lack of information, the need to refresh your memory if you are switching tasks or doing something you don’t often do, the need to have a certain number of items in queue (batched) before you begin the work, and so on.
For the purposes here, focus only on delays or interruptions that are related to the process. For example, a buyer completing a purchase order may get a phone call from another employee who is requesting information. That buyer will likely interrupt the processing of purchase orders, but that delay is not caused by something inherent in the PO process.
The question about looking for work that is identical to other steps in the process is intended to help you recognize duplicative work that has grown up as product or service offerings/features have expanded over time. If you discover tasks that are similar to other tasks, ask yourself if they can be combined, thereby eliminating the need to switch tasks, do additional setup, and so on. If so, implement the change as quickly as you can.
STEP 2: See if any of the interruptive/delaying tasks can be offloaded
What you’re looking for here is ways to handle preparatory work outside of the main process flow so the information or material ends up waiting for you, not vice versa. The goal is to have people zip through all the value-add work in a process without any delays or interruptions.
Focus in on any activity or task where you have to stop the process. Then ask yourself why those problems appear, and figure out how to eliminate that source of delays or interruptions.
For example, in the Lockheed Martin procurement story we’ve referenced multiple times, the solution was to develop a software application that could automatically log into the legacy systems at each of 14 sites every night, and then have all that information compiled and waiting for the buyers when they arrived at work in the morning. In other words, the “tracking down of information” was offloaded to a new software application so it was no longer a source of delays.
STEP 3: Streamline or automate any interruptive/delaying tasks that cannot be offloaded
In any process, there will be some delaying or interruptive factors that are deeply woven into a process. Be creative in trying to find ways to either eliminate or drastically reduce the amount of delays that these tasks inject.
In the procurement case study, one of the issues was that each of the 14 legacy databases used different part numbers for identical components. While “matching the part number to the component” was a step of the process that couldn’t be eliminated entirely, the company did invest in developing a database that automatically matched the site part numbers to the needed component. So that was work the buyers no longer had to do each time.
Similarly, many pizza chains today just ask for your phone number the second time you order. They have eliminated the need to ask for your address, name, and directions a second time.
There are several streamlining approaches that can be used when the cause of the delay or interruption is related to “learning curve” issues associated with infrequently performed tasks. One is to funnel all the requests of a certain type to one highly skilled or specially trained person to increase the frequency (e.g., if 10 calls for Mac support came into the IT department described above, have Dave handle all 10 calls rather than having each of ten people only handle one Mac call a month). Or there are often ways to provide visual or automatic reminders that eliminate the need for people to remember the specifics of obscure processes (such as having pull-down or pop-up menus on a computer screen).
- Only batch if you can’t solve the setup problem.
- Try to reduce complexity so you don’t have so many setups in the first place. Remember, the greater the complexity of the tasks performed, the lower the frequency of performing any single task, which leads to a continuous loss in productivity due to learning curve issues.
STEP 4: Bring the process under statistical control
The final step in this method is another example of using intelligence instead of money to solve problems. The setup is not complete until the output of the process is “in spec” and under statistical control (meaning the amount of variation in lead time is within predictable limits of 3s). An automatic reporting system should note any deviations outside this limit. As you observe the new process in operation, look for any ways to reduce variability in how the steps are completed or in the time it takes to complete them.
Typically, the ideas require only a modest amount of capital. The amount of setup reduction accomplished by this step is very dependent on the complexity of the task, and can vary from 30% to 100%.
The examples we have given show both the importance of reducing setup time and the applicability of this tool to the service environment. It is clearly critical to reducing process lead times (along with Pull systems and other Lean tools). Moreover, the tool is cheaper and more effective to apply in service than in manufacturing.
A Lean tool by any other name…
If you use the Four Step terminology used here in a manufacturing plant, they won’t know what you’re talking about. The more common terms sound like rather poor English translations of Japanese terms. To find out more about this method, look for the following terms:
- Separate internal from external setup (“Internal” setup means activities that can only be performed with the process “down.” External setup activities can be performed in parallel)
- Convert internal to external
- Streamline any remaining internal setup
- Eliminate adjustments
How much setup time should you allow?
In the Lockheed Martin procurement example, where buyers locked onto one site due to legacy software issues (as described in Chp 2), the original setup time was 20 minutes. This setup dropped to 0 minutes once the process was attacked with Lean thinking and tools. But even under the old system, the Buyers could have worked more efficiently had they known about the “ten times setup” rule, which says you should stay on one task only ten times as long as it takes to do the setup, because productivity falls off after that.[1]
In this case, that would have been just over 3 hours (10 x 20 min = 200 min)—you can see that the curve in Figure 11.10 rises rapidly until just around 3 hours (180 min). So even without other improvements, applying this rule—meaning buyers would switch after 3 hours even if they weren’t done with that customer site—would have allowed buyers to cycle through all customers in less than 6 days. Since it often took them 14 days or more, this would have been a great improvement in a key customer requirement.
Figure 11.10: The “Ten Times Setup” Rule1
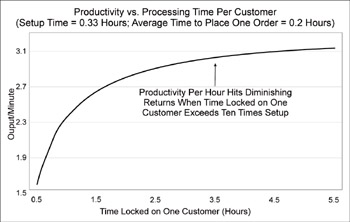
The graph shows that the benefit of staying “locked on” to one customer before moving onto the next starts to rapidly fall off after roughly “ten times” the 20-minute setup delay (200 min or just over 3 hours).
Lean Improve Tool #2 Queuing methods for reducing congestion and delays[2]
Often congestion occurs because of variation in demand, much like the effect that variation in arrival time and check-in times had on the hotel check-in process described earlier in the book (p. 114). In that case study, though the average check-in time was 5 minutes, guests often had to stand in line 10 minutes or more due to congestion at the check-in counter. Variation in the time it takes to perform various tasks can also lead to congestion and delay, and follows the equation on p. 124.
Once identified, there are three principle techniques for reducing congestion that arises from variation in the demand for services:
- Pooling: Cross-training staff to step in during times of peak loads. One hotel chain, for example, trains office and other staff to help out with registration with both unexpected peaks and predictable peaks.
- Triaging: Sorting jobs into categories that reflect different levels of effort required. Typical schemes include: fast service times vs. medium times vs. slow service times; easy and small problems vs. real problems vs. catastrophic problems. Then develop different routings, strategies, or resources to deal with each category. We saw an example of triaging in the marketing quotatio`n process described in Chapter 2, where they ended up establishing a cap on WIP and “releasing” work into the process.
- Back-up capacity: Pooling and triaging are very effective in knocking the peaks off delays that result from demand variation. But what happens if the excess demand for a given offering is sustained? You’ve already used up all the possible alternate sources of capacity through pooling, and intelligently quarantined the troublesome products by triaging. You could use overtime for short periods of time to cover a peak, but this is an expensive and non-sustainable approach. To deal with a sustained peak, the best approach is to cross-train any operators/staff in the work areas that have high demand fluctuations. By juggling scheduled downtimes (such as lunch, coffee breaks, etc.) you can usually provide sufficient coverage to effectively add 20% more capacity. Finally, if the demand is truly sustained (as documented by trends on a control chart), you will have to add people or equipment.
- Reduction of variation in processing time: In the auto repair example (above), the variation of repair time within each of the triaged processes was dramatically reduced. For the procurement buyers at Lockheed Martin, there effectively was no variation in the time to place an order in many cases—40% of the orders were “point and click” once the commodities were put on contract.
Triaging
The principle of triaging has been applied in a variety of situations with remarkable success. Take, for example, one auto body repair shop. As in traditional repair shops, each mechanic had three to five cars to work on (= lots of WIP), each with varying degrees of damage. The lead time to complete repairs was 2–3 weeks, much to the chagrin of customers and insurance companies. By triaging the incoming jobs based on the degree of damage, the light wrecks were repaired in an “index line” in which cars moved on to a new repair activity every four hours. Using this method, the lightly damaged cars could be repaired in just 2–3 days. Medium and heavy wrecks were sent to the more experienced/skilled mechanics in traditional bay repair. Costs were better understood, gross profit margins rose, and customer and insurance companies were delighted, and mechanics made more money through higher volumes. What was lost? The non-value-add cost!
Lean Improve Tool #3 5S+1
Think about how you spend your time during the average workweek. How much of that time do you think you waste looking for the right folder, the right file, the right piece of paper? How often to you scramble through your office trying to find a self-stick note, a pencil, a marker, an envelope? Does your office look like Figure 11.11 below?
Figure 11.11: A “before” workspace from Lockheed Martin
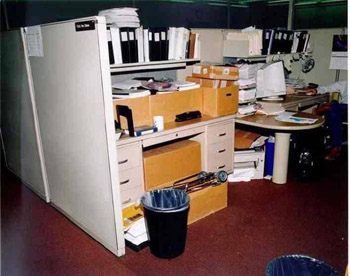
For some reason, clutter is something that most of have learned to live with in our professional lives. To some, it is even a badge of creativity.
But the fact is that clutter and disorganization are significant contributors to wasted time in office environments. Putting effort into organizing your (and your work group’s) workspace can sometimes have almost miraculous results in making your organization more efficient. The goals are to (1) eliminate wasted time as people perform their everyday tasks, (2) present a professional image to customers, and (3) enable staff (or temporary workers) to seamlessly step into a coworkers shoes during travel, sick days, meeting times, and so on. This is enabled by having a place for everything and everything in its place—clearly laying out a work area.
When combined with the Lean tool known as visual management, you can have a self-running, self-regulating organization. A visual workplace stresses communication via bulletin boards, graphics, status boards, web portals, dashboards, etc. that make performance of the process immediately visible to any one walking into the work area. The purpose is to assure that everyone knows the current priorities, status, and upcoming events, with no filtering.
Components of the 5S+1 System
Historically, the basic elements of getting a workspace organized were defined by the five S’s:
Sort: Organize, separating the needed from the unneeded (SEIRI)
Straighten: Arrange and identify for ease of use (SEITON)
Shine: Clean and look for ways to keep it clean (SEISO)
Standardize: Maintain and monitor the first 3 S’s (SEIKETSU)
Sustain: Discipline, stick to the rules and maintain motivation (SHITSUKE)
Lockheed Martin and other organizations often add on one more S (hence the notation 5S+1):
Safety: Removing hazards and dangers
The 5S method can be applied profitably to virtually any activity. In one case, a company was considering buying more computer servers and routers for an on-line banking application. Before the capital requisition was approved, a Black Belt decided to “5S” the servers. It turned out one of the servers had 70% of its capacity serving the data requirements of less than 5% of the users! Further investigation showed that the majority of this data was infrequently used and not required in real time. Major server capacity was gained simply by archiving that data. You’ll find an example of how the 5S’s are applied in Chapter 13.
Caution note:
“5S is normally the first thing performed in a manufacturing situation because of the need to see ‘flow’ of physical inventory. In an office environment it should be a third or fourth improvement action because office people are more likely to see it as threatening their personal work space than are machine shop employees. It must be 100% led and backed by the managers, and implemented by respected people from the work area. You are going for culture change.”
—Myles Burke, Master Black Belt, Lockheed Martin
The People Side of Improve
Nothing really changes in a process until the Improve phase of DMAIC… which explains why you’ll need to pay extra attention to people issues: communication, involvement, and commitment. Usually, team members are representative of a larger group of people who work on that process. A team can make implementation go much more smoothly by communicating with their coworkers regularly—especially if it is two-way communication that invites involvement and commitment. For example, the team can share their thoughts on potential solutions, get feedback from other coworkers, and ask for volunteers to help try out the changes on a small scale. The use of Kaizen events (see p. 52) to facilitate Define and Measure work can pull together the team and make communication proactive, preparing members for the Improve work.
Another people issue in Improve is getting sponsor support to the impending changes. The sponsor (and process owner, if he/she is not on the team) must be involved at this stage because they control the funding and systems that will be needed to accomplish the change.
[1]The “10 times” rule only applies if there is no variation in demand, no defects, no downtime, etc.
[2]Much of these practical results of Queuing Theory are due to Professors James Patel and Mike Harrison of Stanford University Graduate School of Business
Basic Elements of Control
The purpose of Control is to make sure that any gains made will be preserved, until and unless new knowledge and data show that there is an even better way to operate the process. The team must address how to hand-off what they learned to the process owner, and ensure that everyone working on the process is trained in using any new, documented procedures. Six areas of Control are critical in service environments:
- Making sure the improved process is documented (and that documentation is used regularly)
- Turning results into dollars (validated by the finance department)
- Maintenance of gains is verified down the road
- An automatic monitoring system is installed which will identify “out of control” performance
- Piloting the implementation
- Developing a control plan
Make sure the improved process is documented (and that the documentation is used regularly)
Service processes rely on the habits that staff develop as they perform their work. Changing those habits is a lot harder than changing the switches on a machine. You must document the new steps with a written procedure, train people on the new procedures, and make it easy for them to use the new process (and hard to use now-outdated procedures), so that people don’t slip back into their old habits. The process owner must be responsible for seeing that this documentation and training occur, and for developing ways to ensure the methods continue to be used.
Always turn results into dollars
Lean Six Sigma is not a “feel good” undertaking like some of its predecessors turned out to be. It is not a “mile wide and an inch deep.” Lean Six Sigma is focused on high value projects. Companies do it to make themselves more competitive and more profitable. Project results must be verified financially, before the project is launched, tracked thereafter (and reported to the CEO). Work with financial analysts in your organization to develop methods for verifying improvements and quantifying their financial impact (cost reduction or avoidance, increased revenues, etc.).
That said, however, it’s also important to realize that not all gains can be easily quantified. Some gains are simply more easily tracked by current accounting systems than others, such as a reduction in the use of supplies, or increased sales volume due to increased capacity. Other types of gains are immeasurable, such as the increased confidence that comes when employees have been involved in improving their own process.
… and one Six Sigma Improve tool that’s often overlooked
in service applications (Design of Experiments)
Lean tools aren’t the only ones that are often overlooked in the Improve phase of DMACI. Another under-used tool is Design of Experiments (DOE). DOE is a method for simultaneously investigating anywhere from a handful to dozens of potential causes of variation in a process. DOE used to be solely the domain of the statistician, but simple software tools have made it accessible to many. Here’s one example of how it can be applied.
A large carpet company had hundreds of retail operations, with huge variation in sales per store. Over 1500 ideas were generated about the reasons for that variation. They boiled the list down to 12 major factors that could potentially affect why some stores sold more or less than others. By using a designed experiment to study these 12 factors and their interactions, they determined which were most critical for increasing revenue. The experiment showed that the biggest factors that consistently drove store revenue up were (1) the quality of the greeting of customers, and (2) displaying carpet under a variety of light sources (solar, fluorescent, incandescent) because customers really appreciated this differentiated offer. Being able to focus on just these two factors (instead of spreading its efforts among 1500 “good ideas”) and standardizing the practices among all stores (investing in the light sources, training of sales people) generated a 20% average increase in store sales.
Verify the results at a later point in time
Organizations experienced with improvement know that it can take awhile for people to become comfortable with new procedures, so they usually perform a check two or three months after the project is officially done to verify the changes are still in place.
Set up an automatic alert system
The widespread use of computer systems has made it possible to add automatic warning systems that immediately alert staff about process performance, or, more specifically, provide warnings if something has gone wrong. Some companies use a web-based “digital dashboard” that displays real-time numbers on key process metrics; others have programs that automatically generate an email report on yesterday’s (or last hour’s) performance. As a minimum, implement a manual monitoring process for a few months after making a process change to assure the process is stable and producing the desired results.
Piloting implementation
A pilot is a small-scale test of the solution, and as many projects as possible should take advantage of the opportunity for a pilot. A pilot could be conducted over a specified region, at a particular facility, with a beta version of a technology solution, with just a few personnel, or it could be anything that simulates how the service will work when it is implemented. Run the pilot long enough for adequate data collection. The pilot data should be sufficient to prove to the leadership and those affected by the solution that the new service meets their requirements. Positive benefits of piloting include increased buy-in, early realization of benefits, and the possibility of minor modifications to the solution to improve it. The other significant benefit is risk mitigation. The team needs to learn as early as possible where potential issues are, and to manage the implementation to avoid unintended negative consequences.
Developing a control plan
The team will also develop a process control plan to ensure that the new process continues to satisfy requirements over time. A process control plan usually builds on the future state process map, indicating who is responsible for what in the new process. Also, metrics that will be critical to the ongoing process are identified, along with how the data will be captured and displayed. Control charts for costs, revenues, productivity levels, or customer satisfaction data are common. Visual process control tools are helpful for communicating performance. Ownership of the new service will be finalized, along with a process management team to monitor ongoing performance post-implementation.
The People Side of Control
Just as with Improve, the ability to Control a service process depends entirely on the people who work on that process day in and day out. The difference is that here a team has to make sure that it’s the process owner who takes responsibility for seeing that process documentation and procedures are maintained (and used).
“The Control phase is normally a crossover point,” says Roger Hirt of Fort Wayne. “When I was with GE, it was where the process owner took over. We had a control measure that required the process owner to sign off, indicating they understood and knew what the control plan was. The Black Belt stayed in only until the changes were in place, then the process owner took 100% ownership.” The model being used at the City of Fort Wayne is a little different, he adds. “We are training the process owners directly, and having them work on projects in their work section to improve their job performance… and make their life easier.” That means transition issues aren’t as challenging because the process owners have been involved throughout the project.
Another important people aspect of Control is communicating with those who were not directly involved in the project… a lesson that Stanford Hospital and Clinics learned the hard way:
The cumulative result of different projects focused on cardiac bypass graft surgery at Stanford Hospital and Clinics was that patients were able to be discharged much sooner and often experienced fewer complications. But the hospital team soon discovered they had ignored a vital link in patient care: The cardiologists who did the referrals would tell patients, “You need a coronary bypass graFort You’re going to be in the hospital about nine days.” So the patient would go through the surgery and four days later be told they were being sent home. While people aren’t typically upset at being released early from the hospital, these patients—expecting a nine day hospital stay—were convinced it was all a cost cutting measure and that they hadn’t really gotten their full measure of care. They were also concerned because their family members weren’t prepared to take them home at day four. And that’s how Stanford discovered that part of their control plan had to be communicating with anyone who dealt with patients.
Control tools
One control tool, control charts, was already discussed under Measure (see pp. 288-289). Two closely related concepts that are very helpful in Control are mistake prevention and mistake proofing. Mistake prevention means working to find ways to make it difficult or impossible for operators to make a mistake in the first place. Mistake proofing means that even if a mistake occurs, it cannot be passed onto the next step of the process.
In manufacturing processes, mistake prevention takes the form of designing components so that they can only fit together in one (correct) way; mistake proofing occurs by making sure that a piece of equipment, for example, simply won’t accept a component or material that is incorrect.
In paperwork processes, mistake prevention increasingly occurs via software solutions. In one Fort Wayne process, for example, a field on a computerized form will only accept numerical characters (operators used to mistakenly enter alphabetical characters as well). The same form also has pop-up windows to provide instructions if needed.
Improving Your Improvements
Manny Zulueta, the VP at Lockheed Martin’s MAC-MAR procurement center, has set his staff an ambitious goal of having all their teams complete the full improvement cycle in 30 days. They aren’t there yet; typical teams take 3 to 6 months. So they decided to apply improvement logic to getting better at improvements, and collected data on 25 teams in operation during the first 6 months of 2002. They looked at whether the team had followed the full DMAIC logic (and if so, how long the teams spent in each phase), had adopted an intensive Kaizen approach, had gotten together for a value stream mapping exercise, and so on.
What they discovered was that by far the teams spent the most time at their equivalent of the Improve stage—deciding on, implementing, and validating improvements. There were four main contributors to the long cycle time in this phase:
- Poor planning of improvements
- Poor project management
- Little or no sponsor involvement
- Project scope was broader than initially thought
As a result of this analysis, they have developed better training on planning and project management skills, and have made changes to their DMAIC process to ensure better involvement of Sponsors throughout the project. They are also working on ways to divide the “solve world hunger” problems into more manageable pieces.
Learning More About the Lean Six Sigma Tools
There are far more Lean Six Sigma tools than can be covered in this book, as shown in Figure 11.1. Note that the list encompasses Lean, Six Sigma, and complexity analysis tools. A balanced toolset like this is needed so you can tackle any problem that comes your way.
However, keep in mind the advice from Myles Burke of Lockheed Martin: “Of the literally hundreds of improvement and data tools, there’s maybe a quarter you use regularly because they fit so many different situations. Focus on teaching and learning those. The other ones—I call them the exotic or sexy tools—are useful only in very specific circumstances and should be close by for quick reference when you see the need. All tools need not be mastered to be a successful Black Belt. My most used tool is asking ‘why’ five times to a team and seeing them ‘get it.’ Work with your Black Belts to identify those tools most likely to be needed by your teams, and customize training around that subset.”
Conclusion
The final lesson on running effective projects comes again from Myles Burke of Lockheed Martin: “What’s the right way to run a team? Whatever is quickest to get you where you want to be. We’ve had teams that didn’t complete every step of our model, but they got out what they wanted and the results have stuck. Remember you are teaching people to see waste and value and non-value-added tasks. Do not let Lean Six Sigma be perceived as bureaucratic. Be flexible to what makes sense.”
Part I - Using Lean Six Sigma for Strategic Advantage in Service
- The ROI of Lean Six Sigma for Services
- Getting Faster to Get Better Why You Need Both Lean and Six Sigma
- Success Story #1 Lockheed Martin Creating a New Legacy
- Seeing Services Through Your Customers Eyes-Becoming a customer-centered organization
- Success Story #2 Bank One Bigger… Now Better
- Executing Corporate Strategy with Lean Six Sigma
- Success Story #3 Fort Wayne, Indiana From 0 to 60 in nothing flat
- The Value in Conquering Complexity
- Success Story #4 Stanford Hospital and Clinics At the forefront of the quality revolution
Part II - Deploying Lean Six Sigma in Service Organizations
- Phase 1 Readiness Assessment
- Phase 2 Engagement (Creating Pull)
- Phase 3 Mobilization
- Phase 4 Performance and Control
Part III - Improving Services
EAN: 2147483647
Pages: 150
