Service Process Challenges
Overview
Suppose you asked a dozen people who all do the same kind of work in your organization to walk you through what they do, step by step. What are the odds, do you think, of getting the same answer from each person? You’ll probably end up with a dozen different descriptions.
Here’s the question: How can you improve a process that is really a dozen different processes? How can you improve something that doesn’t really exist? In all likelihood, some combination of the dozen different procedures will comprise a better process, one that produces consistently better results, with less rework and waste.
The lack of a documented, standard process that everyone is trained on is just one of many reasons why improving service processes can be particularly challenging. Filling that gap is a critical point in service improvements, because it reduces variation and waste, and opens the door to significant Lean Six Sigma gains. This chapter explores the lack of process awareness and other barriers you may face in trying to improve service processes, and discusses ways to overcome or avoid typical problems.
Process Challenges in Service
The nature of service work makes it sometimes harder to identify what needs to be changed and how to fix it. Chapter 2 already discussed the fact that service processes are far less visible than manufacturing processes. You can’t stand in an office and watch materials flow like you can on the factory floor. So one challenge will be to take full advantage of tools that take invisible work and make it visible. Post process maps and charts in the workplace. Other challenges include:
- Tracking of flow: Manufacturing operations use a “router” to schedule and track the flow of materials through a process, so even if the process has not been mapped in the Lean Six Sigma sense, there is still an awareness of process flow. Service processes have no custom around using routers so there is no way to know where any given piece of work is at any point in time. Consequence: Encourage your staff to be creative in thinking up ways to know what stage of the process any individual work item is in.
- A tradition of individuality: People working in service areas are typically given some guidelines or an overview of how their work should be performed, but they are generally left to their own devices to structure their daily tasks. This individual control over work has led to resistance to defining processes in service areas—people fear losing whatever creativity and freedom they have in being able to do their job anyway they see fit. (In fact, standardizing processes usually gives them more freedom to be creative in their jobs, but we’ll explore that in more detail later.) Consequence: The only way to get people to accept process changes (relatively) easily is to involve them in deciding what has to change and how.
- The lack of meaningful data/the lack of data-based decision making: Do you know how much work you have in queue at this very moment? Do you know how long, on average, it takes you to handle those work items, be they phone calls, requests, reports, bills, orders, etc.? Do you have a way to find out? Could anyone in your office answer questions about the quantity, quality, and speed of their work? Chances are the answer is no. Consequence: Expect improvement teams to spend a lot of time on data collection issues. Transactional environments have one universal metric of quality—the time it takes to complete a job or task—but almost anything else requires a lot of judgment. And even if your organization has data, most likely it will be raw numbers sitting in an obscure file or database. Roger Hirt of Fort Wayne, for example, noted that they’ve got a lot of data, but often can’t get it out of the software.
“Even today when you walk into a lot of banks and you say, ‘Where’s your documentation on your process,’ they say, ‘Go talk to George, he’s been here the longest.’ It’s still like that. Things aren’t documented.”
—Bryan Carey, DeLeeuw Associates [former VP at Bank of America]
The need for service data
A utility company operating in a deregulated environment suffered a great deal of “churn,” losing existing customers about as fast as it gained new ones. This created a severe burden on marketing cost and effectiveness. The assumption had grown up that the churn was principally caused by high turnover among new customers who had just taken possession of their home from a builder and did not know who their utility provider was nor the many benefits offered. These new customers were, the reasoning went, unsuspecting targets of rival power suppliers. So the company sent a Welcome Pack explaining their services to thousands of new customers every week, at a cost of about $8 apiece. A Lean Six Sigma team subsequently collected data on churn and found that it wasn’t these new customers who were leaving; they accounted for about 4% of the total. Most of the churn was the fault of long-term customers deciding to switch providers. The effort on churn was re-directed. Like most improvement projects that are not data driven, a complete victory of the Welcome Pack effort would have delivered negligible results to the bottom line.
- People can’t be controlled like machines: Service processes are far more dependent on the interaction of people (both internal handoffs and working with customers) than are manufacturing processes. In a relative sense it is much easier to do something like “reduce the setup time on a piece of equipment” than it is to “reduce salesperson preparation time per sales call.” People are your major asset but they are also your major cause of variation, and they can be resistant to changes imposed on them. Consequence: Pay particular attention to people issues at each stage of improvement. This is achieved by including people working in an area on the team. They should receive enough training so they understand why the data they are collecting is important. They understand the work process better than the Black Belt, so involve them in decisions about data collection; invite input on improvement ideas; communicate plans for improvements before actions are taken; share results as widely as possible.
These challenges may sound daunting. But actually they make improving service processes more rewarding because people get to exercise their creativity, and gains come relatively quickly (at least in early projects). In fact, the pioneers chronicled in this book saw that behind each of these challenges lay enormous opportunity to outpace the competition. Just imagine what it would mean if your sales people were interacting with the customer twice as often? If you could reduce customer complaints by 80%? If you could serve your customers twice as quickly? Think how people in your organization would feel if they could hire a new sales agent in just 30 minutes as opposed to 21 days, as happened in one company. In every service business we have seen, the opportunities and payoffs from application of Lean Six Sigma are enormous.
The best news is that these problems have already been solved in ways that you can apply. This chapter and Chapter 11 address how to approach making improvements in service processes; Chapters 12 and 13 describe actual case studies from organizations who have applied the lessons and principles described here.
And don’t forget about customers or complexity…
Two other key issues with service processes discussed earlier in this book are that (1) customers can’t be treated like inventory, and (2) complexity exacts an enormous cost on service processes. The pile of papers on your desk and the log of emails on your computer don’t mind sitting there until you have a chance to get to them. But customers waiting for service are a very different kind of inventory. You can’t pile them up and have them wait until you’re ready to deal with them. That means you’ll have to be creative in coming up with ways to continue meeting current customer needs while simultaneously improving a process. As for complexity, you’ll need to focus on standardizing components, subprocesses, etc., as much as possible (as discussed at length in Chp 5). This will help reduce process and service complexity, and put you in a stronger position to consistently delight customers with on-time and low-cost service.
The Biggest Challenge in Service Learning to recognize waste
Imagine you are a self-stick note attached to an “overnight pack” entering Bank One’s Wholesale Lockbox process (for processing remittance payments). By the time you had been through every step, up and down the elevators, back and forth between departments, you would have traveled one-and-a-half miles!
Don’t believe it? Neither did the lockbox staff at first. But as they traced the physical flow of the value stream, everyone was floored. “Well, I guess maybe it could travel that far!”
What was even more astonishing was just how much that distance could be shortened. Bank One’s team came up with a workspace design that required just 386 walking steps to complete the entire process (an 80% reduction in transportation).
The single biggest service challenges in Analyze—and, in fact, all of DMAIC—might very well be developing the ability to recognize service waste. Unfortunately, most services functions are in the same position as Bank One: they accept things like traipsing up and down hallways as simply part of the way work is done. Part of the Lean discipline is the “7 Forms of Waste”; here’s how they translate for services:
Waste #1: Overprocessing (trying to add more value to a service/product than what your customers want or will pay for). The basic theme of overprocessing is doing more work than is absolutely necessary to satisfy or delight your customers. There are two elements to overprocessing: (1) If you don’t know what your customers want, you could end up adding more “value” than what they are willing to pay for (e.g., wrapping each clothing item in layers of tissue paper might be seen as value-add in a high class boutique but would be seen as unnecessary delay at many retail stores). (2) Allowing non-value-add work to creep into a process. For example, examine a process in your organization that involves approval steps, or maybe a lot of handoffs. Think critically about each approval or handoff. Would your customer think that each of those steps is adding value? Would they be just as happy if the item only needed one signature, one handoff, so it could get to them quicker? If so, then you’re overprocessing!
Waste #2: Transportation (unnecessary movement of materials, products or information). This is one of the problems that plagued Bank One’s original lockbox process. Excess transportation is important because every move from one activity to another takes time (which is something Lean thinkers want to minimize), and creates a queue at the receiving activity. In many service processes, paperwork loops back on each activity several times… and waits in queue each time. Transportation in service processes almost always manifests itself as people constantly walking (or running) down hallways to collect or deliver materials, or the actual or virtual chasing of information (“Who has that figure? Marcy? Okay, I’ll ask Marcy… Marcy says it’s Hector…”). At one end of the spectrum, eliminating excess transportation can involve combining steps to eliminate loops (cut the hand-offs in half, and you will generally cut the queue time in half); at the other end is the option to rearrange the workspace to match the flow of the process.
Waste #3: Motion (needless movement of people). “Transportation” refers to the movement of the work; “motion” involves movement of the workers. Both are much harder to see in service environments than in manufacturing. Motion may show up as people constantly switching between different computer domains or drives; having to perform too many keystrokes to accomplish a computerized task, etc. Solutions can involve everything from rearranging people’s desks to purchasing ergonomic furniture and equipment to using software that performs tasks offline (so information is waiting for your staff rather than vice versa).
Waste #4: Inventory (any work-in-process that’s in excess of what is required to produce for the customer). Any work-in-process in excess of the amount actually needed causes non-value-add downstream costs of waiting, long lead times (per Little’s Law), and the failure to meet customer expectations. Besides all the other evils of large amounts of WIP discussed earlier in this book, it increases the probability that the sequence in which work is done will not match the sequence in which it is needed downstream. This will cause additional queue time and more motion or expediting to meet a need-by date. In service, you need to look for physical piles of forms (in inboxes, for example), a list of pending requests in a computerized email program, callers on hold, people standing in line, and the like. This excess inventory of WIP is often the result of overproduction (see Waste #7).
Waste #5: Waiting time (any delay between when one process step/activity ends and the next step/activity begins). Because so much of the work in service process is invisible to the naked eye, process mapping techniques (and especially complexity value stream mapping) are essential for finding delays in a process. Such maps highlight where work sits around waiting for someone to do something with it. Figure 10.1 (below) highlights queue time and process time data that was previously invisible.
Figure 10.1: A Sample Process Map
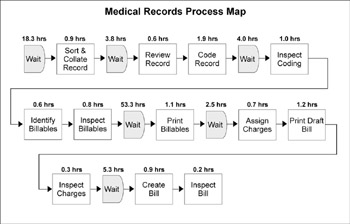
This team created a useful Lean tool simply by adding the time spent in each process step and highlighting wait time in a basic flowchart.
Waste #6: Defect (any aspect of the service that does not conform to customer needs). In services, a defect can be anything from missing information to missed deadlines that causes the customer to be unhappy with the results. Some defects are caused by activities upstream, such as when operators are given the incorrect version of process documentation (instructions, order forms, applications, etc.), others by a change in suppliers or supplied information/material. A defect is usually detected by a downstream person who either has to rework it or pass it back to the activity that made the error. The cost of fixing a service defect may be as small as a keystroke, but the opportunity cost downstream may be enormous, such as losing a customer to a competitor. (When first creating a complexity value stream map, make sure it includes the steps used to fix or repair defect-related mistakes.)
Waste #7: Overproduction (production of service outputs or products beyond what is needed for immediate use). How can overproduction be a waste? If you recall the Lockheed Martin MAC-MAR procurement example discussed at length in Chapter 2, you’ll know the answer to that question. In their original process, buyers “overproduced” (processed non-priority purchase requests) because it was more convenient for them to do so than to suffer through the delays of constantly switching between sites. This overproduction caused long lead times, downstream shortages, and waste. Several tools to be discussed in Chapter 11 explain how to eliminate problems like setup time that contribute to overproduction.
The better you are recognizing all these forms of waste, the more effective your improvement efforts will be.
Running Projects in a Service Environment
For the past decade, one basic model of improvement has dominated the Six Sigma landscape. The experts would all tell you to…
- Train about 1% of employees to be full-time Black Belts
- Have the Black Belts lead teams of 5–8 people who have received at least a day of training in the “why and how” of Six Sigma, and which may include some Green Belts
- Have the teams meet regularly for however long it takes to complete the project (say, once a week for a few hours for a period of 3 to 6 months)
- Complete every step of DMAIC or some other improvement model
Data collected on many Six Sigma deployments shows that this model usually achieves the fastest results. Having full-time Black Belts, for instance, generates twice the results (or more) than when part-time Black Belts are used.
While some of these factors affect manufacturing projects as well, coordinating, scheduling, and conducting projects, and getting people trained seems to pose greater logistical challenges in services than in manufacturing. That’s why many organizations find themselves adapting the basic model to fit their particular needs. Here are some options that may work for you:
- Be creative in finding meeting times
- Look for quick-hit opportunities
- Include improvement “events” (Kaizen approach) to accelerate DMAIC
- Reach out beyond team boundaries whenever possible
- Set realistic expectations
- Pay attention to team composition
Here’s more detail on each of these options:
Tip #1 Be creative in finding meeting times
At Lockheed Martin’s MAC-MAR procurement center, the answer to finding a common meeting time has often meant providing free lunches to employees. As professional office staff, employees were unable to give up their regular work hours, because they were already working long hours to get the job done, and they had to be available to respond to internal customers. Part-time Black Belts would stop regular work at 3pm to begin project work, sometimes working quite late into the evening. During the improvement process, people did work some uncompensated overtime to eliminate the non-value-add waste, but as a result are now working fewer hours than they had previously.
At Stanford, where staff work in three 12-hour shifts, they took a different approach. A common practice in healthcare is to have weekly staff meetings that included representatives from each group. Stanford used these meetings to conduct a brainstorming session, analyze improvement options, provide feedback on how changes were working, and so on. Data-gathering and the testing of solution ideas were conducted off-line by managers who didn’t have the front-line responsibilities and/or by front-line staff who were able to free up small increments of time. If quick input or decisions were needed, management was charged with communicating with all their staff before decisions were finalized.
Tip #2 Look for quick hit opportunities
When you first start to work on a process that has not previously been described or mapped, you’re going to expose lots of ways in which that process can be improved. Employees will be brimming with ideas on what goes wrong and how to fix it. While in general its preferable to address opportunities through the DMAIC model—where you use data to validate opportunities, select between alternatives, and so on—early on you’ll find a lot of ideas that fall into a “just do it” category. If the change is obvious and the risks are small, it makes sense to implement it without wasting a lot of time on additional data collection or process analysis. A just-do-it mentality is infectious; taking immediate action to fix problems will show everyone you are serious about change, and help overcome initial skepticism. Having a bias for action is a characteristic that will differentiate you from other companies.
The full-time/part-time Black Belt issue
It is generally acknowledged that full-time Black Belts achieve more than their part-time counterparts. But not every company has been able to devote people full-time to improvement work at the beginning. The issues surrounding the full-time vs. part-time Black Belts (and other resources) was discussed in some depth in Chapter 8 (p. 227).
Two hints if you choose a just-do-it approach:
- Do a quick check to make sure the change won’t hurt other processes or your customers (“We’re thinking of doing ______, would that affect anything you guys are doing?”)
- Identify an indicator or metric that will tell you whether the change is having the desired effect (“we should see cycle times drop within the next two or three weeks”) and have someone monitor that indicator
Tip #3 Include improvement events (Kaizen) to accelerate DMAIC
Perhaps it was impatience with how long traditional projects take; often it was an awareness of how hard it is for people to concentrate on improvement when they keep thinking about getting their work done; to some extent it was a matter of their innate respect of the people who do the work. For all these reasons, years ago the Japanese inventors of Lean manufacturing came up with a different improvement model they called Kaizen.
As you may recall from the discussion of Bank One’s improvement efforts, Kaizens are intensive “improvement events” where people work only on improvement for some period of time. In a traditional Kaizen project, the people from a particular work area come together with a few experts for 4 or 5 days straight and complete most or all of a DMAIC cycle on a limited high-priority issue (“we need to get materials to the shipping dock faster”). Kaizen events are a powerful improvement tool because people are isolated from their day-to-day responsibilities and allowed to concentrate all their creativity and time on problem solving and improvement. Companies who use Kaizens have found they (a) generate a lot of energy among those who work in the area being improved, and (b) produce immediate gains in productivity and quality.
If you can use this model of improvement, you will be amazed at the speed of results and the enthusiasm generated. However, there are a lot of situations where it is difficult to pull a handful of people off their jobs for a full week at a time. But there are ways to adapt the basic model that will allow you to still get the benefits of intensive improvement work.
For example, Lockheed Martin’s procurement operations have gotten around this constraint by using a mix of off-line work by just a few people and intensive full-team work for much shorter periods of time, typically a half to a full day. This flexible, focused time is excellent for cross-functional or larger teams where trying to coordinate periodic meetings could be a project unto itself. They have developed a pre-Kaizen checklist that assures when the team does come together they are ready to work. “The beauty here is balancing the completion of the project with the team members’ need to meet their daily job assignments,” says Myles Burke, one of their Black Belts.
In one MAC-MAR project, for example, the team was brought together for a brief meeting where the problem was explained. Then the team leader, a Black Belt, and one team member worked offline over a period of several weeks to gather data and refine the problem definition. The team was then brought together for a day to rapidly Analyze the problem and come up with complete action plans (not just ideas!) for Improve. Since the changes likely affect the everyday work of the team members, they and others were involved in making the changes real-time on the job, and establishing a Control plan and responsibility.
Bank One sticks a little closer to the traditional model, but with a few twists. Their “Focus 2.0 improvement events” last from midday Monday to midday Friday, so participants are still pulled off their job most of one full week. They make this work, however, by having their internal consultants partner with the manager/sponsor to pick problems that are extremely high priority not only for that work area but also for the business as whole. (That makes it much easier to justify taking people off their regular jobs.) Also, the goal of a Focus 2.0 event is a little more modest than a traditional Kaizen: instead of having solutions up and running full-bore, teams are expected only to get through the simulation and piloting of solution ideas. The internal consultant will then assist the team with full-scale implementation. (You can find more details on the Bank One Kaizen model in Part I, starting on p. 91.)
What makes these Kaizen adaptations work well is that they still…
- Rely on the knowledge of the people who actually do the work.
- Use data-based decision making.
- Start with a narrowly defined problem or opportunity statement—often they may be examining how they can implement a Lean principle to their process, such as “how can we make information flow better?”
- Take steps to verify that the target is likely to bring important, measurable results (e.g., use a value stream map to confirm it is a leading Time Trap, causing the longest delays). Random or “drive by” Kaizens, chosen with little forethought, at best may lead to local improvements but not contribute to significant value stream gains.
Tip #4 Reach out beyond team boundaries
Participation in projects at Stanford Hospital and Clinics fluctuates with each phase of improvement. As noted above, brainstorming and idea generation are often done at regular staff meetings where a large percentage of staff are present. The manager of each unit then brings those ideas to the “service line team” responsible for making improvements. The cross-functional teams have representatives of each major group involved with patient care: a physician Champion, clinical specialists, pharmacists, social workers, case managers, respiratory therapists, and so on. Each of these representatives will also take ideas back to their group and present updates, ask for input on alternatives being considered, and so forth.
And don’t stop at your internal boundaries. Evidence from cases you’ll see in Chapters 12 and 13 show the benefits of partnering with suppliers and customers.
Tip #5 Set realistic expectations
Mike Fischbach of Bank One comes from a Six Sigma background, so it’s no surprise he speaks the language when advising people about setting realistic expectations for team achievements. The mistake many organizations make, he says, is thinking that they achieve consistent best-in-class performance with a single project (see graph C in Figure 10.2).
In reality, most service process are both “out of control”—in the strictest sense, meaning littered with special cause variation, but in a more general sense, meaning not being managed with any understanding of process velocity and flow—and performing well-below any target. (See graph A in Figure 10.2, next page.) It’s important to realize that these are two distinct deficiencies, and should be addressed separately. The initial goal should be bringing the process in control (graph B in Figure 10.2) by application of basic process management tools and principles to remove variation, then strive to raise the performance level (graph C).
Figure 10.2: Control First… Then Improvement
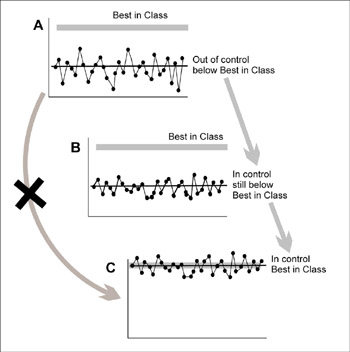
If your processes are currently not in control and are nowhere near being Best in Class (graph A), don’t expect that you can simultaneously achieve both goals (graph C). In practice, it’s easiest to bring the process in control first (developing process management skills) as shown in graph B, then work on improving its capability.
Tip #6 Pay attention to team composition
A big theme in this book has been adding rigor to decisions that previously have been based on judgment, experience, or gut instinct alone. That theme holds true when creating project teams. In some situations, you may be limited in your options for who should or could serve on a project team. But when the stakes are high and you have to select a few representative team members from among a larger pool, there are techniques you can use to be more astute about team composition.
The most effective of these approaches comes from Dr. Meredith Belbin of Cambridge University. Belbin and his team spent nine years intensively studying management teams that were undergoing executive development and working in situations that simulated real world challenges. Every participant underwent detailed psychometric and mental ability testing prior to participating in the simulations. Belbin’s group amassed a huge amount of data on the relationship between team success, personality factors, mental capabilities, and creativity (their work is described in the book Team Roles at Work).
When Belbin concluded his research, he had achieved his goal of being able to accurately predict which teams would succeed and which would fail. The fundamental discovery was that individuals have one or more Preferred Roles, and that to be highly effective, a team needs a balance of these roles. Belbin, in fact, identified nine roles, shown in Table 10.1.
You’ll note that Belbin discovered that the personal attributes that enable a person to make a particular type of contribution generally come with “weaknesses” that must be accommodated. The footnote to the table points out another important lesson: seldom is anyone strong in all nine roles. Finally, there are no “good” or “bad” roles—each role is useful, and every person’s preferred role is a good role, if they are aware of it and play it on the team.
Obviously, teams will do best with a combination of roles, and imbalances need to be recognized and dealt with. In fact, Belbin’s research identified specific team dynamics that were predictive of team effectiveness (or lack thereof):
Factors contributing to ineffective teams
- No Monitor Evaluators: without this role present, teams are unlikely to carefully weigh options when making decisions
- Too many Monitor Evaluators: paralysis-from-analysis outweighs creative ability
- No Completer/Finishers and Implementers: the team will create good strategies but not follow through
Factors contributing to effective teams
- Having a Plant leads to more ideas and better strategies, but will also require Monitor/Evaluators and Coordinators (to shape and refine ideas)
- Resource Investigators provide an external orientation
- Shapers will keep alive a sense of urgency to achieve results, essential to high performance teams
- Having too many Shapers leads to excessive conflict; make certain there is a Team Worker to facilitate relationships
- Having a Specialist when specialized knowledge is required
- Recognizing and compensating for the “allowable weaknesses” for each role
Belbin’s findings show that:
- It is necessary to understand each person’s Preferred Team Roles (there are usually more than one), which are the roles in which that person has an aptitude and learned skills.
- Companies should carefully consider the structure and composition of its teams.
- Each team must consciously use the different strengths of those on the team and manage their weaknesses.
- A team that does not have a balance of roles or a plan to address deficiencies can be predicted to fail.
- You can use this model to help prevent failure. For example, the team member with the strongest Shaper capability will be recommended as the tie-breaker in a team of Monitor/Evaluators.
Table 10-1: Nine Team Roles Role
Team-Role Contribution
Allowable Weaknesses
Plant
Creative, imaginative, unorthodox. Solves difficult problems.
Ignores details. Too preoccupied to communicate effectively.
Resource Investigator
Extrovert, enthusiastic, communicative. Explores opportunities. Develops contacts.
Overoptimistic. Loses interest once initial enthusiasm has passed.
Coordinator
Mature, confident, a good chairperson. Clarifies goals, promotes decision making, delegates well.
Can be seen as manipulative. Delegates personal work.
Shaper
Challenging, dynamic, thrives on pressure. Has the drive and courage to overcome obstacles.
Can provoke others. Hurts people’s feelings.
Monitor Evaluator
Sober, strategic, and discerning. Sees all options. Judges accurately.
Lacks drive and ability to inspire others. Overly critical.
Team Worker
Cooperative, mild, perceptive, and diplomatic. Listens, builds, averts friction, calms the waters.
Indecisive in crunch situations. Can be easily influenced.
Implementer
Disciplined, reliable, conservative, and efficient. Turns ideas into practical actions.
Somewhat inflexible. Slow to respond to new possibilities.
Completer / Finisher
Painstaking, conscientious, anxious. Searches out errors and omissions. Delivers on time.
Inclined to worry unduly. Reluctant to delegate. Can be a nit-picker.
Specialist
Single-minded, self-starting, dedicated. Provides knowledge and skills in rare supply.
Contributes only on a narrow front. Dwells on technicalities. Overlooks the ”big picture.”
Strength of contribution in any role is commonly associated with particular weaknesses. These are called allowable weaknesses. Few people are strong in all nine team roles.
A Final Tip Be conscious of your audience
One common pattern seen in service organizations is that you’re more likely to find people who will be totally new to (and possibly intimidated by) Lean Six Sigma language and methods. There are a number of ways to handle this issue:
- Translate Lean Six Sigma language into terms that will mean something to your employees (such as how “Kaizens” are called “improvement events” at Bank One). Build off any heritage language/terminology by blending Lean Six Sigma tools and methods into existing systems. The name isn’t important; the results are.
- Relate the tools and methods to specific work in your organization.
- Make sure that all examples used in training are from service applications. Manufacturing examples act like an automatic shut-down button in service training.
- Lead by example. Lockheed Martin’s Myles Burke was the first person to have his office area cleaned up (“sorted”) and organized (“straighten & shined”) according to a Lean method called “5S’s.” (See Case Study #9, p. 350 for details).
- Make sure your Black Belts and trainers are adept at explaining Lean Six Sigma terminology and concepts to people unfamiliar with data collection terms and methods.
- Emphasize the basic suite of Lean Six Sigma tools (like Pareto charts, value stream maps, and time plots) over tools that require more data sophistication (such as regression analysis or ANOVA)—but offer expert help from a Master Black Belt where needed.
Conclusion
The organizations profiled in this book can teach us an important lesson: None of them treated traditional Six Sigma guidelines as an “all or nothing” proposition. They have all adapted the methodologies to fit the specific history, environment, and business needs of their organizations. If you can’t afford to devote resources to improvement full-time, use whatever resources you can muster to buy you enough in capacity and other gains to justify greater investment in the future.
Part I - Using Lean Six Sigma for Strategic Advantage in Service
- The ROI of Lean Six Sigma for Services
- Getting Faster to Get Better Why You Need Both Lean and Six Sigma
- Success Story #1 Lockheed Martin Creating a New Legacy
- Seeing Services Through Your Customers Eyes-Becoming a customer-centered organization
- Success Story #2 Bank One Bigger… Now Better
- Executing Corporate Strategy with Lean Six Sigma
- Success Story #3 Fort Wayne, Indiana From 0 to 60 in nothing flat
- The Value in Conquering Complexity
- Success Story #4 Stanford Hospital and Clinics At the forefront of the quality revolution
Part II - Deploying Lean Six Sigma in Service Organizations
- Phase 1 Readiness Assessment
- Phase 2 Engagement (Creating Pull)
- Phase 3 Mobilization
- Phase 4 Performance and Control
Part III - Improving Services
EAN: 2147483647
Pages: 150
- Step 1.2 Install SSH Windows Clients to Access Remote Machines Securely
- Step 3.2 Use PuTTY / plink as a Command Line Replacement for telnet / rlogin
- Step 3.3 Use WinSCP as a Graphical Replacement for FTP and RCP
- Step 4.5 How to use OpenSSH Passphrase Agents
- Step 5.2 Troubleshooting Common OpenSSH Errors/Problems
