Getting Faster to Get Better Why You Need Both Lean and Six Sigma
Overview
“So far, we were able to reduce the cost of procurement by 50% while reducing the lead time for puchase order processing by over 40%—greatly improving our internal customers’ productivity and satisfaction.”
—Myles Burke, Master Black Belt, Lockheed Martin
# # #
One of the most expensive aspects of medical care is hospital stays… which puts providers in a quandary: how to reduce costs but still provide high-quality care. In the cardiac unit of Stanford Hospital and Clinics, an analysis of process flow found a capacity constraint in the “step-down unit,” used for post-operative patients who no longer required intensive care. Limited capacity in that unit resulted in patients staying longer in more expensive intensive care than was necessary. Rather than simply hiring more nurses or assigning more beds to increase capacity, a team examined the protocols used in the step-down unit, studied guidelines for determining discharge readiness, and evaluated factors that contributed to longer stays to determine if there was anything the hospital could do to mitigate or avoid those issues (such as changing guidelines for using certain drugs). A number of changes were instituted, all of which resulted in increased capacity in the step-down unit without major investment.[1]
Speed. Quality. Low cost. These universal goals have been around as long as there has been competition in business. Bryan arey, an executive VP at the consulting firm of DeLeeuw Associates, has worked in the finance industry for about 20 years, 17 of those with Bank of America. He and his colleagues have worked with countless banks and other financial institutions, and recently he’s noticed a big change:
“Historically, any change initiative at a bank always involved a negative conversation about tradeoffs. People looked at the pyramid of quality, time, and cost and thought, ‘I’m not going to be able to optimize all three.’ Line-of-business managers were all used to making autonomous decisions within their silo, never having to make decisions as a team. There’d be the CFO who cared about cost, a change manager who cared about getting quality results, and the executive sponsor of the project for whom speed was most important. They all had different priorities.
“What I’ve seen from Lean Six Sigma is that we now have a mechanism for getting everyone to talk the same language. And people are starting to realize that you CAN have all three. It’s no longer a conversation about trade-offs, it’s conversations about how to leverage them together. This is the first time you can have all the players at the table engaged in a positive conversation about quality, speed, and cost.”
Many separate disciplines have evolved to achieve these goals. As Carey discovered, only Lean Six Sigma lets you work on all three simultaneously because it blends Lean, with its primary focus on process speed, and Six Sigma, with its primary focus on process quality.
Some firms have adopted Lean or Six Sigma to the near exclusion of the other, or even allowed competing camps to emerge. Myles Burke, a Master Black Belt at Lockheed Martin, recalls a time a few years ago when he was challenged to choose: “People were either die-hard Six Sigma or die-hard Lean. There was no middle ground,” says Burke. “Once we had conflicting schedules of Six Sigma and Lean training. When I went to Lean training, my Black Belt friends said, ‘What are you doing? Are you abandoning ship?’” (Such conflicts no longer arise at Lockheed Martin due to the integration of Lean and Six Sigma into what they call their LM21 program, described later in this book.)
But it is also true that Lean advocates do not always understand the importance of Six Sigma tools in their ability to achieve Lean goals. A simple mathematical derivation (available at www.profisight.com) shows how a 10% scrap rate (= defects) increases process cycle time by 38% and the number of things-in-process by 54%. And that ain’t Lean!
Viewing Lean and Six Sigma as competing practices entirely misses the central theme introduced in Chapter 1: you can’t achieve maximum speed without also improving quality, nor can you achieve maximum quality without also improving velocity. And you can’t maximize ROIC unless you do both. This chapter reviews the key elements of Six Sigma and Lean, then explains how they are complimentary and why you need them both.
[1]Remember that Stanford’s cost achievements were made at the same time that mortality decreased substantially.
Defect free Service What Six Sigma has to offer
Zero defects, re-engineering, Baldrige, ISO 9000, TQM… any number of approaches have evolved over the years to improve quality. Yet with all of these to choose from, why would executives from companies such as GE Capital, Quest Diagnostics, Starwood Hotels, Bank One, ITT Industries, Bank of America, and Mt. Carmel Hospital embrace Six Sigma as their preferred execution tool? No other quality initiative can claim such an illustrious roster of advocates.
The answer lies in one of the simplest but most powerful Six Sigma concepts: that the outcomes of any process are the result of what goes into that process. In Six Sigma texts, you’ll find this notion captured in the simple “Y is a function of X” equation that relates an output (Y) to inputs or process variables (Xs):
Y = f(X1,X2,X3,…)
This equation holds true at the organizational level as well: any output (Y), such as profit, growth, or ROIC, is dependent on the process variables (Xs) such as quality, lead time, offering attractiveness, non-value-add cost, etc., that go into it. In order to improve the results we see (“drive the Y” in Six Sigma parlance), we have to find and focus on the critical Xs that affect that result.
There’s a deeper meaning to this equation that you’ll learn to appreciate the more you get involved in Lean Six Sigma. It’s not just that “Y is a function of some Xs”—but that it’s our job to discover the Xs that will really drive the Y. Want to increase profits? What inputs do you have to affect to do that? Want to improve quality of one of your services? What are the key inputs to the service that affect quality the most?
The more that leaders appreciate this equation, the more they start to change their behavior. They will no longer simply call for a 10% improvement in results. Rather, they’ll support Lean Six Sigma efforts so people can study and improve the processes that produce that result. When Lou Giuliano conducts a review with a P&L center, he begins by asking for a presentation on the Black Belt projects. The CEO’s focus on the Xs (which determine the Ys) supports the cycle of improvement and signals that continuous improvement is the “way we do business.”
Core Elements of the Six Sigma Prescription
Six Sigma started out as a metric and an organized group of quality tools (most of which had been around for decades). The typical business manager could not understand why it was different from TQM, and therefore why he or she should pay any attention to it. But over the past decade, Six Sigma has proven itself superior to its predecessors in several unique and decisive ways:
- CEO & Managerial Engagement. A company has one set of share- holders for whom ROIC is the common goal, one set of resources to apply to the highest value-creating opportunities. The speed, quality, and cost advantages provided by Lean Six Sigma are the drivers of ROIC. That’s why the CEO has to be out front in the support of the initiative and why failure of a P&L manager to “get on board” is not an option. The CEO should regularly communicate and demonstrate his or her engagement in the change process, and everyone on the management team should be trained on how to lead in the new culture.
- You have to allocate appropriate resources ( = staff and time commitments) to high-priority projects. One promise of Six Sigma is that full-time Black Belts can generate $500,000 per year of increased operating profit that can be tracked to the bottom line. There are two components to this equation: the number and nature of the resources, and the processes used to select projects. Companies achieving those kinds of results have typically committed about 1% of their best people—future leaders of the business—as full-time resources (Black Belts, Master Black Belts, and Champions), and another 3% of employees have received Green Belt training. (See Chapter 8 for a discussion of these various roles, including a discussion of whether Black Belts need to be full-time.) They have also developed a rigorous process—usually led by the corporate Champion—for identifying, scoping, and selecting projects based on rational criteria, such as maximizing ROIC and/or the potential effect on customers’ Critical-to-Quality issues. And, finally, they are good at tracking projects and knowing when to pull the plug if one is not performing to plan.
- Everyone affected by or involved in Six Sigma should receive some level of training. All executives and managers need to be educated about Six Sigma. The extent of the training depends on how directly the group or individual will be involved in selecting, guiding, managing, or implementing improvement. (See Chp 8 for details).
- Variation has to be eliminated. Reducing variation is a concept woven into the warp and woof of a six sigma organization. Variation in meeting a customer Critical-to-Quality (CTQ) requirement is regarded as a key initiator to guide the improvement process. Attacking and eliminating variation is accomplished by the Define-Measure-Analyze-Improve-Control (DMAIC) problem-solving methodology and supporting tools that require management to make data-driven decisions.
The Importance of Executive Engagement
Chapters 6 to 9 discuss a number of cultural practices that can help boost Lean Six Sigma commitment and results. Of those, the most important by far is senior management involvement.
For example, Vance Coffman, CEO of Lockheed Martin, has set a mandate that investment in LM21 is a bottomline competitive advantage that customers and shareholders will “see and feel” in the company’s results. This message is emphasized in each of his quarterly reviews. Early in the launch of LM21, Coffman demonstrated his personal commitment to learning and practicing Lean Six Sigma by clearning time from his schedule to participate in basic Lean Six Sigma training (see Figure 2.1).
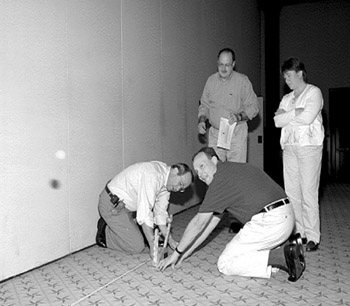
Figure 2.1: CEO Vance Coffman Leads By Example
Lockheed Martin CEO Vance Coffman is a CEO who leads by action, not just words. Here, he joins Dick Watham, Cindy Waun, and Dennis Stuart in a Lean Six Sigma training project with a “statupult” device used for training simulation exercises.
Speed Low Cost What Lean can contribute
Whereas Six Sigma is most closely associated with defects in quality and elimination of variation, Lean is linked to speed, efficiency, and elimination of waste. The goal of Lean is to accelerate the velocity of any process by reducing waste in all its forms.
The overarching benefit of Lean is the ability to see cost and lead time reduction opportunities where you never saw them before. Through application of the Lean concepts and tools, you will find that the process steps you once thought were essential are unnecessary, and their costs and delays removable after Lean tools have been applied. You’ll start to see the difference between standards and practices that are meaningful and those that are adding cost for no benefit to your customers.
Origin of the Six Sigma terminology
Six Sigma terminology arises from the relationship between the variation in a process or operation and the customer requirements associated with that process. In this normal distribution in Figure 2.2, the largest concentration of values is around the mean (average), and tails off symmetrically. The distance between the center line and the inflection point (where the curve starts to flatten out) is known as sigma (s), the standard deviation. Sixty-eight percent of the data falls within one standard deviation above or below the mean, 95% within 2s, and 99% within 3s. (So the range from -3s to +3s represents 99% of the data.)
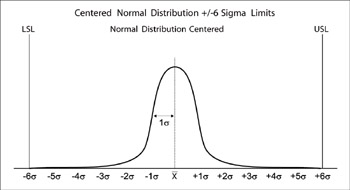
Figure 2.2: Normal curve
Six Sigma numbers represent how the distribution of actual output compares to the range of acceptable values (customer specifications). A defect is any value that falls outside customer specifications. The more of the distribution that fits within the specifications, the higher the sigma level. To make sure different processes can be compared, it’s customary to standardize by reporting a defect “rate” (defects per million opportunities) rather than raw counts.
|
Sigma Level |
Defects per Million Opportunities |
Yield |
|---|---|---|
|
6 |
3.4 |
99.9997% |
|
5 |
233 |
99.977% |
|
4 |
6,210 |
99.379% |
|
3 |
66,807 |
93.32% |
|
2 |
308,537 |
69.2% |
|
1 |
690,000 |
31% |
Being “six sigma capable” means having a process that produces only 3.4 defects per million opportunities despite expected fluctuations.
Here’s an example: Any business that was considering building in Fort Wayne was soon warned: doing business with the city was difficult at best. Among other things, it often took close to two months (avg = 51 days) just to get the proper permits. Benchmarking by a city team revealed they were at a definite competitive disadvantage against other cities that got the equivalent work done in under a month.
A team assigned to improve the permitting process soon identified the most critical steps, eliminated unneeded activities, and developed standardized procedures with clear directions. With the new process in place, 95% of permit requests are now processed within 10 days. The progress is being noticed by a number of customers, the contractors who once thought they would never build in Fort Wayne. (See p. 323 for details on this project.)
A Lean Primer
Every discipline has its own language; Lean is no different. There are a handful of terms you’ll find essential for understanding and appreciating what Lean has to offer (and that you’ll encounter throughout this book).
Lead time and process speed
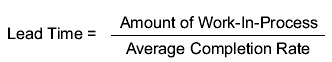
Lead time is how long it takes you to deliver your service or product once the order is triggered. Understanding the drivers of lead time is much simpler than you might think thanks to a simple equation known as Little’s Law (named after the mathematician who proved it):
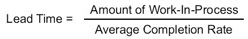
This equation tells us how long it will take any item of work to be completed (lead time) simply by counting how much work is sitting around waiting to be completed (work-in-process) and how many “things” we can complete each day, week, etc. (average completion rate).
Little’s Law is a lot more important than it may look. Most of us don’t have a clue what our average delivery or lead time is, let alone what the variation is. And the thought of having to track an order through every step in the process is daunting, especially if you have a process that takes days or weeks to complete. (Think about the permit applications staff in Fort Wayne—can you imagine having to trace one permit for 51 days?) Now we can get a reasonable estimate of any of the factors in this equation if we have data or reliable estimates of the other two. E.g., if you know your WIP and completion rate, you can estimate lead time. If you know your lead time and completion rate, you can estimate the amount of WIP in your process.
“Lean is simply creating an environment where you have the right amount of resources—where work is paced and content targeted according to customer demand. More importantly, Lean is having the ability to rapidly respond to a signal from the customer through a standardized process—which means it is predictable, controllable, and sustainable.”
—Jim Kaminski, Ass’t VP, Bank One
WIP (work in process)
Some people in service environments are uncomfortable with the term “work-in-process” (WIP) because it sounds like a manufacturing line. But the concept applies to any and all processes. If it helps you translate Lean to your own application, think of WIP as TIP (number of “things-in-process”). Those “things” can be customer requests, checks waiting to be processed, phone calls you have to return, reports you need to complete, etc.—any work that is officially in the process and isn’t yet complete. You’ll see the term WIP referenced on most pages in this book: whenever you see it, think about your own job and how many tasks there are sitting on your desk or in a computer program or voicemail log waiting for you to work on them. That’s WIP.
Delays queue time
Whenever you have WIP, you have work that is waiting to be worked on. In Lean speak, this work is said to be “in queue” (in line); the time it sits around waiting is “queue time.” Any time that work sits in queue is counted as a delay, no matter what the underlying cause.
Value add and non value add
As you begin to track the flow of work, it soon becomes obvious that some of the activities add value in the eyes of your customers (and hence is called value-added work). Another way to look at value-added work is to ask yourself whether your customers would be willing to pay for it if they were given the option of whether to pay for it if they knew it was part of their purchase price. If they would likely refuse to pay if given the choice, or would take their business elsewhere to find another supplier who didn’t have those costs, then that work is non-value-added.
Process efficiency
The critical metric of waste for any service process is what percentage of the total cycle time is spent in value-added activities and how much of it is waste. The metric used to answer this question is process cycle efficiency (PCE), which relates the amount of value-add time to the total lead time of the process:

A PCE of less than 10% indicates that the process has a lot of non-value-add waste opportunity.
Waste
As you’ve just seen, waste is anything—time, costs, work—that adds no value in the eyes of your customer. All organizations have some waste that, because of how their processes operate today, is required to compensate for internal weaknesses. The amount of waste at each activity is proportional to how long it delays the work. Lean shows us how to recognize and eliminate waste and not simply accept it as “the way work is done around here.” There are seven specific forms of waste identified in Lean practice, which are discussed in Chapter 10.
Basic Lean Lessons
The principles discussed above come together in a handful of deceptively simple but incredibly powerful lessons that allow us to achieve rapid gains through Lean. Here are the principles discussed below:
- Most processes are “un-Lean”—that is, have a Process Cycle Efficiency of <10%
- A primary goal is reducing controlling WIP (if you can’t control WIP, you can’t control lead time)
- Every process should operate on Pull, not push, to eliminate variation in lead time
- Only 20% of the activities cause 80% of the delay
- Invisible work can’t be improved: we need visual management, based on data
Lean Lesson #1 Most processes are un Lean
You probably won’t be surprised to learn that in “un-lean” service processes, most of the work—at least 50% and often more—is non-value-added. This point is easily illustrated by using colors or other techniques to visually separate value-added from non-value-added work on a process map. Figure 2.3 (next page), for example, shows the start of a basic flowchart done by a team at Lockheed Martin that discovered 83% of the activities performed between placing a purchase order and receiving the goods was non-value-added (waste)—work done to correct for mistakes, contact the vendor for a quote (when it could have been a pre-negotiated item), get a corrected drawing, or procedures to correct delays made earlier in the process. (There are more examples of this type of flowchart in Chps 12 and 13.)
Won’t speed hurt quality?
All of us have been in situations where exhortations to “work faster” only led to quality problems, and likely slower processes as well. So the natural concern is that Lean’s focus on process speed will hurt quality. But that doesn’t happen. Why? Because Lean practices reduce time by reducing non-value-add activities, eliminating queues, reducing the time spent between value-add activities, and so on. The key steps that your customers value are generally left untouched by Lean tools. Application of Six Sigma tools to value-add activities can help reduce defects, which in turn can speed up value-add steps, but since they are typically less than 10% of the processing time, speeding up value-add work has relatively little impact until after the non-value-add activities are eliminated.
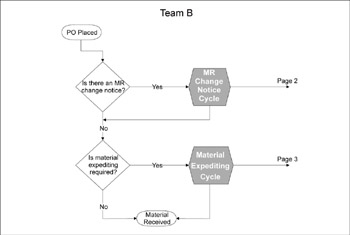
Figure 2.3: Simple Flowchart (with value-added and non-value-added work indicated)
A team from Lockheed Martin’s procurement center discovered that most of the work from placing a purchase order to receiving materials was waste (non-value-added)—rework done to compensate for errors, omissions, delays in earlier parts of the process, or for the large variety of different tasks (complexity). By drilling down the value stream (showing 248 steps in sufficient detail), then reducing complexity through standardization, they were able to eliminate most of this waste. Gains from such improvements allowed them to cut procurement costs in half.
Lean Lesson #2 A primary goal should be reducing WIP
Take another look at Little’s Law:
This equation isn’t simply some theoretical construct; it has a lot of practical implications. First of all, it shows that the two ways to control lead time are either limiting work-in-process (WIP) or increasing the average completion rate. In any operation that doesn’t deal directly with customers—that is, where WIP is orders or calls or emails or reports, not people—controlling WIP is much easier than improving completion rate. In fact, you can speed up any process—reduce lead time—by reducing the amount of WIP, even if you do nothing to improve completion rate.
This conclusion explains how people can achieve such quick gains by applying Lean principles. Wherever and whenever possible, they simply have to limit how much work they allow into the process at any given time. (Examples later in this book discuss what to do when WIP is “people” and the best way to maintain lead time becomes adding capacity to keep the completion rate up there.)
Why should we focus on WIP first? It only costs intellectual capital to reduce WIP. It takes the investment of financial capital or payroll to increase the average completion rate, both of which hurt ROIC and hence shareholder value. Lean tools can reduce the work-in-process and eliminate waste, hence boosting ROIC. Little’s Law provides the mathematical foundation that allows us to apply Lean to all processes.
Lean Lesson #3 How the heck can I reduce WIP? (Creating a Pull system)
Look around your workspace. Is your In-Box stuffed to overflowing? Do you have a long list of new emails that will take you days to get through? Is your voicemail box rejecting new messages? Are people waiting for your work output?
All of those items represent WIP, work that someone else—a coworker, a customer—is requesting of you. As a newly converted Lean thinker, you know that you need to reduce that WIP if you want to stand a chance of improving cycle time and reducing waste. You know that WIP is like cars on a freeway: adding more cars doesn’t speed up a congested freeway! But how to do it?
Naturally, putting a limit on WIP isn’t possible in customer-facing processes when that WIP is really people waiting to be served or trying to purchase a product (in those situations, there are other ways to maintain or improve lead time, see p. 34).
For any work that isn’t an actual customer standing in front of you, the secret to reducing WIP is found in Little’s Law. In a Lean service process, there is a step that precedes the actual process, a step where input (work requests, orders, calls, etc.) are collected together. Someone then controls the release of these “materials” into the process.
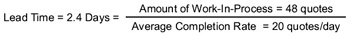
Let’s look at one example. The independent distributors for one company needed to get proposal information from the marketing department in order to quote construction jobs. The distributors were unhappy with the 2 to 3 weeks it took marketing to develop the needed information. The required turnaround to delight these customers was 3 days.
A team collected data over a few weeks that showed the marketing staff could process an average of 20 quotes per day. The distributors wanted a reliable 3-day turnaround; the data showed that because of variation in the process, the marketing staff would have to aim for a target closer to 2.4 days in order to meet that customer request.
How much WIP could they allow in the process? They turned to Little’s Law and plugged 20 into the completion rate and 2.4 days into lead time, to come up with a maximum WIP of 48 quotes in process at any time:
To manage this system, they created a visual board that showed how many quotes were in process. The cap on WIP was 48 requests, so unless the number dipped to 47, no additional quotes could be delivered by the clerk, as shown in Figure 2.4 (next page).
Figure 2.4: Pull System for Sales Quotes
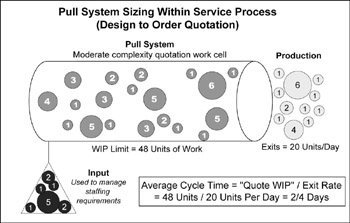
The secret to making this system work is captured in the lower left-hand corner of Figure 2.4, in the bin labeled “input.” (The bin can be a physical compartment or an electronic database, depending on the nature of your work.) These requests are not officially in the process until they are released from the raw material bin. The only trigger for releasing the work into the process is having an item exit the process—and that’s what a Pull system is. The guaranteed service level of about two-and-a-half days’ turnaround doesn’t start until the request enters the process.
In other words, a Pull system in service environments means making deliberate decisions about the timing of work released into process. Just how you make those decisions is critical; it gives you another opportunity to live out a focus on “value.” For example, in this case the question was which request will be released into the process when another request is completed. “First in, first out” didn’t cut it here because some requests represented highly likely, high-dollar-potential orders; others were much less likely to be accepted, represented difficult bids, or were for smaller orders.
The answer lie in triaging the bid opportunities. Each request was rated on a scale of 1 to 3 on each of three criteria:
- Difficulty to bid
- Competitive advantage
- Gross profit dollars
The scores for each criteria were multiplied for each bid opportunity. Those with the highest rating would be the next to be released into the process—even if there were other bid opportunities that had been waiting in line longer. (So a new request that scored a 9 would be released before an older request that scored a 6.) Using this system, the same number of marketing staff were able to book 70% more revenue and 80% more gross profit. (An alternative, of course, would have been for this company to hire a lot more marketing staff—at great expense—so they could increase capacity.)
Creating Your Own Pull System
How can you make this system work for you? Here’s a suggested sequence:
- Identify/confirm the service level you want to achieve. (Ask your customers what service level they want.)
- Determine your work group’s completion rate (based on data).
- Use Little’s Law to determine maximum WIP.
- Cap the active work in the process at the maximum WIP.
- Put all incoming work into an input buffer.
- Develop a triage system for determining which incoming work should be released into the process next.
- Continue with other process improvements so you can improve completion rate and further reduce lead time.
The contribution of Lean Six Sigma in situations like this is two-fold: For the first time, data (on demand variation, WIP, and completion rate) are captured in a service environment and used as the basis for decision making. Secondly, speed and quality tools can then be brought to bear by people who have the time and energy to drive home the results.
Careful! Don’t treat customers like inventory or raw materials!
The Pull system described above works when the input is paperwork, email, phone call messages, etc. But in customer-facing process, you have to keep the response time and the capacity of the service offering at acceptable levels, come what may. When the “things” in process are customers, you can’t put them in inventory, nor can you make them wait longer to receive service, hence the lead time cannot increase. Looking at Little’s Law, we can tell that the only option left is increasing the average completion rate.
Taking a Counterintuitive Leap
Pull systems sound counterintuitive to many people. Most of us think that the best way to get faster is to push work into the process as soon as possible. What Lean teaches us is the exact opposite: we can only speed up process time by controlling (and usually slowing) release of work into the process.
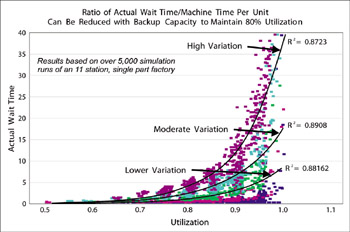
One challenge of customer-facing operations is they show high variation in demand, with customer numbers bunching up at some hours and slacking off at others. If the pattern is predictable, you can increase completion rate by changing staffing patterns, having additional staff at peak times much like call centers do. If variation in demand is unpredictable, the solution is to apply Queuing Theory, equations that allow you to calculate how different factors—such as variation in supply or demand—affect WIP (and hence lead time). For example, Figure 3-11 from Lean Six Sigma (reproduced below as Figure 2.5) shows that that if you have 20% back up capacity, variation in demand has virtually no impact on the time a customer waits (queue time).
Figure 2.5: Impact of Variation Is Worst When Capacity is High
You can get backup capacity using personnel from other departments who are cross trained; or using triaging (just like the Pull system described above), where, for example, harder or more difficult services are funneled to more-experienced staff.
Lean Lesson #4 Process Cycle Efficiency allows you to quantify the opportunity
Typical process cycle efficiencies in services run at about 5% (see Table 2.1), meaning that work spends 95% of its “in process” time just waiting. Sound bad? It is. And it’s not just the delays that are a problem. The old adage is true: the longer the work stays in process, the more it costs. A Lean process is one in which the value-add time is more than 20% of the total cycle time of that process.
|
Cycle Efficiency |
Cycle Efficiency |
|
|---|---|---|
|
Continuous Manufacturing |
5% |
30% |
|
Business Processes (Service) |
10% |
50% |
|
Business Processes (Creative/Cognitive) |
5% |
25% |
Don’t be surprised if the processes in your organization initially have cycle efficiencies of less than 5%. On the bright side, experience has shown that you’ll find a lot of low-hanging fruit and will be able to eliminate at least 20% of your cost by application of basic Lean Six Sigma tools. (Several of the case studies in Part III of this book led to even greater gains—near 50%.)
Process Cycle Efficiency can be dramatically displayed by differentiating value-add times from non-value-add times on a Time Value Map, as shown in Figure 2.6. (Visual depictions like this cause people to really sit up and take notice!)
Figure 2.6: Time Value Map
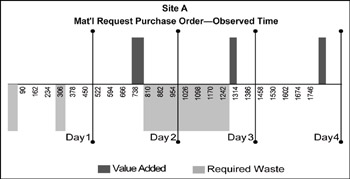
A time value map is generated by tracking a work item through the process and tracking where it spends its time. Only work that is seen as value-added by the customer is plotted above the midline; everything else is waste in their eyes.
The concept of a Time Value Map is simple enough. Just track any work item as it flows through the process and classify the time into one of three categories: (1) Value-added work, (2) waste that is required for business reasons (work the customer doesn’t necessarily want to pay for, but is needed for accounting, legal, or regulatory reasons), and (3) delays/waste. Then draw a timeline and mark off the time segments for each of these categories. In this Lockheed Martin purchasing example, you can see there is a four-day cycle from the time the material request reached the procurement center to the time the purchase order is placed. The value-added work (shaded portions above the centerline) shows the buyer is only working the order for 14 minutes of those 4 days. The majority of the time, delineated by the blank space, is idle queuing time. This process initially had a Process Cycle Efficiency of less than 1% (14 min out of 4 days, or 1920 minutes).
Lean Lesson #5 20% of the activities cause 80% of the delay
The only way to achieve the primary Lean goal—speed—is to remove anything that is slowing a process down. Mapping a process and collecting data on cycle time, variation, and complexity allows you to calculate the delay time that each activity contributes to the process. Experience shows that in any process with a cycle efficiency of 10% or less, 80% of the process lead time is chewed up by less than 20% of the activities—another example of the Pareto effect in action! These 20% are called Time Traps, which become very obvious when creating value stream maps (see Chp 4) and can be visually depicted in a Time Value Map as in Figure 2.6.
As you’ll see in Chapter 4, finding the Time Traps is the critical piece in attacking problems in priority order based on delay time. This is tremendously liberating: you get terrific leverage on your improvement dollars
if you select the right targets in the right priority.
Lean Lesson #6 Invisible work can t be improved
If there really is such large cost and lead time opportunities in services, why hasn’t Lean Six Sigma been applied more often?
One clear advantage that people in manufacturing have is the ability to physically see and trace the flow of work. You can walk down a production line and follow the work-in-process (WIP) as raw materials or products are turned into finished product as they move from workstation to workstation. This flow is always documented in a “router” which shows the path of value-add work. Similarly, there are constant physical reminders of any waste (rework, scrap, delays) in the form of piles of in-progress or soon-to-be-discarded material.
In services, work is largely invisible. Someone hits a computer key and a report zips through circuits to another office down the hall or across the world. Someone else hits a button on a phone and a customer is transferred from one workstation (perhaps customer service) down to another (technical support).
It’s not just the work flow (process) that is harder to see in services; it’s just as hard to judge the amount of work-in-process. Yes, some of us can judge WIP by looking at the stack of paper on our desks or counting the number of people standing in line waiting for service. But it’s much more common to have the “work” be something less visible: an electronic file of reports or orders waiting to be processed, 20 emails awaiting responses, 10 customers “on hold.”
Even though it can be difficult to visualize flow in service environments, understanding the flow of work and being able to evaluate WIP are prerequisites for applying Lean concepts to improve speed and reduce waste. Different types of process maps are typically employed to “make the invisible visible,” including a variety called value stream maps that you’ll encounter frequently in this book (see the example in Figure 2.7).
Figure 2.7: Value Stream Map (A process flow map)
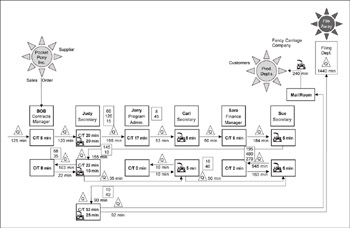
This value stream map, based on an actual process, captures the main sequence of activities in the boxes across the top line. The triangles and other notations show wait times (delays) and rework loops (another form of waste). Notice that the order begins by waiting 125 minutes “in queue” at Bob’s activity before he spends 8 minutes adding value, then waits 120 minutes at Judy’s station before she adds 20 minutes of value, etc. The order makes several loops back and forth between Judy, Bob, and Sue. Creating a map like this highlights wasted time and effort that usually isn’t apparent to people mired in the process. Why the long queue times? Because there is a lot of work-in-process that has to be handled before any new item of work can be handled.
Figure 2.7 also demonstrates how unnecessarily complex many administrative processes are. One company had an Engineering Change Notice (ECN) approval process that required signatures from seven managers, and it usually took weeks for the approval form to make it through all seven in-baskets. This service process inflicted major problems on the manufacturing process because it prevented the correction of defective engineering drawings (and the products based on those drawings). The long cycle time on this decision process meant that rework had to continue long after a quality problem had been detected, even after new artwork had been prepared that would have allowed them to produce defect-free products.
When they looked more closely at the purposes of having all seven signatures, this company realized that five of the managers had no particular expertise they could contribute to the process. These five could therefore be changed to an “FYI notification status” without harming the process (they were still copied on the form because knowing that changes were happening was helpful to them, but they were not truly part of the decision-making process). Now it takes less than a week for the two remaining managers to review the form, resolve any issues, and set the rest of the process in motion.
Visual Management
The benefits of having WIP, waste, and employee ownership visible are why Lean encompasses so many visual management tools used to:
- Establish and display work priorities
- Visually display daily process performance (“was today a good day or a bad day?”)
- Support communication within a work area or between management and staff
- Provide feedback to team members, supervisors, and managers and make it possible for all employees to contribute to continuous improvement
At its simplest level, visual management can include things like posting process maps that document how the process should operate, or posting data charts on a bulletin board so that everyone and anyone in the work area can see how well or poorly the process is performing. Figure 2.8 shows a special type of visual management tool called a takt board (“takt” is German for “metronome”) for the marketing Pull process described above. Takt boards are used to help maintain a certain rhythm or pace in a process. The board captures figures on the desired “rhythm of production” (which is based on customer demand and caps on WIP) and the actual rate achieved by the process operators. Based on the original work done by this group to establish a WIP limit, this board is used to maintain a level of 48 requests-in-process. (Other visual management tools will be covered later in this book.)
Figure 2.8: Order Entry Takt Board
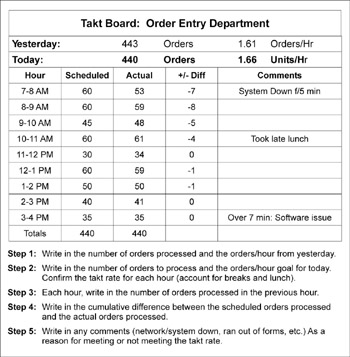
A takt board is a simple visual tool that helps people maintain a certain pace or rhythm in the process required to meet customer demand and not exceed a maximum level of work-in-process (which allows them to maintain the lead time). Produce too fast, and you end up with excess WIP and a slowed process. Produce too slow, and you end up with unhappy customers. The takt board shows the desired schedule for work, differences in actual work produced, and reasons for those differences (which helps process operators discover patterns in delays).
A Recap of Lean Thinking
A Lean process…
- Operates at a process cycle efficiency >20%
- Has a maximum cap on WIP to control velocity
- Uses a Pull system where new work is released into the process only when work has exited to the next process
- Uses visual controls to manage and monitor the process (e.g., by showing the status of various items or service in-process, and a list of additional lead-time reduction ideas)
Service Example of Hard Lean Tools
A few years ago, Lockheed Martin’s Systems Integration Business Area (SIBA) centralized the majority of its procurement operations in its Material Acquisition Center– Mid-Atlantic Region (MAC-MAR), which serves 14 or more different locations (MAC-MAR’s “customers”). Many of these sites were acquired during the 1990 defense industry consolidations and operate with different legacy computer systems.
Each buyer was responsible for the procurement of a certain number of commodities. They would log onto one site’s computers, process its purchase requests, then move onto the next site. This logging on and off was a problem. Because of legacy computer issues, it often took a buyer an average of 20 minutes to log off one site and log on to another site. The Lean description of this situation is long setup time, although no one in purchasing at that time—prior to the LM21 initiative—had been trained in Lean and hence did not call it or even recognize it as setup time or understand its impact.
And it wasn’t just the physical setup time, switching from one computer system to another, that was killing the MAC-MAR buyers. The mental setup (“learning curve”) was tough as well; the legacy of many systems meant buyers had to constantly switch from one set of rules to another, try to remember 14 different part numbers, and so on.
What would you do in such a situation? Just what these buyers did: process all the purchase requirements for one site before moving on to the next. On average they would stay locked on one customer’s site for about a day before switching. While buyer productivity in terms of orders placed per hour might be high, much of their time was spent placing the wrong orders if looked at in terms of priority. Any time a lot of WIP is in a system, you can be sure that the lead times will be very long in accordance with Little’s Law.
Figure 2.9 represents how buyers processed orders prior to the improvements. Because they could only log onto one site at a time, they would tend to complete all the purchases at that time, regardless of whether an individual request was hot or cold.
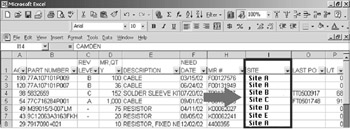
Figure 2.9: Partial screen capture from initial buyer program
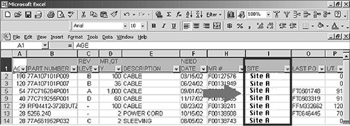
Because of Lockheed Martin’s many legacy computer systems, buyers at the centralized procurement center could only log onto one site at a time. It could take as much as 20 minutes for them to move to another site… so naturally they would tend to handle all the orders at one site before switching.
The problem, of course, was that this approach totally ignored the due dates of the other customers’ purchase requirements—a hot order from Site D would have to wait until the buyer had completed all the orders for Sites A to C. As a result, it could take as many as 14 days or more (=customer turnover time) for a buyer to cycle through all the customer requirements, leading to long lead times, delay in major project billings, and downstream factory overtime. (See Figure 2.10, next page.) Moreover the same commodity, say an Intel Pentium chip, might be purchased 14 separate times under 14 different internal names (in 1/14 the volume possible), increasing unit costs and perhaps creating 14 times as much administrative and expedite time.
Figure 2.10: The Inflexibility of the Procurement Process
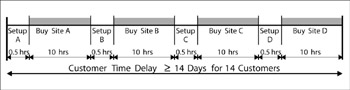
Because it was so difficult and time consuming for Lockheed Martin buyers to switch from one site to another, their standard procedure was to complete all the orders for one site, both those that were “hot” and those that were not, before moving on to the next, as depicted in the figure. The math adds up quickly—with 14 different sites to process, it could often take 14 days or more before a buyer could return to process further orders from any site.
A value creation map revealed that this particular “setup” problem created the most delays in the entire procurement process and was clearly the leading Time Trap. Unless it was solved, other improvements would only be illusory. The Voice of the Customer reinforced this analysis; the top priorities of the customer sites were quicker response to purchase order requests and lower procurement costs.
A MAC-MAR team mapped out the process, measured WIP at each step, looked at where delays were worst, identified complexity, and realized the solution to this problem was twofold:
- Develop an application that could communicate with all legacy systems and consolidate orders for a group of commodities onto a single screen (this would eliminate the constant setup time delays when buyers switched between systems)
- Structure the program so that buyers could sort orders by need-date and commodity
The result is shown in Figure 2.11. The new screen shows a mix of sites with the “hot” items only displayed across all sites rather than just one site. By simply clicking on an item, the purchase requisition and history come up. Further improvements are being made by getting more products under purchase agreements, allowing the buyers to do one-click purchasing (eliminating additional setup time for all future orders), and a host of other improvements.
Figure 2.11: Buyer’s “after” screen shot…
At first glance, this screen shot may not look that much different from the original screen (see Fig 2.9). But developing the ability to sort orders across all sites in order of priority meant they had to be able to compile information from many different legacy programs.
Overcoming the software legacy issues increased the flexibility of the activity (buying):
- Setup time dropped from 20 minutes to near zero.
- Batch sizes are now 1 because the buyer isn’t hindered from jumping from site to site to place orders.
- The cycle time interval has dropped from 14 days to less than 1 day (e.g., if a buyer starts with Site A, he or she can complete all other required orders and get back to Site A within a day).
- Work-in-process: customers used to be “in process” for as much as 14 days, or an average of 7 days or 56 hours. Now they are “in process” for no more than 2 hours, or an average of 1 hour.
- The completion rate increased from one customer per 8-hour day to 14 customers every 2 hours (an equivalent of 56 per day).
Do You Work at Your Convenience or Your Customer’s?
If you examine your own process with “Lean eyes” you will be surprised by all the work you do “in batches” because it’s convenient to you, even if not to your customer.
The MAC-MAR team also made other process changes (such as increasing the number of prenegotiated terms). The cumulative changes allowed procurement costs to fall by 50%, lead times to be reduced 67% on commodities (from 6 months to 2 months), factory productivity to improve nearly 20% due to decreased shortages, and average unit cost of material to drop 6.4%.
This example demonstrates another key Lean insight: The velocity of any process is proportional to its flexibility. The original Lockheed Martin process was very inflexible (a 21-day customer turnover rate); because the buyers can switch so much more easily, they can speed up the process.
Setup Time and Batch Processing in Service Functions
Many people don’t think that service applications have setup time. But if it takes you a finite period of time to transition from serving one customer to serving another, or if it takes some time to attain normal productivity, you have setup time. Similarly, any time you delay service to one customer (internal or external) because it’s more convenient to continue working on your current task, you are batch processing. See Chapter 11 for instructions on how to eliminate these sources of process delays.
Why Does Lean Need Six Sigma?
As robust as Lean is for dealing with lead time and non-value-add costs, there are several critical problems you won’t find addressed in the seminal books on Lean. Six Sigma provides robust solutions to these problems, which explains why Lean needs Six Sigma:
Lean does not explicitly prescribe the culture and infrastructure needed to achieve and sustain results
Most Lean resources are mute on the infrastructure needed to successfully implement Lean initiatives and achieve and sustain Lean speed. It is true that many companies that have implemented Lean have been driven to develop an infrastructure similar to that of Six Sigma, but they did it ad hoc, rather than use the prescriptive structure contained in Six Sigma. Companies that only apply Lean are sometimes unable to deploy it across the whole organization and sustain results because they lack the well-defined Six Sigma cultural infrastructure to generate senior management engagement, formalize training, secure dedicated resources, and so on. Thus the progress of Lean has been dependent on individual initiative. I have seen many successful Lean implementations regress when a new manager takes over. Six Sigma is less susceptible (though not immune to) this problem: it asserts that there is only one set of shareholders whose interests alone must be served. Every book on Six Sigma discusses, in detail, how to sustain infrastructure; virtually no book on Lean even addresses the issue.
“My experience is that most people in financial industries can understand and grab Six Sigma and might say that Lean is OK for a manufacturing environment. But once they have experience with Lean, they like it better because it’s faster and it’s simpler. They struggle more with Six Sigma tools.”
—Darryl Greene, Senior VP, Bank One
Customer Critical to Quality needs are not front and center
In requiring us to identify what is “value-added” in a process, Lean does incorporate some element of customer focus, but it is introspective in its approach. The person creating the value stream map makes the decision as to whether an activity is value-add or not. In contrast, Six Sigma prescribes numerous places in improvement methods where the voices of customers and suppliers must be included. It uses Customer Critical-to-Quality as a key metric and requires a means of capturing the VOC in the Define phase of DMAIC. Simply put, the customer is not front and center in Lean, yet is ever-present in Six Sigma work. (See Chapter 3.)
Lean does not recognize the impact of variation
Lean does not possess the tools to reduce variation and bring a process under statistical control. Six Sigma views elimination of variation as key and provides a whole arsenal for attacking variation (from statistical process control to design of experiments). As mentioned above, a 10% defect rate can increase lead times by 38% and WIP by 53%. In other words, the speed and cost gains of Lean can be erased instantly by an increase in variation!
“Who needs Lean? I don’t have any setup time!”
Most people in service applications think that their activity has no setup time. They associate setup time with the dead zone during changeover from one product to another in manufacturing. In most service environments, there is no true dead zone. However, when switching from one task to another, there will generally be a learning curve before full output rate is achieved as we saw in the case of Lockheed Martin’s MAC-MAR procurement center. This learning curve is shown in Figure 2.12.
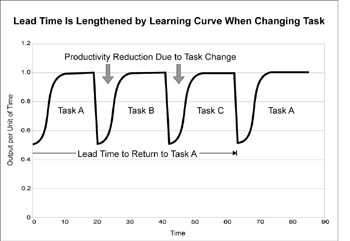
Figure 2.12: Learning Curve Costs to Productivity
The employee is staying “locked on” a given task for 20 minutes even though current customer demand for that task only requires 5 minutes. This is similar to the one-day “lock on” period at Lockheed Martin, but the number of different “tasks” was 14, corresponding to the 14 different sites, tasks A thru N. This increases the overall lead time by a factor of four. Lean methods can be used to dramatically reduce learning curve times (see Chapter 11).
Conclusion: Anything that reduces productivity rates will result in long lead times, as people tend to remain “locked on” one type of task longer than is required to meet immediate customer demand. Lead times can be dramatically reduced by using Lean tools to allow task transitions with minimal impact on productivity. One of the primary sources of the learning curve is the complexity of the tasks performed. The larger the number of different tasks, the less often they will be repeated, and the steeper the learning curve. Thus complexity reduction prevents, while Lean Six Sigma cures, the learning curve problem.
An increase in defects is not the only source of variation that increases WIP and lead times. Variation in the demand for an offering and variation in the time it takes to perform an activity that creates that offering both have a major impact on process lead time, which Lean does not directly address. This relationship is illustrated in Figure 2.13, which graphs the outputs from one of the steps in the Lockheed Martin procurement process described earlier.
Figure 2.13: The Effect of Variation on Queue Time
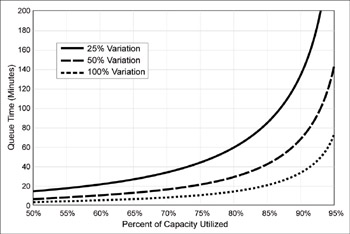
Variability in demand has a bigger effect on how long your work has to wait “in queue” the closer your process operates to capacity (as shown by the steep rise in the curve on the right). The greater the variability, the greater the effect.
Let’s say that it takes Bob an average of 16 minutes to perform a particular task. However, because of the variety of tasks, 68% (one standard deviation) of process times might wander in a band about 8 minutes on either side, in which case the variation is 8/16 = 50%. Let’s also assume that the workload presented to Bob has similar variation. As you can see in the figure, if Bob is loaded up to 90% of capacity, the work backed up in queue behind Bob will wait an average of 60 minutes, which explains about half of his queue time. Encountering a particularly nasty problem could easily shoot that queue time up over 100 minutes.
Lean also needs DMAIC
Most descriptions of Lean methodologies dive into the Improve phase (in DMAIC terminology), going right to solutions and jumping over Define and Measure. Without a prescribed Define step to understand how big the problem is, and a Measure phase to quantify the size versus the resources, people have often bitten off more Lean than they could chew, or lost themselves in a frenzy of Lean improvement events.
Variation has little effect on processes operating at low capacity (the left side of the diagram). But most service organizations function at or near full-capacity—and that’s when variation has a major impact on how long the work (or a customer) has to wait “in queue.” Customer-facing service processes often experience a lot of variation in demand because we have no control over when customers will contact us. The lesson? The larger the variation in input, the more excess capacity is needed. If there is either low variation or we can control demand in some way (which is more likely with internal processes), we can operate at a higher capacity without risking excessive delays. When I first showed this analysis at Lockheed Martin, Manny Zulueta (the VP of Lockheed Martin’s MAC-MAR procurement center) said: “This validates what we’ve been seeing!”
Why Does Six Sigma Need Lean?
Just as there are gaps in Lean methodologies that can benefit from Six Sigma, let’s turn the tables and see where Six Sigma falls short compared to what Lean has to offer.
The overarching message is this: As many companies have demonstrated, you can make a lot of gains with Six Sigma. But there’s a hitch. No matter what tool you pick, if you don’t have a Lean component to it, if you’re not focusing on improving speed and reducing WIP, any gains will eventually die. The process will still be slow and cumbersome, and its costs will be too high. More specifically, here are five reasons why Six Sigma benefits from Lean:
- Identifying waste. Though process mapping is a Six Sigma tool, it does not prescribe the collection of data (such as setup time, processing time per unit, transportation, etc.) necessary to quantify which steps of which process contribute the most non-value-add work/costs to the service or product. Lean provides the powerful value stream map tool, which crosses functional silos and highlights waste and delays. Six Sigma rarely gets into a discussion of classifying activities as value-added or non-value-added, nor is elimination of non-value-add activities a central tenet of Six Sigma. Rather, Six Sigma protocol prescribes eliminating variation first, and, only if that’s not possible, then redesigning the process using Design for Six Sigma (DFSS). Lean claims that process redesign is always required to some extent (to eliminate non-value-add activities) when cycle efficiency is less than 10%.
The waste of a lost customer
By far the biggest waste, and one that Lean admittedly fails to take into consideration, is the waste of losing a customer. You lose the associated revenue, and the cost of gaining a new customer is generally much higher than selling an equivalent amount of services or products to an existing customer. Virtually all the wastes that Lean explicitly defines are internal to the process, not external. It can be argued that eliminating these internal wastes will significantly decrease the odds of losing an external customer because you’ll be delivering services at high speed with no waste and minimal costs. However, you can waste a lot of time and effort getting really good at delivering a service that customers don’t want, and that’s why Six Sigma takes a more explicit approach to capturing the Voice of the Customer and defines the loss of a customer as a defect.
- Improving process speed or cycle time. Improvement in cycle time and responsiveness is often claimed as a result of Six Sigma. Six Sigma experts (and their books), however, do not make either a practical or theoretical link between quality and speed, nor do they address instituting Pull system caps on the amount of WIP (an action that is required to make lead time a controllable parameter with limited variation). The first-order driver of cycle time is work-in-process (via Little’s Law). Unless WIP is capped at some maximum value first, reduction of cycle time is just wishful thinking.
- Specific speed tools. Seldom will you find any Lean tool—Total Productive Maintenance, time value analysis, 5S, etc.—included in a Six Sigma toolkit. These speed-acceleration tools are incredibly powerful, having been developed and refined over decades of experience. It’s true that some translation is needed to adapt these tools to service environments (see the case study chapters later in this book), but to ignore them is to risk limiting the performance of your processes.
- Methods for rapid action (the Kaizen DMAIC process). Lean methodologies include a rapid improvement method called Kaizens, which are short, intensive projects where a group of people with relevant knowledge are sequestered for four or five days and apply structured improvement methods on a targeted process or activity. The energy generated by such events is legendary, engendering a high degree of creativity by the pressure to rapidly produce tangible results. As you’ll see later in the book, Kaizens have a real role to play in service environments, though some modification is often needed (see Chp 10). Still, having a time-compressed, action-oriented improvement method in your arsenal provides a good accelerator of DMAIC projects. Lean’s bias for action accelerates results.
- Six Sigma quality is approached much faster if Lean eliminates non-value-add steps. The Six Sigma Research Institute once pulled together a chart (see Figure 2.14) that examined rolled-throughput yield, which looks at the cumulative effect of defects on yield. For example, consider an invoicing process that has 20 activities, each operating at 4s (99.379% yield). The overall rolled-throughput yield would be (.99379)20 = 88%, which is not atypical for service processes. This low yield creates accounts receivable problems and sparks the need for manual collection procedures and rework.
With Lean tools, it is quite realistic to quickly (within a few weeks at most) remove the non-value-add activities—likely at least half (= 10) of the steps. So instead of having a 20-step process, the invoices now only have to travel through 10 steps. Even without making any other quality improvements, it seems obvious that a 10-step process has far fewer opportunities for error than a 20-step process.
The rolled-throughput yield will then rise to (.99379)10 = 94%. The higher yield will provide a significant return on your improvement investment, and, even more significantly, the velocity of the process will double—which not only allows you to provide your output to customers more quickly, but doubles the feedback rate on using the quality tools, making them twice as effective.
Figure 2.14: Rolled-throughput yields
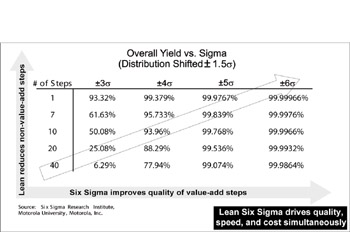
The message of this chart is that it’s much harder to achieve high levels of quality with processes that have a lot of steps, and vice versa, low quality has a much greater cumulative impact on complex process. The most efficient way to achieve 6 Sigma levels of performance is therefore to simultaneously improve quality and apply Lean principles to eliminate non-value-added process steps.
By combining Lean and Six Sigma, it’s quite possible you could not just eliminate steps but improve quality levels in each remaining activity to, say, 5s, which would raise the rolled-throughput yield to (.99976)10=to 99.8%.
Internal benefits of faster speed
“An ITT service unit that basically sold high-tech labor had a goal of increasing revenue. One of their early projects was how to hire more effectively and more rapidly. They found it was taking them 105 days on average to hire new employees. The goal was 20 days. They went through the [Value-Based Six Sigma] process because their sales dollars were directly impacted by how many people they had working these contracts. Not only were they able to reduce the cycle time, but they found out they got better quality people by being faster—it didn’t take the better people 105 days to find a job.”
—Lou Giuliano, CEO, ITT
A challenge for Six Sigma advocates
The question sometimes arises whether it’s better to first optimize a process (without removing non-value-added process steps) using Six Sigma or to eliminate non-value-added steps first through Lean and then optimize the process through Six Sigma. Some Six Sigma advocates suggest that Lean methods (like Pull systems) should be applied only after a process has been brought under control and optimized. This viewpoint is easily challenged: “How could it hurt anything to use Lean and implement a Pull system so you can control the velocity and reduce cycle times during Six Sigma implementation?” The answer is you do both simultaneously with the Lean Six Sigma tool kit and a business culture to be the best. Projects should be selected based on their impact on increasing ROIC, not on whether solving the problem is more likely to require Lean vs. Six Sigma tools.
Blending Lean and Six Sigma to Optimize Service
The fact is that Lean Six Sigma is a powerful tool for executing the CEO’s strategy, and a tactical tool for P&L managers to achieve their annual and quarterly goals. If executives aren’t engaged in Lean Six Sigma, the company will likely be out-competed by companies whose executives embrace Lean Six Sigma.
Blending the key themes of Lean and Six Sigma provides us with five “laws” that provide direction to our improvement efforts. Here are the first four (which we number from “0” because the first list is fundamental to all the others):
0: The Law of the Market: Customer Critical-to-Quality defines quality and is the highest priority for improvement, followed by ROIC and Net Present Value. We call it the Zero Law because it is the foundation upon which all else is built.
1: The Law of Flexibility: The velocity of any process is proportional to the flexibility of the process (see Fig 2.10).
2: The Law of Focus: 20% of the activities in a process cause 80% of the delay.
3: The Law of Velocity: The velocity of any process is inversely proportional to the amount of work-in-process (or number of things-in-process). Little’s Law states that:
The number of things in process in turn is increased by long setup times, rework, the impact of variation in supply and demand, time, and the complexity of the product offering.
There’s one final Lean Six Sigma law we’ll examine in Chapter 4:
4: The Law of Complexity and Cost: The complexity of the service or product offering generally adds more non-value-add costs and WIP than either poor quality (low Sigma) or slow speed (un-Lean) process problems.
"I faced a typical challenging task--to consolidate the purchasing from 22 locations in 9 months with little budget and a mandate to not affect the cost and to be seamless to the customer. The only way I knew it could be accomplished was to apply my Lean Six Sigma thinking and challenge my team to remove waste, mistake proof the process, and get every employee involved."
—George Sanders,Director of Sourcing (Northern Material Acquisition Center), Lockheed Martin
Part I - Using Lean Six Sigma for Strategic Advantage in Service
- The ROI of Lean Six Sigma for Services
- Getting Faster to Get Better Why You Need Both Lean and Six Sigma
- Success Story #1 Lockheed Martin Creating a New Legacy
- Seeing Services Through Your Customers Eyes-Becoming a customer-centered organization
- Success Story #2 Bank One Bigger… Now Better
- Executing Corporate Strategy with Lean Six Sigma
- Success Story #3 Fort Wayne, Indiana From 0 to 60 in nothing flat
- The Value in Conquering Complexity
- Success Story #4 Stanford Hospital and Clinics At the forefront of the quality revolution
Part II - Deploying Lean Six Sigma in Service Organizations
- Phase 1 Readiness Assessment
- Phase 2 Engagement (Creating Pull)
- Phase 3 Mobilization
- Phase 4 Performance and Control
Part III - Improving Services
EAN: 2147483647
Pages: 150
