Introducing the Crystal Reports Designer
This chapter takes you through the required steps to create your own basic reports in the Crystal Report Designer. After you've installed the Crystal Reports V.10 Designer, you are ready to open it and familiarize yourself with the environment. This section briefly introduces the following components of the application interface:
- Report sections
- Application toolbars
- Application menus
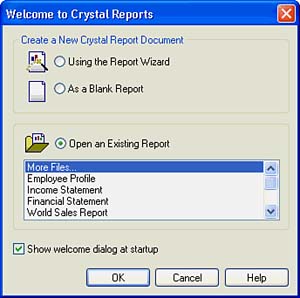
If you have already registered your installation, you should be presented with the Welcome to Crystal Reports screen shown in Figure 1.1. This screen provides quick access to existing Crystal Reports files while also enabling you to begin designing new reports via the Report Expert Wizard or from a blank report template.
Figure 1.1. The Welcome screen provides quick access to existing Crystal Reports files as well as the Report Expert Wizard.
Crystal Report Sections
From the Welcome dialog window, select Using the Report Wizard (listed below Create a New Crystal Report Document) and then click OK. You should see the Crystal Report Gallery dialog. Select As a Blank Report and click OK. At this point, you'll see a window labeled Data Explorer; click Cancel. If the Field Explorer window is also displayed, click Close.
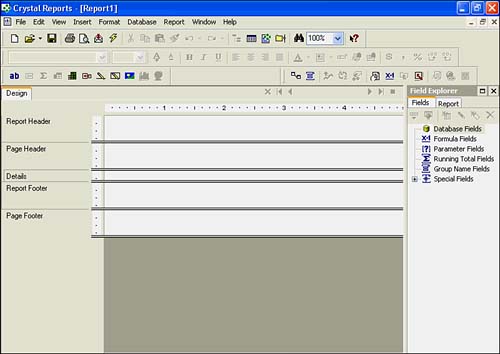
You are presented with a blank report template that is divided into numerous report sections. As Figure 1.2 illustrates, report sections are identified by name on the left side of the design area. These sections segment the Crystal Reports design environment into logical areas to facilitate more intuitive report creationthese include the Report Header, Page Header, Details, Report Footer, and Page Footer sections. Each of these sections has unique properties and printing characteristics that you can modify. When creating reports, you place objects (such as data fields) into the various sections according to report requirements. If a report object such as an image is placed in the Report Header section, the image displays and prints only once per report, on the first page. If the same image is placed in the Page Header section, the image then displays and prints once per page. The same holds true for custom sections, such as Group Headers and Group Footers. The Details section implies that whatever is placed in this section displays and prints once for each and every row retrieved from the data source.
Figure 1.2. Report sections provide an intuitive way to create and organize your data when designing reports.
NOTE
Although Crystal Reports is commonly used for Web reporting initiatives, the design environment is built on a paper metaphor with pages as a concept to facilitate the presentation of information.
Report sections can contain a variety of different object types, including database fields, text, pictures, charts, and map objects. Additional objects, such as formula and subreport objects, are also positioned within report sections and are covered later in the book in greater detail.
The Section Expert is used to view or modify the properties of the report sections. To access the Section Expert, perform one of the following actions:
- Right-click on the section's label (or name, located on the left sidebar) you want to work with, and then select Section Expert from the pop-up menu.
- Click on the Section Expert button.
- Select the Section Expert option from the Format menu.
NOTE
When designing reports, you should consider the following items when working with report sections:
- It is good practice to print a validating test page of each report you are designing.
- Consider keeping all font sizes the same within each section for maximum eye appeal.
- Print preprinted forms on the same machine to avoid discrepancies in the interpretation of the report layout by different print drivers and printers.
Crystal Reports also provides some more advanced section formatting options, reviewed later in the book, such as underlaying and suppressing sections based on certain criteria (formulas). These features are accessible from the Section Expert dialog.
Using Toolbars and Menus
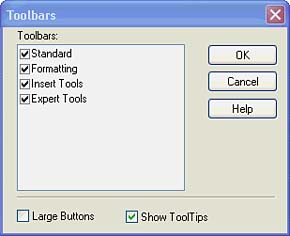
Toolbars are the graphical icon bars at the top of the Crystal Reports application environment, containing various buttons that you can click to activate the most frequently used application commands. Toolbars act as shortcuts to access commonly used functions of the design application, and you can enable or disable them to appear or disappear at the top of the application area by selecting Toolbars from the View menu, which is located in the upper-most area of the application. As Figure 1.3 shows, there are four main toolbars that you can use within the Crystal Reports design environment:
- Standard The most commonly used application functions, including New, Open, Save, Print, Preview, Export, Copy, Cut, Paste, and Help.
- Formatting Functions that pertain specifically to modifying object properties with regard to Font, Font Size, Bold, Italics, Underline, Alignment, Currency, and Percentage formats.
- Insert Tools Quick access to the building blocks of all reports including Text Objects, Summary Fields, Groups, Online Analytical Processing and Cross-Tab Grids, Charts, and Maps, and Drawing items such as lines and boxes.
- Expert Tools Functions that enable you to access the main application experts quickly, such as the Database, Group, Select, Section, Formula Workshop, and Highlighting Experts.
Figure 1.3. The Four Crystal Reports Design Toolbars provide quick and easy access to commonly used application commands during report design.
NOTE
ToolTips are pop-up descriptions that appear when your cursor rests over any of the toolbar buttons. ToolTips are enabled by default. To disable ToolTips on your toolbars, deselect the Show ToolTips check box from within the Toolbars dialog.
In much the same way that the toolbars offer quick and easy access to commonly used commands, the menu items at the top of the application environment provide listings to virtually all the application functions available in Crystal Reports. The menu items act as shortcuts to all the commands within the design application, and they include the following items:
- The File menu includes file-specific commands to create a new report file, open an existing report, close a current report, save a report, save a report with an alternative filename, export to a different file format, save the current data set with a report, and secure a report so that it cannot be opened by other users. In addition, the File menu contains commands that enable you to preview a report before printing, send a report to a printer, select a specific printer, modify the page setup and margins, and add summary information to a report.
- The Edit menu includes commands used to modify various aspects of a report, including commands to undo and redo actions, as well as to cut, copy, and paste report and OLE objects. Additionally, you can edit fields, formulas, summaries, and subreport links.
NOTE
Object Linking and Embedding (OLE) enables you to insert objects (OLE objects) into a report from other applications and then use those applications from within Crystal Reports to edit the objects if necessary. If Crystal Reports did not make use of OLE, you would have to exit Crystal Reports, open the original application, change the object, return to Crystal Reports, delete the object originally inserted, and then insert the newly revised object.
- The View menu includes commands used to customize the user interface of the Crystal Reports application. The View menu commands enable you to navigate between the application's Design and Preview views, access the three main explorers (Field, Report, and Repository Explorers), access the Toolbars dialog, zoom in and zoom out of a report, as well as to turn on and off the application rulers, guidelines, grids, and group tree from both the Design and Preview views of the report.
- The Insert menu includes commands used to insert text objects, summaries (counts, sums, medians, and so on), groups, subreports, lines, boxes, pictures, charts, maps, and other objects into your report. The Insert menu becomes very convenient when designing reports that include a variety of objects, such as a corporate logo and summary figures.
- The Format menu provides easy access to a variety of commands useful in formatting your reports for presentation purposes. This menu includes commands used to change the characteristics of the objects in a report. The Format menu provides quick access to commands for modifying font properties (color, size, borders, background color, and drop shadows for example), chart and hyperlink properties, and formatting for entire sections of the report. The Format menu also provides commands to arrange report objects (move, align, and size) and to specify desired highlighting characteristics via the Highlighting Expert.
- The Database menu includes commands used to access the Database Expert, from which you can add and remove data source tables for use within reports, specify links between data source tables, and modify table and field alias names. This menu also provides easy access to the set database location and enables you to log on and off SQL and ODBC servers, browse field data, and display and edit the report SQL syntax. In general, the Database menu enables you to maintain the necessary specifications for the report with regard to the data source(s) with which the report interacts.
- The Report menu includes commands used to access the main application experts (also referred to as wizards), identify the desired records or groups to be included in a report via the Select Expert and Selection Formulas (often referred to as applying report filters), construct and edit formulas, create and view alerts, specify report bursting indexes, modify grouping and sorting specifications, refresh report data by executing the query to run against the database, and view report performance information.
- The Chart menu is only visible after selecting a chart or map object and includes specific commands used to customize your charts and maps. Depending on the type of chart you select, the Chart menu includes commands to zoom in and out of charts; apply changes to all instances of a chart; discard custom changes made to the chart; save the chart template to a file; apply and modify template specifications for the chart; change the titles, numeric axis grids, and scales of the chart; and auto-arrange the appearance of the chart. After selecting a map object, the Chart menu then includes additional commands used to configure the overall style of the map, reorganizing the layers of report elements, changing the geographic map, and hiding or showing the Map Navigator.
- The Window menu includes commands used to rearrange the application icons and windows, as well as providing a list of report windows that are currently open and a command that enables you to close all report windows at once.
- The Help menu includes commands used to quickly access the Crystal Reports online help references, commands to register Crystal Reports and locate the Welcome screen, and quick access to the About Crystal Reports dialog and several key Business Objects Web sites for technical support and product information.
Report Design Explorers
Several report design explorers, intended to streamline the report design process, compose another key component to Crystal Reports 10. The design explorers are application tools that greatly enhance a report designer's efficiency while working with reports. They are design tools you will use in building reports throughout the remainder of the book.
The report design explorers are dialog windows that display various objects relevant to the report in a hierarchical tree view facilitating quick access to and formatting of each respective object and its properties. The explorers enable you to easily locate and navigate to specific report objects, such as the report header or a corporate logo image, to customize the object for design purposes. All the objects included in a report (report sections, groups, database fields, formulas, parameters, images, charts, and so on) are organized and displayed within one of the design explorers. There are three distinct explorers:
- Report Explorer Provides a tree view of each report section in the report and each of the report objects contained within each section. You can work with each report object directly from the explorer rather than navigating to each object separately in either the Design or Preview tab of the report.
- Field Explorer Displays a tree view of database fields, formulas, SQL expressions, parameters, running totals, groups, and special fields. You can add any of these field types directly to a report from the Explorer dialog. Fields that have already been added to the report or fields that have been used by other fields (such as formula fields, groups, summaries, and so on) have a green check mark icon in front of them.
- Repository Explorer Provides a tree view of each object contained in the Crystal Enterprise report repository. You can work with each report repository object directly from the Repository Explorer rather than locating each object separately for inclusion in the report during the report design process.
NOTE
It is important to emphasize that with Version 10, the centralized Crystal Repository is only available for use with Crystal Enterprise. See Chapter 18, "Crystal Reports Semantic LayerBusiness Views," for more details on this topic.
Locating and Using the Report Design Explorers
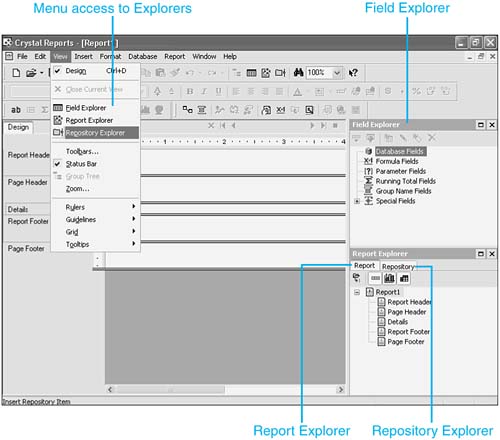
Each of the explorer dialogs can be docked in place or used in a free-floating state. By default, the Report and Field Explorers appear docked on the right side of the report design environment. However, you can manually dock each of them in other locations if you prefer. The explorers can also be used in free-floating mode, in which case each of the explorer dialog windows can be dragged to any location within the report design environment and float in place until you either close or reposition them. To view each of the report design explorers, click the View menu and select each desired explorer individually, as shown in Figure 1.4.
Figure 1.4. By default, the design explorers are docked on the right side of the report designer application but can be moved about and toggled on and off.
TIP
To save space in the design environment, the individual explorers can be dragged on top of each other and provide their functionality through respective tabs in a single dialog. This is the default position for the Field and Report Explorer in a fresh install but note in Figure 1.4 how the Report Explorer has been dragged into its own dialog with the Repository Explorer exposing itself through a tab in that same dialog.
The report design explorers create an intuitive way for report designers to add and format report objects quickly while constructing reports. As you progress through the remainder of the book, you will be using these explorers on a regular basis, so it's important that you understand the basics of these application features.
Part I. Crystal Reports Design
Creating and Designing Basic Reports
- Creating and Designing Basic Reports
- Introducing the Crystal Reports Designer
- Understanding Data and Data Sources
- Introduction to the Data Explorer
- Adding Database Objects to Your Report
- Joining Database Objects Together
- Understanding the Different Join Types
- Using the Report Creation Wizards
- Understanding the Crystal Reports Gallery
- Using the Standard Report Creation Wizard
- Creating a Report Without Wizards
- Troubleshooting
Selecting and Grouping Data
- Selecting and Grouping Data
- Introduction
- Understanding Field Objects
- Working with Groups
- Understanding Drill-down Reports
- Troubleshooting
Filtering, Sorting, and Summarizing Data
- Filtering, Sorting, and Summarizing Data
- Introduction
- Filtering the Data in Your Report
- Learning to Sort Records
- Working with the Sort Expert
- Creating Effective Summaries
- Troubleshooting
Understanding and Implementing Formulas
- Understanding and Implementing Formulas
- Introduction
- Using the Formula Workshop
- Using the Workshop Formula Editor
- Creating Formulas with the Formula Expert
- Using the Formula Extractor to Create Custom Functions
- The Multi-Pass Reporting Process of the Crystal Reports Engine
- Troubleshooting
Implementing Parameters for Dynamic Reporting
- Implementing Parameters for Dynamic Reporting
- Introduction
- Understanding the Value of Parameters
- Creating and Implementing Parameters Fields
- Using Parameters with Record Selections
Part II. Formatting Crystal Reports
Fundamentals of Report Formatting
- Fundamentals of Report Formatting
- Introduction
- Positioning and Sizing Report Objects
- Modifying Object Properties for Formatting Purposes
- Exploring the Format Editor Dialog Common Options
- Combining and Layering Report Objects
- Configuring Report Page and Margin Properties
Working with Report Sections
- Working with Report Sections
- Introduction
- Formatting Report Sections
- Modifying Report Section Properties
- Using Multiple Report Sections
- Troubleshooting
Visualizing Your Data with Charts and Maps
- Visualizing Your Data with Charts and Maps
- Introduction to Charts and Maps
- Using the Chart Expert
- Using the Map Expert
- Modifying Chart and Map Properties
- Troubleshooting
Custom Formatting Techniques
- Introduction
- Making Presentation-Quality Reports
- Common Formatting Features
- Conditional Formatting Using Data to Drive the Look of a Report
Part III. Advanced Crystal Reports Design
Using Cross-Tabs for Summarized Reporting
- Using Cross-Tabs for Summarized Reporting
- Introduction to Cross-Tabs
- Benefits of Cross-Tabs
- Using the Cross-Tab Wizard
- Using Top N with Cross-Tabs Reports
- Using Advanced Cross-Tab Features
Using Record Selections and Alerts for Interactive Reporting
- Using Record Selections and Alerts for Interactive Reporting
- Creating Advanced Record Selection Formulas
- Adding Alerting to Your Reports
- Performance Monitoring and Tuning
Using Subreports and Multi-Pass Reporting
- Using Subreports and Multi-Pass Reporting
- Understanding Subreports
- Understanding Linked Versus Unlinked Subreports
- Considering Subreport Execution Time and Performance
- Using Variables to Pass Data Between Reports
- Emulating Nested Subreports
- Troubleshooting
Using Formulas and Custom Functions
- Using Formulas and Custom Functions
- Becoming More Productive with Formulas
- Choosing a Formula Language: Crystal Versus Basic Syntax
- Using Brackets in Formulas
- Using Characters in Formulas
- Recent Improvements to Formulas
Designing Effective Report Templates
- Designing Effective Report Templates
- Understanding the Importance of Reuse in Reporting
- Understanding Report Templates
- Using Report Templates
- Using Existing Crystal Reports as Templates
- Understanding How Templates Work
- Creating Useful Report Templates
- Using Template Field Objects
- Using Report Templates to Reduce Report Creation Effort
- Applying Multiple Templates
Additional Data Sources for Crystal Reports
- Additional Data Sources for Crystal Reports
- Understanding the Additional Crystal Reports Data Sources
- Connecting to COM-based Data Sources
- Connecting to Java-based Data Sources
- Understanding Solution Kits for Crystal Enterprise
- Troubleshooting
Multidimensional Reporting Against OLAP Data with Crystal Reports
- Multidimensional Reporting Against OLAP Data with Crystal Reports
- Introduction to OLAP
- OLAP Concepts and OLAP Reporting
- Recently Added or Changed OLAP Features in Crystal Reports
- Using the OLAP Report Creation Wizard and OLAP Expert
- Advanced OLAP Reporting
- Introduction to Crystal Analysis
Part IV. Enterprise Report Design Analytic, Web-based, and Excel Report Design
Introduction to Crystal Repository
- Introduction to Crystal Repository
- What Is the Crystal Repository?
- Why Implement the Crystal Repository?
- Installing the Crystal Repository
- Adding Objects to and from the Repository
- Migration of the Crystal Enterprise Repository
- Troubleshooting
Crystal Reports Semantic Layer Business Views
- Crystal Reports Semantic Layer Business Views
- Introduction to Business Views
- Why Implement Business Views?
- Performance and Implementation Considerations
- Business Views Architecture and Implementation
- Troubleshooting
Creating Crystal Analysis Reports
- Creating Crystal Analysis Reports
- Introduction
- Introducing Crystal Analysis
- Accessing OLAP Data with Crystal Analysis
- Designing Crystal Analysis Reports and Applications
- Adding Crystal Analysis Objects to a Report
- Troubleshooting
Advanced Crystal Analysis Report Design
- Advanced Crystal Analysis Report Design
- Introduction
- Advanced Crystal Analysis Designer Tools
- Custom Calculations and Advanced Data Analysis
- Setting Report Options
- Troubleshooting
- Crystal Analysis in the Real World MDX
Ad-Hoc Application and Excel Plug-in for Ad-Hoc and Analytic Reporting
- Ad-Hoc Application and Excel Plug-in for Ad-Hoc and Analytic Reporting
- Introducing Ad-Hoc Reporting Conceptually
- Introducing the Crystal Enterprise Ad-Hoc Reporting Application
- Crystal Reports Excel Plug-in
- Crystal Analysis Excel Plug-in
Part V. Web Report Distribution Using Crystal Enterprise
Introduction to Crystal Enterprise
- Introduction to Crystal Enterprise
- What Is Crystal Enterprise?
- Why Implement a Crystal Enterprise Solution?
- Versions of Crystal Enterprise
- Understanding the Core Functions of Crystal Enterprise
Using Crystal Enterprise with Web Desktop
- Using Crystal Enterprise with Web Desktop
- Introduction
- Crystal Enterprise User Launchpad
- Crystal Enterprise Web Desktop
- Customizing the Web Desktop and Report Viewers
- Publishing to the Web Desktop
- Customizing the Web Desktop
- Troubleshooting
Crystal Enterprise Architecture
- Crystal Enterprise Architecture
- Introduction
- Crystal Enterprise Architecture Overview
- The Client Tier
- The Application Tier
- The Server Tier: Introduction to the Crystal Enterprise Framework
- The Server Tier: Overview of the Crystal Enterprise Services
- The Data Tier
- The Crystal Enterprise Architecture in Action
- Taking Advantage of the Crystal Enterprise Distributed Architecture
- Extending Crystal Enterprise
Planning Considerations When Deploying Crystal Enterprise
- Planning Considerations When Deploying Crystal Enterprise
- Ensuring a Successful Crystal Enterprise Implementation
- Approaching the Project
- Identifying Business Pain
- Establishing Project Requirements
- Understanding Organizational Reporting Requirements
- Troubleshooting
Deploying Crystal Enterprise in a Complex Network Environment
- Deploying Crystal Enterprise in a Complex Network Environment
- Introduction
- Understanding Network Protocols
- Understanding Firewall Types
- Configuring the Crystal Enterprise Architecture for Your Network Environment
- Interaction Between the WCS and the WC
- Deploying Crystal Enterprise with an IP Packet Filtering Firewall
- Using Crystal Enterprise with NAT
- Exploring the NAT and Crystal Enterprise Relationship
- Crystal Enterprise and Proxy Servers
Administering and Configuring Crystal Enterprise
- Introduction
- Using the Crystal Management Console
- Managing Accounts
- Managing Content
- Introducing Servers
- Managing Crystal Enterprise System Settings
- Using the Crystal Configuration Manager
Part VI. Customized Report Distribution Using Crystal Reports Components
Java Reporting Components
- Java Reporting Components
- Overview of the Crystal Reports Java Reporting Component
- Understanding the Java Reporting Components Architecture
- Differences with the Java Reporting Engine
- Configuring the Application Server
- Delivering Reports in Web Applications
- Using the Crystal Tag Libraries
- Exporting Reports to Other File Formats
- Printing Reports from the Browser
- Common Programming Tasks
- Troubleshooting
Crystal Reports .NET Components
- Crystal Reports .NET Components
- Understanding Microsofts .NET Platform
- Understanding the Different Crystal .NET Components
- An Overview of the Crystal Reports 10 .NET Components
- The Report Designer
- The Report Engine Object Model
- Delivering Reports with the Windows Forms Viewer
- Delivering Reports with the Web Forms Viewer
- Database Credentials
- Setting Parameters
- Troubleshooting
COM Reporting Components
- COM Reporting Components
- Understanding the Report Designer Component
- Building Reports with the Visual Basic Report Designer
- Programming with the Report Engine Object Model
- Delivering Reports Using the Report Viewer
- Troubleshooting
Part VII. Customized Report Distribution Using Crystal Enterprise Embedded Edition
Introduction to Crystal Enterprise Embedded Edition
- Introduction to Crystal Enterprise Embedded Edition
- Introduction to Crystal Enterprise Embedded Edition
- Understanding Crystal Enterprise Embedded Edition
- Crystal Enterprise Embedded Edition Samples
- DHTML Report Design Wizard
- Troubleshooting
Crystal Enterprise Viewing Reports
- Crystal Enterprise Viewing Reports
- Viewing Reports over the Web
- Introduction to the Crystal Report Viewers
- Understanding the Report Source
- Implementing the Page Viewer
- Implementing the Part Viewer
- Implementing the Interactive Viewer
- Implementing the Grid Viewer
- Troubleshooting
Crystal Enterprise Embedded Report Modification and Creation
- Introduction
- Deploying RAS Environments
- Loading Report Files
- Locating RAS Components in a Network Architecture
- Installing the RAS SDK
- Best Practices in RAS Exception Handling
- The RAS SDK in Action
Part VIII. Customized Report Distribution Using Crystal Enterprise Professional
Introduction to the Crystal Enterprise Professional Object Model
- Introduction to the Crystal Enterprise Professional Object Model
- Understanding the Crystal Enterprise Object Model
- Establishing a Crystal Enterprise Session
- Querying the Crystal Enterprise Repository
- Viewing Reports
- The Crystal Enterprise Java SDK
- Accessing the Java SDK
- Troubleshooting
Creating Enterprise Reports Applications with Crystal Enterprise Part I
- Creating Enterprise Reports Applications with Crystal Enterprise Part I
- Advanced Scenarios with the Crystal Enterprise Object Model
- Scheduling Reports
- Scheduling to a Destination
- Using Crystal Enterprise Notifications
- Scheduling to a Server Group
- Scheduling to a Specific Format
- Setting Database Credentials
- Troubleshooting
Creating Enterprise Reporting Applications with Crystal Enterprise Part II
- Creating Enterprise Reporting Applications with Crystal Enterprise Part II
- Querying the Crystal Enterprise InfoStore
- Creating and Responding to Crystal Enterprise Alerts
- Creating Schedulable Program Objects
- Troubleshooting
Appendix A. Using Sql Queries In Crystal Reports
Creating Enterprise Reporting Applications with Crystal Enterprise Part II
EAN: 2147483647
Pages: 341
