Customizing the Web Desktop and Report Viewers
The Web Desktop enables the user to make modifications as to how he might want to view the reports. These settings can be based on a per-user basis or set globally by the system administrator with no user privilege being provided for self-selection.
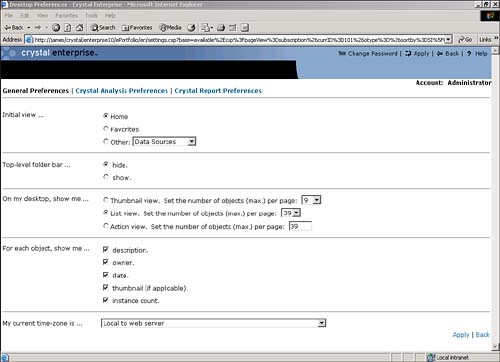
In the default Web Desktop, each user is allowed to self-select a number of display preferences through the preferences page accessed through the Preferences link and icon in the upper-right corner of the Web Desktop. In addition to being able to change passwords on this page, the end user can specify a number of display preferences. The Preferences Page highlighted in Figure 23.6 is broken down into three tabs, namely General Preferences, Crystal Analysis Preferences, and Crystal Report Preferences. Each is discussed in succession in the following sections.
Figure 23.6. General Preferences Page accessed from the Web Desktop. Here users can customize their Web Desktop.
NOTE
The administrator via the Crystal Management Console has the right to remove the preferences icon from the page, effectively removing the user's right to change this.
General Preferences
The General Preferences tab of the Preferences screen provides access to a number of customizable user-display settings for Crystal Enterprise. Table 23.2 presents a description of each of these settings.
|
Options |
Description |
|---|---|
|
Initial View |
Web Desktop navigates to and opens the folder selected. In the default interface, end users can only select Home, their personal favorites folder, or any other top-level folder in the system. They cannot set a subfolder as the default initial view. This can be provided through a customized edit of the underlying settings.csp page if you want. |
|
Top-level Folder Bar |
By selecting Show, the top-level folders are displayed, enabling the user to navigate to folders higher up the folder tree easily. |
|
Views |
The user can see various views of how the reports are displayed. |
|
Thumbnail View |
Crystal Reports can capture a thumbnail of the first page of the report. The user can associate the look of the report with the thumbnail without having to remember what the report is called. |
|
List View |
Lists the objects whereby the user must click on the object to determine the allowed actions. |
|
Action View |
Lists the objects but instead of just showing the objects, this shows the available actions allowed. |
|
For Each Object, Show Me |
Users can select what they find applicable for display purposes among report description, report owner, report date, report thumbnail, or report instance count. |
|
Time Zone |
This is important for users who are going to schedule reports at a particular date and time. The time entered to start the scheduling process is by default local to the Web server (not the CMS). For example, if the user schedules the report and his time zone is PST and the Web server is running in EST then the report runs three hours sooner than expected. This issue is further emphasized when the system has anonymous or guest access enabled because the guest user can only have one time zone associated with it but might be used by many users around the world. If this is the case, it is recommended to establish an account for each of the scheduling users. |
Crystal Analysis Preferences
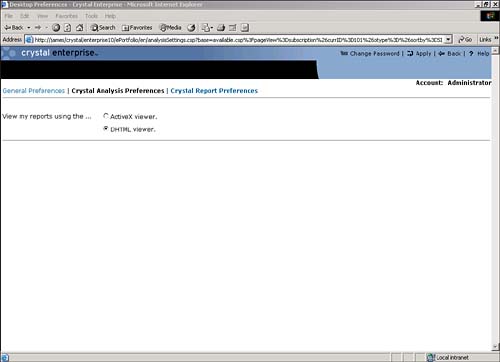
If Crystal Enterprise is licensed for Crystal Analysis, the user can choose between running the Active X (sometimes called the rich client) or the DHTML versions of the viewer under the Crystal Analysis Preferences tab (see Figure 23.7).
Figure 23.7. The Crystal Analysis Preferences tab.
Crystal Analysis DHTML Viewer
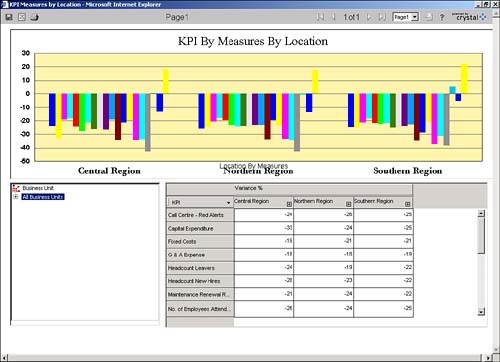
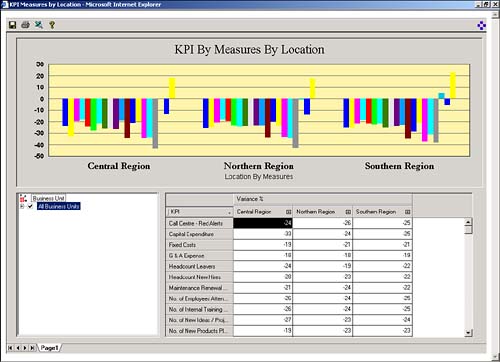
This is the default viewer for Crystal Analysis reports (see Figure 23.8). It does not require any download to the browser and all that is sent to the browser is DHTML.
Figure 23.8. Crystal Analysis Report as viewed in the DHTML viewer.
This viewer gives you the capability to
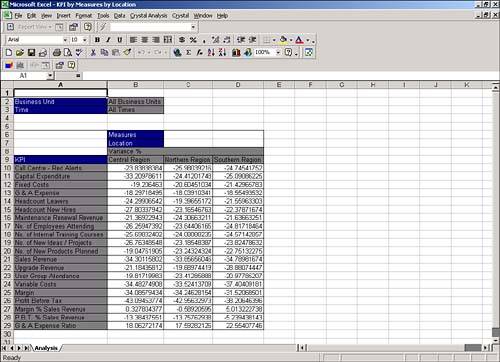
- Export to Excel: The current view of data is exported to Excel; however, this is a static link and if the current view changes, no data changes in Excel until another export is initiated (see Figure 23.9).
Figure 23.9. View of the report exported to Excel. There is no active link established with the database and should the data change, the report would have to be exported again to reflect the change.
- Save views: The viewer enables the user to save the current view of data back to Crystal Enterprise. This enables the user to return to that exact view of data, or to share this view with other users.
- Navigate between the pages: If the Crystal Analysis application has multiple pages in the application, these viewers enable the user to navigate between these pages either by selecting the page or through the use of transition buttons.
NOTE
In addition to using the DHTML and ActiveX viewers to view OLAP-based data, Business Objects provides an interactive Excel add-in for Crystal Analysis that provides rich multidimensional analytic capabilities from within the Excel environment. This is covered in Chapter 21 and should be explored for organizations with a large number of Excel power users. Additionally, when an export is completed from the ActiveX Viewer, it automatically uses the Crystal Analysis Excel plug-in if it has been installed on the client's desktop version of Excel.
Crystal Analysis Active X Viewer
Although the Active X or Rich Client viewer (see Figure 23.10) requires an initial download to the browser, there is some added functionality that you get with this Rich Client viewer:
- Performance: Some of the work can now be performed on the client.
- Enhanced Excel integration: An active link is maintained between the Excel spreadsheet and the data cube that you are reporting off of. This connection makes the spreadsheet far more dynamic (see Figure 23.11).
Figure 23.11. This view of the data in Excel includes the Crystal Analysis plug-in. Users can right-click a cell and perform functions because an active link is maintained between the cube of data and the spreadsheet.
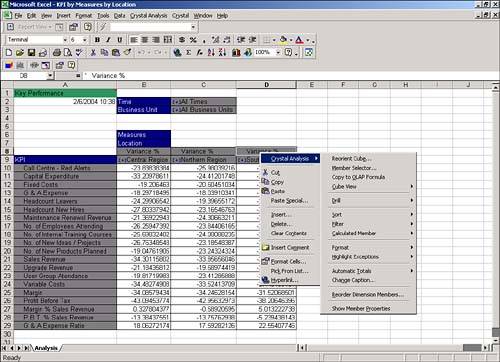
Figure 23.10. Active X or Rich Client viewer offers some performance gains over the DHTML viewer but requires an initial download.
CAUTION
One concern about the Crystal Analysis viewers is their printing and export capabilities. Crystal Analysis viewers cannot export to formats other than Microsoft Excel. Furthermore, the printing is tricky and it is often difficult to get an Analysis page to reflect accurately on a printed page.
Crystal Report Preferences
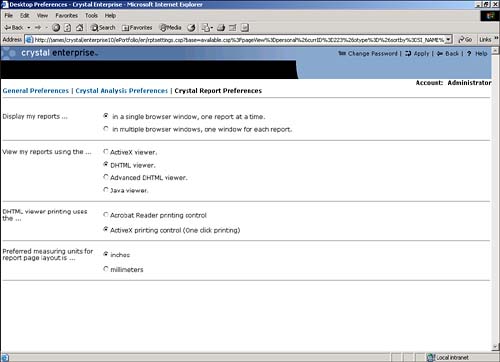
This page (see Figure 23.12) enables the user to set preferences specifically around the Crystal Report viewers. Table 23.3 highlights the different options available.
Figure 23.12. The Crystal Report Preferences page describes the Crystal Report options a user can set regarding printing and viewing reports.
|
Option |
Description |
|---|---|
|
Display My Reports |
In a single window, this makes each report appear in the same browser window. This is well-suited to small reports that are executed quickly because multiple browsers are not opened. Multiple Browsers are useful for large reports where there is some wait time before the report is rendered. This way a user can run other reports while she waits for the first to complete. |
|
View My Reports Using |
Enables the user to specify the type of viewer. There are additional viewers other than the four mentioned on this page (ActiveX, DHTML, Advanced DHTML and Java Viewers)see the following section, "Crystal Report Viewers," for further information. |
|
DHTML Viewer Printing Uses |
If the user has selected the DHTML viewer, when printing the user has two optionseither export the report to PDF and use the Acrobat reader printing control or download an ActiveX printing control. |
|
Preferred Measuring Units |
Determines what the preferred unit of measure is defining the reporting page layout. |
Before continuing, it is worth investigating these Crystal Reports viewers in a little more detail.
Crystal Report Viewers
The Crystal Report viewers take the data from the Crystal Enterprise framework and format the data into a report such that it can be viewed.
Table 23.4 provides a listing of the base functionality that the Crystal Report viewers provide.
|
Viewer Option |
Description |
|---|---|
|
Group Tree |
The group tree icon enables the user to either display or hide the group one exist in the report. By default, this is set to display the group tree. |
|
Export |
Should the user want to export the report to another format, this enables the user to export the report. |
|
Refresh |
The report can be refreshed against the data source. This means that it is rerun against the data source. |
|
|
Depending on how the DHTML viewer printing parameter is set, the DHTML viewer either uses a small ActiveX print control to print the document or exports the report to Adobe PDF before using the Adobe client to print it. |
|
Drill-down viewer name |
If the report enables drill-down, the section of data displayed. |
|
First Page |
User is taken to the first page of the report. |
|
Previous Page |
Pages up the report. |
|
Next Page |
Pages down the report. |
|
Last Page |
User is taken to the last page of the report. |
|
Go to page |
User can go to a specific page. |
|
Find |
User can search for any text inside the report and any associated match is highlighted. It is not case sensitive, however; if the text is located in a hidden drill down, the Find might not work. |
|
Zoom |
Scale the report by setting the percent. |
The drill-down functionality provided in the designer is honored by the viewer and users can drill down on charts, group sections, and the group tree.
The look and feel of the DHTML viewer can be customized via the viewer SDK and any of these functions can be turned on or off depending on the requirement.
The Crystal Report viewers are either client-side or server-side reportshence the process of viewing a report is different depending on the viewer used.
Server-Side Viewers
The Server-Side viewers run within the application server framework; for example, the Java DHTML viewer consists of Java classes that run within the Java Application Server. The COM DHTML viewer processes the request within the Web Component Server or WCS. Upon receiving a report request, the Crystal Enterprise framework sends the data in Encapsulated Page Format (EPF) to the application server. A viewer object is instantiated and the application server processes the EPF pages. DHTML consisting of both the data and the viewer controls are then sent through to the Web server.
DHTML Viewer
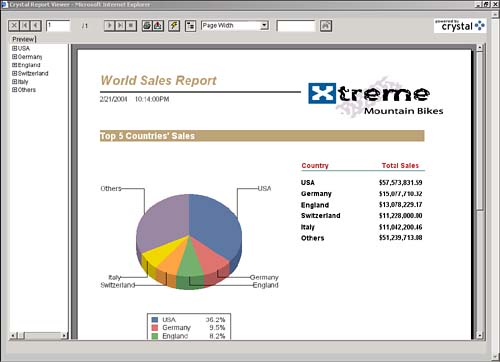
The DHTML viewer is one of the most commonly used report viewers in Crystal Enterprise, see Figure 23.13. It provides a rich functional interface for viewing and navigating Crystal Reports in a zero client interface. This zero client viewer is implemented via viewreport.csp, that requires the Web Component Server to be running or in a Java environment via viewreport.jsp that requires a Java application server to be running. This viewer can be manipulated via a COM, .NET, or Java APIall explored in the later sections of this book.
Figure 23.13. Report viewed in the DHTML viewer. Both the viewer controls and data are sent in DHTML format.
Advanced DHTML Viewer
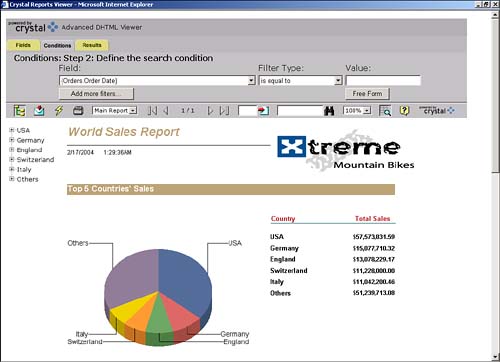
The advanced DHTML viewer includes all of the functionality of the DHTML viewer but also includes an advanced search wizard that enables you to search for data by setting conditions and to return the data in a table form.
Use the Advanced Search Wizard icon to toggle the report to display the Advanced DHTML viewer options that are described in Table 23.5.
|
Tab |
Description |
|---|---|
|
Fields tab |
Shows all the fields that were available in the original report, including any formulas and summaries. Select the fields required and sort them by changing the sort order; the field at the top of the list appears first on the list. |
|
Conditions tab |
Apply any filtering to the report as deemed necessary by selecting the fields and setting the conditions that apply. Add as many conditions as required and separate them using an AND or OR condition. The free-form button enables you to write free-form conditions or to check your condition statement. Figure 23.14 shows the Conditions tab. |
|
Results tab |
The Results tab provides the search results (if any) associated with the fields selected in the Fields tab and after application of the filters set in the Conditions tab. These results are provided with active hyperlinks to their respective position in the associated report. Additionally, some quick export functionality is provided to Excel, Word, or HTML. Of further interest is that the active hyperlinks back into the main Crystal Report are maintained through the export and can be used within the newly exported environment. |
Figure 23.14. This report is viewed in the Advanced DHTML viewer. The user could enter a date to show all orders for a particular day.
NOTE
When searching for strings, keep in mind they are case sensitive.
CAUTION
The Advanced DTHML viewer requires the Report Application Server to be installed and running.
Discussions Viewer
The Discussions viewer enables the user to make notes or annotations associated with the involved report or report instance. It enables users to make notes Public or Private, to associate attachments with the notes, and to forward the note to another interested party via e-mail. For example, the sales manager might want to post a note specifying that sales were below what he had expected. Sales representatives could then post their responses to the relevant sections of the report, attaching, for example, a forecast in Excel spreadsheet format. Users can add notes as a follow-up to an existing note, creating what is called a discussion thread, or they can create a new note, starting a new thread (see Figure 23.15).
Figure 23.15. The Discussion viewer showing the beginnings of a discussion thread.
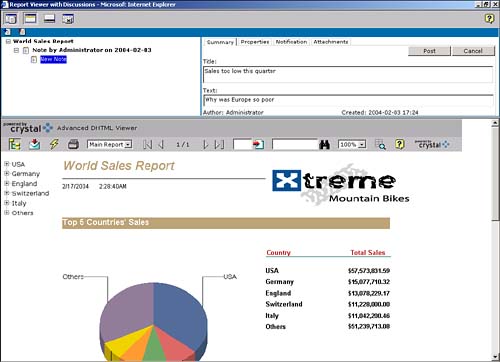
Table 23.6 describes the various Discussion viewer tabs.
|
Tab |
Description |
|---|---|
|
Summary tab |
Enables the user to add new notes and to view the associated text with an exiting note. It also displays the author of the note and a creation timestamp of the note. |
|
Properties tab |
This tab enables the user to set the importance of the note. Highly important notes have a red flag associated with them and notes of low importance have a blue flag associated with them. Notes of normal importance have no flag. Permissions can be public or private. A private permission means only you having access to the note; in other words, it's a note to self. Public means that anybody who has access to the report can see the note. |
|
Notification tab |
Users can send an e-mail notifying other users that a note has been posted. |
|
Attachments tab |
Supporting documentation can be added to the note. Supported attachments can be of file types .doc, .txt, .pdf, .ppt, .xls, .htm, .html, and .zip. |
NOTE
The user needs to select the root of the thread to insert the note. For the initial thread, the report itself needs to be highlighted.
Mobile Viewer
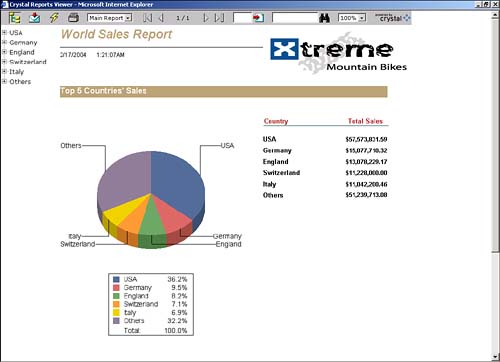
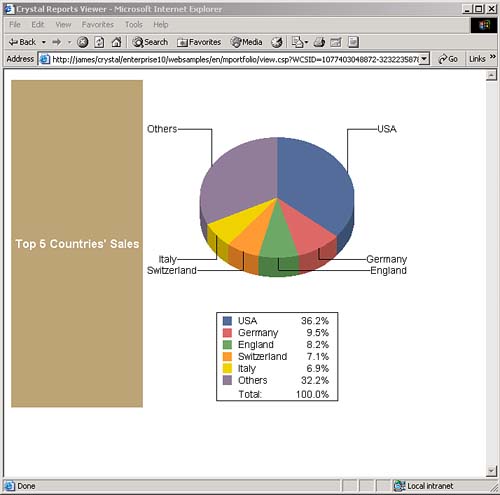
The Mobile viewer enables the user to simulate viewing reports over a WAP-enabled mobile phone or Web-enabled PDA. The design paradigm is simple with only a certain number of characters enabled across the page for fitting into the device. Additionally, these devices typically have limited bandwidth so transferring large reports with thousands of rows would not be an acceptable end-user experience. The Mobile viewer requires that the involved report contain a report part that enables the user to see the critical piece of the report. For example, Figure 23.16 displays the chart of the world sales report as a report part.
Figure 23.16. The Mobile viewer enables the user to simulate viewing reports via a WAP-enabled phone or Web-enabled PDA. Only the initial chart from the World Sales Report is displayed.
Client-Side Viewers
The Client-Side viewers require some components to be downloaded and executed on the client (browser). The Client-Side viewers do offer some enhanced printing and processing capabilities. Additionally, these viewers require an initial download to the client and hence some of the report processing is performed on the client.
ActiveX Viewer
This viewer is available using Microsoft Internet Explorer supporting ActiveX controls. Over and above the standard viewer functionality described previously, this viewer enables users to freeze the pane; in other words, the users can scroll across or down the report and "frozen" sections remain part of the viewable area. This is achieved by right-clicking on a field where you want the panes to the left and above to be frozen. This enables the user to scroll while headings and other sections remain frozen, shown in Figure 23.17.
Figure 23.17. ActiveX viewer provides additional capabilities allowing sections of the viewer to be frozen. The user can scroll across the remaining sections.
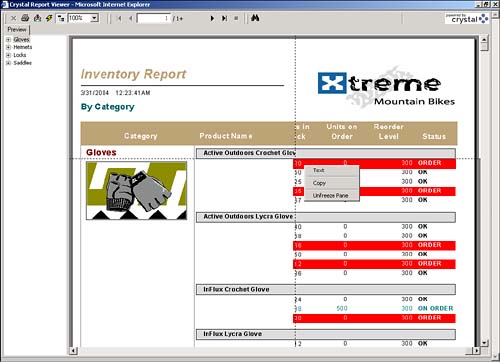
The user can also copy a cell value from a report by right-clicking the cell and selecting the copy function.
Java Viewer
The Java viewer (see Figure 23.18) is a Client-Side viewer that is downloaded. It requires that a suitable Java Virtual Machine (JVM) be running on the client. If one is not available, the user is prompted to install one.
Figure 23.18. World Sales Report sample as viewed within the Java viewer.
Crystal Offline Viewer
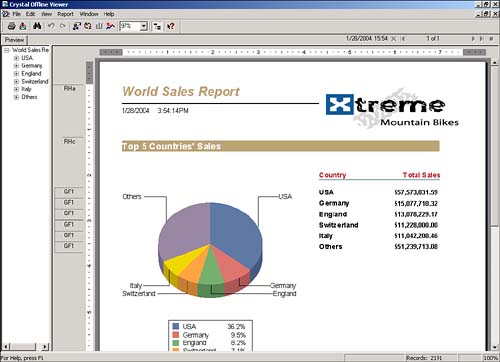
What makes the Offline viewer different is that you can view Crystal Reports in an offline mode. In other words, the user does not have to be connected to the Crystal Enterprise infrastructure and just needs access to the Crystal Report, that is, the .rpt file. Figure 23.19 displays the World Sales Report in an offline mode.
Figure 23.19. The Offline viewer provides the strongest report manipulation capabilities compared to all the previously mentioned viewers; however, this viewer is not browser-based and requires a Windows desktop download.
NOTE
To use the Offline viewer, you must save the involved report with data. You can accomplish this by using the Save With Data option directly from Crystal Reports or by exporting from Crystal Enterprise to the client's machine.
The Offline viewer itself is the most powerful report viewer with respect to data manipulation. It provides functionality over and above the other viewers and gives you the capability to
- Include a larger number of format options.
- Perform improved search capabilities, enabling partial or whole word text search and case matching.
- Create multiple filters.
- Sort data based on the top or bottom value; for example, show the top five countries in sales.
- Change chart types and format the charts.
The biggest drawbacks to this viewer are the following:
- It is not a Web-based viewer.
- Users cannot refresh data live against the database.
To refresh the data the report would have to be refreshed using the Crystal Reports designer and resaved with data.
Object Package Viewing
Object packages are new to Crystal Enterprise version 10. They require special mention because viewing a package is different than viewing a report object.
Object packages enable the user to schedule a package as opposed to scheduling the individual components. For example, if the user had reports that were related to one another via hyperlinks without object packages, the user would have had to schedule each individual report making sure the parameters were consistent and accurate information was displayed. With object packages, the package of reports can be scheduled as a whole and any common parameters propagated through the package. If three individual reports were run and each report had a date parameter, the user would need to ensure that the date values were consistent across all reports or else the data would not be consistent. With object packages you can run these as one object and propagate the date parameter for each report to ensure consistency.
For more information about setting up an object package, see Chapter 27.
When viewing an object package, Crystal Enterprise displays a list of the objects that are within the package. This tells the user what the package consists of. To view the individual components, click the individual object within the package. The object type opens with its own individual viewer, which is dictated to by the preferences set by the individual user.
Organizing Objects Within the Web Desktop
Within the Web Desktop the user can organize the objects, given the appropriate permissions (see Figure 23.20). This functionality effectively means that users who have the rights can copy, move, rename, create shortcuts, and delete objects and folders to which they have access.
Figure 23.20. Users can organize the objects to which they have access.
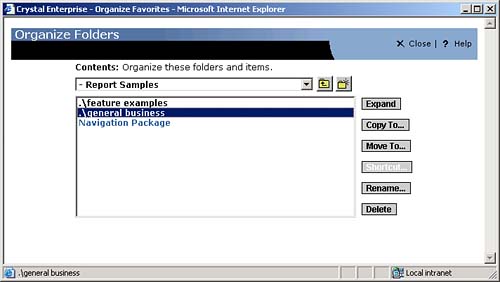
The user would click the Organize icon and the screen in Figure 23.20 would appear. She could then navigate through the objects, copying or moving them to the desired location. The Create Shortcut option enables Crystal Enterprise to have one object, but enables multiple users to access that object. This simplifies maintenance because the administrator or user can update a single object and all users that have access see the change. The Update buttons are also context-sensitive; for example, if the user has a report object selected, only available report functions are available.
Part I. Crystal Reports Design
Creating and Designing Basic Reports
- Creating and Designing Basic Reports
- Introducing the Crystal Reports Designer
- Understanding Data and Data Sources
- Introduction to the Data Explorer
- Adding Database Objects to Your Report
- Joining Database Objects Together
- Understanding the Different Join Types
- Using the Report Creation Wizards
- Understanding the Crystal Reports Gallery
- Using the Standard Report Creation Wizard
- Creating a Report Without Wizards
- Troubleshooting
Selecting and Grouping Data
- Selecting and Grouping Data
- Introduction
- Understanding Field Objects
- Working with Groups
- Understanding Drill-down Reports
- Troubleshooting
Filtering, Sorting, and Summarizing Data
- Filtering, Sorting, and Summarizing Data
- Introduction
- Filtering the Data in Your Report
- Learning to Sort Records
- Working with the Sort Expert
- Creating Effective Summaries
- Troubleshooting
Understanding and Implementing Formulas
- Understanding and Implementing Formulas
- Introduction
- Using the Formula Workshop
- Using the Workshop Formula Editor
- Creating Formulas with the Formula Expert
- Using the Formula Extractor to Create Custom Functions
- The Multi-Pass Reporting Process of the Crystal Reports Engine
- Troubleshooting
Implementing Parameters for Dynamic Reporting
- Implementing Parameters for Dynamic Reporting
- Introduction
- Understanding the Value of Parameters
- Creating and Implementing Parameters Fields
- Using Parameters with Record Selections
Part II. Formatting Crystal Reports
Fundamentals of Report Formatting
- Fundamentals of Report Formatting
- Introduction
- Positioning and Sizing Report Objects
- Modifying Object Properties for Formatting Purposes
- Exploring the Format Editor Dialog Common Options
- Combining and Layering Report Objects
- Configuring Report Page and Margin Properties
Working with Report Sections
- Working with Report Sections
- Introduction
- Formatting Report Sections
- Modifying Report Section Properties
- Using Multiple Report Sections
- Troubleshooting
Visualizing Your Data with Charts and Maps
- Visualizing Your Data with Charts and Maps
- Introduction to Charts and Maps
- Using the Chart Expert
- Using the Map Expert
- Modifying Chart and Map Properties
- Troubleshooting
Custom Formatting Techniques
- Introduction
- Making Presentation-Quality Reports
- Common Formatting Features
- Conditional Formatting Using Data to Drive the Look of a Report
Part III. Advanced Crystal Reports Design
Using Cross-Tabs for Summarized Reporting
- Using Cross-Tabs for Summarized Reporting
- Introduction to Cross-Tabs
- Benefits of Cross-Tabs
- Using the Cross-Tab Wizard
- Using Top N with Cross-Tabs Reports
- Using Advanced Cross-Tab Features
Using Record Selections and Alerts for Interactive Reporting
- Using Record Selections and Alerts for Interactive Reporting
- Creating Advanced Record Selection Formulas
- Adding Alerting to Your Reports
- Performance Monitoring and Tuning
Using Subreports and Multi-Pass Reporting
- Using Subreports and Multi-Pass Reporting
- Understanding Subreports
- Understanding Linked Versus Unlinked Subreports
- Considering Subreport Execution Time and Performance
- Using Variables to Pass Data Between Reports
- Emulating Nested Subreports
- Troubleshooting
Using Formulas and Custom Functions
- Using Formulas and Custom Functions
- Becoming More Productive with Formulas
- Choosing a Formula Language: Crystal Versus Basic Syntax
- Using Brackets in Formulas
- Using Characters in Formulas
- Recent Improvements to Formulas
Designing Effective Report Templates
- Designing Effective Report Templates
- Understanding the Importance of Reuse in Reporting
- Understanding Report Templates
- Using Report Templates
- Using Existing Crystal Reports as Templates
- Understanding How Templates Work
- Creating Useful Report Templates
- Using Template Field Objects
- Using Report Templates to Reduce Report Creation Effort
- Applying Multiple Templates
Additional Data Sources for Crystal Reports
- Additional Data Sources for Crystal Reports
- Understanding the Additional Crystal Reports Data Sources
- Connecting to COM-based Data Sources
- Connecting to Java-based Data Sources
- Understanding Solution Kits for Crystal Enterprise
- Troubleshooting
Multidimensional Reporting Against OLAP Data with Crystal Reports
- Multidimensional Reporting Against OLAP Data with Crystal Reports
- Introduction to OLAP
- OLAP Concepts and OLAP Reporting
- Recently Added or Changed OLAP Features in Crystal Reports
- Using the OLAP Report Creation Wizard and OLAP Expert
- Advanced OLAP Reporting
- Introduction to Crystal Analysis
Part IV. Enterprise Report Design Analytic, Web-based, and Excel Report Design
Introduction to Crystal Repository
- Introduction to Crystal Repository
- What Is the Crystal Repository?
- Why Implement the Crystal Repository?
- Installing the Crystal Repository
- Adding Objects to and from the Repository
- Migration of the Crystal Enterprise Repository
- Troubleshooting
Crystal Reports Semantic Layer Business Views
- Crystal Reports Semantic Layer Business Views
- Introduction to Business Views
- Why Implement Business Views?
- Performance and Implementation Considerations
- Business Views Architecture and Implementation
- Troubleshooting
Creating Crystal Analysis Reports
- Creating Crystal Analysis Reports
- Introduction
- Introducing Crystal Analysis
- Accessing OLAP Data with Crystal Analysis
- Designing Crystal Analysis Reports and Applications
- Adding Crystal Analysis Objects to a Report
- Troubleshooting
Advanced Crystal Analysis Report Design
- Advanced Crystal Analysis Report Design
- Introduction
- Advanced Crystal Analysis Designer Tools
- Custom Calculations and Advanced Data Analysis
- Setting Report Options
- Troubleshooting
- Crystal Analysis in the Real World MDX
Ad-Hoc Application and Excel Plug-in for Ad-Hoc and Analytic Reporting
- Ad-Hoc Application and Excel Plug-in for Ad-Hoc and Analytic Reporting
- Introducing Ad-Hoc Reporting Conceptually
- Introducing the Crystal Enterprise Ad-Hoc Reporting Application
- Crystal Reports Excel Plug-in
- Crystal Analysis Excel Plug-in
Part V. Web Report Distribution Using Crystal Enterprise
Introduction to Crystal Enterprise
- Introduction to Crystal Enterprise
- What Is Crystal Enterprise?
- Why Implement a Crystal Enterprise Solution?
- Versions of Crystal Enterprise
- Understanding the Core Functions of Crystal Enterprise
Using Crystal Enterprise with Web Desktop
- Using Crystal Enterprise with Web Desktop
- Introduction
- Crystal Enterprise User Launchpad
- Crystal Enterprise Web Desktop
- Customizing the Web Desktop and Report Viewers
- Publishing to the Web Desktop
- Customizing the Web Desktop
- Troubleshooting
Crystal Enterprise Architecture
- Crystal Enterprise Architecture
- Introduction
- Crystal Enterprise Architecture Overview
- The Client Tier
- The Application Tier
- The Server Tier: Introduction to the Crystal Enterprise Framework
- The Server Tier: Overview of the Crystal Enterprise Services
- The Data Tier
- The Crystal Enterprise Architecture in Action
- Taking Advantage of the Crystal Enterprise Distributed Architecture
- Extending Crystal Enterprise
Planning Considerations When Deploying Crystal Enterprise
- Planning Considerations When Deploying Crystal Enterprise
- Ensuring a Successful Crystal Enterprise Implementation
- Approaching the Project
- Identifying Business Pain
- Establishing Project Requirements
- Understanding Organizational Reporting Requirements
- Troubleshooting
Deploying Crystal Enterprise in a Complex Network Environment
- Deploying Crystal Enterprise in a Complex Network Environment
- Introduction
- Understanding Network Protocols
- Understanding Firewall Types
- Configuring the Crystal Enterprise Architecture for Your Network Environment
- Interaction Between the WCS and the WC
- Deploying Crystal Enterprise with an IP Packet Filtering Firewall
- Using Crystal Enterprise with NAT
- Exploring the NAT and Crystal Enterprise Relationship
- Crystal Enterprise and Proxy Servers
Administering and Configuring Crystal Enterprise
- Introduction
- Using the Crystal Management Console
- Managing Accounts
- Managing Content
- Introducing Servers
- Managing Crystal Enterprise System Settings
- Using the Crystal Configuration Manager
Part VI. Customized Report Distribution Using Crystal Reports Components
Java Reporting Components
- Java Reporting Components
- Overview of the Crystal Reports Java Reporting Component
- Understanding the Java Reporting Components Architecture
- Differences with the Java Reporting Engine
- Configuring the Application Server
- Delivering Reports in Web Applications
- Using the Crystal Tag Libraries
- Exporting Reports to Other File Formats
- Printing Reports from the Browser
- Common Programming Tasks
- Troubleshooting
Crystal Reports .NET Components
- Crystal Reports .NET Components
- Understanding Microsofts .NET Platform
- Understanding the Different Crystal .NET Components
- An Overview of the Crystal Reports 10 .NET Components
- The Report Designer
- The Report Engine Object Model
- Delivering Reports with the Windows Forms Viewer
- Delivering Reports with the Web Forms Viewer
- Database Credentials
- Setting Parameters
- Troubleshooting
COM Reporting Components
- COM Reporting Components
- Understanding the Report Designer Component
- Building Reports with the Visual Basic Report Designer
- Programming with the Report Engine Object Model
- Delivering Reports Using the Report Viewer
- Troubleshooting
Part VII. Customized Report Distribution Using Crystal Enterprise Embedded Edition
Introduction to Crystal Enterprise Embedded Edition
- Introduction to Crystal Enterprise Embedded Edition
- Introduction to Crystal Enterprise Embedded Edition
- Understanding Crystal Enterprise Embedded Edition
- Crystal Enterprise Embedded Edition Samples
- DHTML Report Design Wizard
- Troubleshooting
Crystal Enterprise Viewing Reports
- Crystal Enterprise Viewing Reports
- Viewing Reports over the Web
- Introduction to the Crystal Report Viewers
- Understanding the Report Source
- Implementing the Page Viewer
- Implementing the Part Viewer
- Implementing the Interactive Viewer
- Implementing the Grid Viewer
- Troubleshooting
Crystal Enterprise Embedded Report Modification and Creation
- Introduction
- Deploying RAS Environments
- Loading Report Files
- Locating RAS Components in a Network Architecture
- Installing the RAS SDK
- Best Practices in RAS Exception Handling
- The RAS SDK in Action
Part VIII. Customized Report Distribution Using Crystal Enterprise Professional
Introduction to the Crystal Enterprise Professional Object Model
- Introduction to the Crystal Enterprise Professional Object Model
- Understanding the Crystal Enterprise Object Model
- Establishing a Crystal Enterprise Session
- Querying the Crystal Enterprise Repository
- Viewing Reports
- The Crystal Enterprise Java SDK
- Accessing the Java SDK
- Troubleshooting
Creating Enterprise Reports Applications with Crystal Enterprise Part I
- Creating Enterprise Reports Applications with Crystal Enterprise Part I
- Advanced Scenarios with the Crystal Enterprise Object Model
- Scheduling Reports
- Scheduling to a Destination
- Using Crystal Enterprise Notifications
- Scheduling to a Server Group
- Scheduling to a Specific Format
- Setting Database Credentials
- Troubleshooting
Creating Enterprise Reporting Applications with Crystal Enterprise Part II
- Creating Enterprise Reporting Applications with Crystal Enterprise Part II
- Querying the Crystal Enterprise InfoStore
- Creating and Responding to Crystal Enterprise Alerts
- Creating Schedulable Program Objects
- Troubleshooting
Appendix A. Using Sql Queries In Crystal Reports
Creating Enterprise Reporting Applications with Crystal Enterprise Part II
EAN: 2147483647
Pages: 341
- Chapter I e-Search: A Conceptual Framework of Online Consumer Behavior
- Chapter VI Web Site Quality and Usability in E-Commerce
- Chapter XI User Satisfaction with Web Portals: An Empirical Study
- Chapter XVI Turning Web Surfers into Loyal Customers: Cognitive Lock-In Through Interface Design and Web Site Usability
- Chapter XVII Internet Markets and E-Loyalty
