Common Formatting Features
The most common formatting feature is changing font color or font face. This can be done by choosing the features directly on the Formatting toolbar, as shown in Figure 9.1.
Figure 9.1. The Crystal Reports Formatting toolbar lets you change object formatting.
Chapter 6 introduced the Highlighting Expert. I will assume that you have already learned the fundamentals of the highlighting expert.
Working with ToolTips
All report objects can have rollover text or ToolTips available when the report is viewed. For example, if you would like to use descriptive text to explain why a certain formula was created, you could do this with a ToolTip.
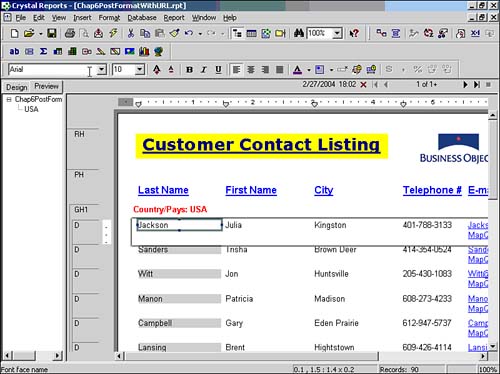
In the example created in Chapter 6, you now want to inform the end user about a formula. The text should appear whenever a user mouses over the Days Until Shipped fields on the report. The following steps create a ToolTip:
- Open Chap6.rpt, or the report created earlier in Chapter 6. Select File, Open and browse to find Chap6.rpt and open it.
- Format the e-mail field at the far right. Right-click on it and choose Format Field.
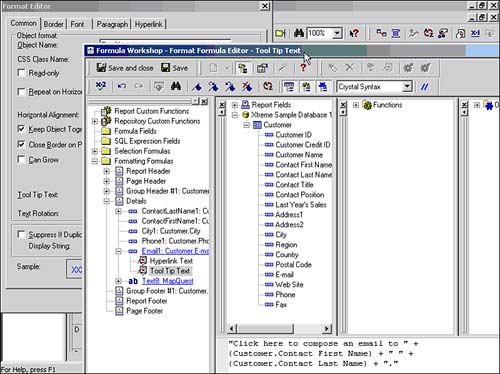
- Add the ToolTip text. In the Format Editor dialog, select the Common tab. To the right of the ToolTip Text box, click on the formula editor button (see Figure 9.2), and enter the following formula, which makes a custom message for each e-mail address:
"Click here to compose an e-mail to " +

{Customer.Contact First Name} + " " +

{Customer.Contact Last Name} + "."
Figure 9.2. On the Common tab, click the ToolTip text formula button.
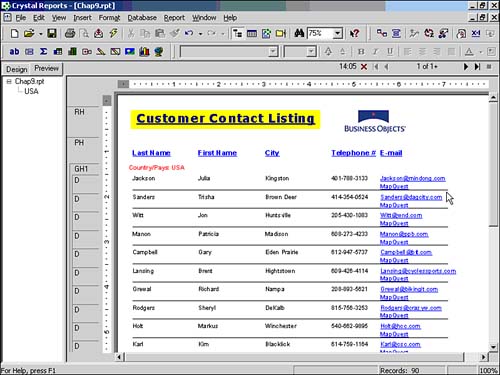
- Test the ToolTip text. Click OK to finish the formatting. In Preview, scroll the mouse over the e-mail field and see that the rollover text now appears as a custom message, which is different when viewed by each e-mail recipient. Before proceeding, save the report as Chap9_1.rpt by choosing File, Save As.
Lines and Boxes
Adding lines and boxes to a report can make it easier to read as well as visually grouping items for business users.
To add lines under each Detail section as well as a box around each group, follow these steps:
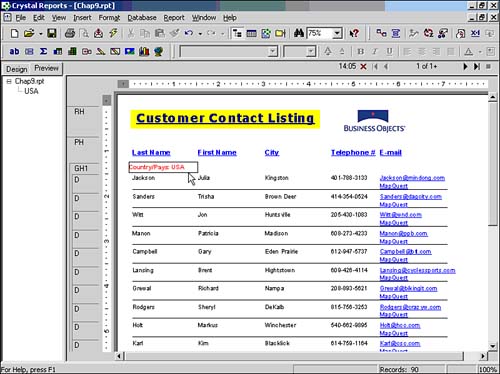
- View Chap9_1.rpt in Design mode. If the report is not already open, open it using Ctrl+O. Make sure that the report is in Design Mode by choosing Ctrl+D.
- Insert the line by Choosing Insert, Line. The mouse changes to a pencil. Move the mouse to the bottom-left of the fields in the Details Section. Hold down the left mouse button to begin drawing the line. Scroll the mouse to the right until you reach the end of the Details Section. Once reached, release the mouse button.
- View the result in Preview mode. Select F5 to refresh the report to see the line with the data as shown in Figure 9.3.
Figure 9.3. Use the Preview mode view of a report to show a line under each detail record.
- Add the box by choosing Insert, Box. The mouse changes to a pencil. Move the mouse to the top-left of the Country/Pays USA data in the Group Header. Hold down the left mouse button to begin drawing the box. Scroll the mouse down to the bottom left of the Summary amount in the Group Footer and then scroll to the right until the end of the Group Footer section. Once reached, release the mouse button. The resulting box should appear similar to Figure 9.4.
Figure 9.4. Preview a report to show lines and boxes.
- Choose File, Save As and save the report as Chap9_2.rpt.
TIP
A feature of boxes is that they can be rounded. To do this right-click on a box, choose Format Box, and select the Rounding tab. The rounding factor can be changed by the slide or the percentage buttons. Figure 9.5 shows how Xtreme's report would look with a rounded box at 30%.
Figure 9.5. Preview of a report showing rounded boxes.

Creating a Vertical Text Watermark
Another visually pleasing feature is the capability to rotate text. This can be very effective when used in conjunction with the Underlay Section property for sections. Follow these steps to make a sample watermark:
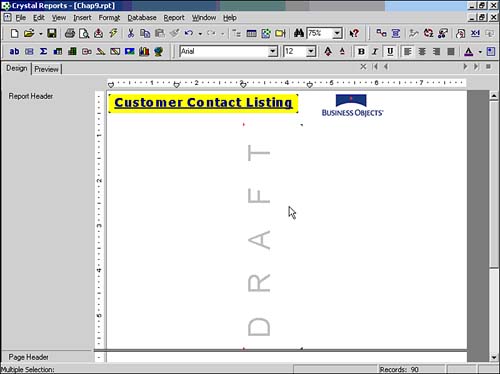
- Start by using Chap9_2.rpt in Design mode. Choose Insert, Text Object to add a text field in the Report Header. Enter DRAFT for the text.
- Right-click on the Text field and choose Format Text. Select the Common tab. Change the Text Rotation to 90 degrees and click OK. Go to the Font tab, where you can change the font size to 48pts. Because you want this watermark to be semi-transparent, choose the More item from the Color drop-down, where you can specify a custom color. Choose a light gray (or silver). Increase the Character font spacing by specifying 70 pts in the dialog, then exit the dialog by clicking OK twice.
NOTE
This color section, common to all objects within Crystal Reports 10, enables you to specify colors using RGB or Hue, Saturation, and Luminance. By choosing corporate colors and adding them to the custom colors, you can extend corporate branding into report presentation.
- Resize the field. Because the field needs to go down the page, it needs to be resized to be narrow and long. Select the field and choose the rightmost square on the field. Resize the object by holding down the left mouse button. Now choose the bottom square on the field and stretch the height to 5''. Figure 9.6 shows how this should look.
Figure 9.6. Design tab with text rotation applied to group name field.
- Refresh the report to see your progress by pressing F5. It shows the text rotated, although it is not running down beside the records as shown in Figure 9.7.
Figure 9.7. Preview of the report with text rotation.
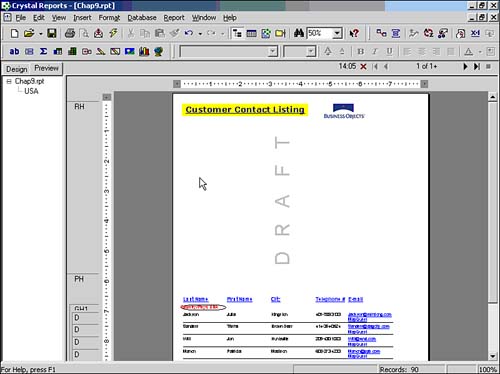
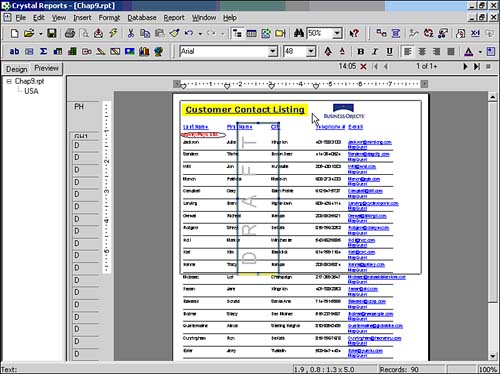
- Set the Report Header to Underlay. Because the text does not yet flow to the record level, it must be underlayed. This is a section property. Right-click in the Group Header 1 section located on the left side of the report design area, choose Section Expert, select Underlay Following Sections, and click OK. The desired results should appear similar to Figure 9.8.
Figure 9.8. Preview of the report with rotated text flowing beside detail records.
CAUTION
Realize that when rotating text, the justification rules might be opposite of what would normally be expected. In the case of 90 degrees, the text must be right-justified to have the company name appear to be top-justified, as shown in Figure 9.8.
- Save as Chap9_3.rpt.
Part I. Crystal Reports Design
Creating and Designing Basic Reports
- Creating and Designing Basic Reports
- Introducing the Crystal Reports Designer
- Understanding Data and Data Sources
- Introduction to the Data Explorer
- Adding Database Objects to Your Report
- Joining Database Objects Together
- Understanding the Different Join Types
- Using the Report Creation Wizards
- Understanding the Crystal Reports Gallery
- Using the Standard Report Creation Wizard
- Creating a Report Without Wizards
- Troubleshooting
Selecting and Grouping Data
- Selecting and Grouping Data
- Introduction
- Understanding Field Objects
- Working with Groups
- Understanding Drill-down Reports
- Troubleshooting
Filtering, Sorting, and Summarizing Data
- Filtering, Sorting, and Summarizing Data
- Introduction
- Filtering the Data in Your Report
- Learning to Sort Records
- Working with the Sort Expert
- Creating Effective Summaries
- Troubleshooting
Understanding and Implementing Formulas
- Understanding and Implementing Formulas
- Introduction
- Using the Formula Workshop
- Using the Workshop Formula Editor
- Creating Formulas with the Formula Expert
- Using the Formula Extractor to Create Custom Functions
- The Multi-Pass Reporting Process of the Crystal Reports Engine
- Troubleshooting
Implementing Parameters for Dynamic Reporting
- Implementing Parameters for Dynamic Reporting
- Introduction
- Understanding the Value of Parameters
- Creating and Implementing Parameters Fields
- Using Parameters with Record Selections
Part II. Formatting Crystal Reports
Fundamentals of Report Formatting
- Fundamentals of Report Formatting
- Introduction
- Positioning and Sizing Report Objects
- Modifying Object Properties for Formatting Purposes
- Exploring the Format Editor Dialog Common Options
- Combining and Layering Report Objects
- Configuring Report Page and Margin Properties
Working with Report Sections
- Working with Report Sections
- Introduction
- Formatting Report Sections
- Modifying Report Section Properties
- Using Multiple Report Sections
- Troubleshooting
Visualizing Your Data with Charts and Maps
- Visualizing Your Data with Charts and Maps
- Introduction to Charts and Maps
- Using the Chart Expert
- Using the Map Expert
- Modifying Chart and Map Properties
- Troubleshooting
Custom Formatting Techniques
- Introduction
- Making Presentation-Quality Reports
- Common Formatting Features
- Conditional Formatting Using Data to Drive the Look of a Report
Part III. Advanced Crystal Reports Design
Using Cross-Tabs for Summarized Reporting
- Using Cross-Tabs for Summarized Reporting
- Introduction to Cross-Tabs
- Benefits of Cross-Tabs
- Using the Cross-Tab Wizard
- Using Top N with Cross-Tabs Reports
- Using Advanced Cross-Tab Features
Using Record Selections and Alerts for Interactive Reporting
- Using Record Selections and Alerts for Interactive Reporting
- Creating Advanced Record Selection Formulas
- Adding Alerting to Your Reports
- Performance Monitoring and Tuning
Using Subreports and Multi-Pass Reporting
- Using Subreports and Multi-Pass Reporting
- Understanding Subreports
- Understanding Linked Versus Unlinked Subreports
- Considering Subreport Execution Time and Performance
- Using Variables to Pass Data Between Reports
- Emulating Nested Subreports
- Troubleshooting
Using Formulas and Custom Functions
- Using Formulas and Custom Functions
- Becoming More Productive with Formulas
- Choosing a Formula Language: Crystal Versus Basic Syntax
- Using Brackets in Formulas
- Using Characters in Formulas
- Recent Improvements to Formulas
Designing Effective Report Templates
- Designing Effective Report Templates
- Understanding the Importance of Reuse in Reporting
- Understanding Report Templates
- Using Report Templates
- Using Existing Crystal Reports as Templates
- Understanding How Templates Work
- Creating Useful Report Templates
- Using Template Field Objects
- Using Report Templates to Reduce Report Creation Effort
- Applying Multiple Templates
Additional Data Sources for Crystal Reports
- Additional Data Sources for Crystal Reports
- Understanding the Additional Crystal Reports Data Sources
- Connecting to COM-based Data Sources
- Connecting to Java-based Data Sources
- Understanding Solution Kits for Crystal Enterprise
- Troubleshooting
Multidimensional Reporting Against OLAP Data with Crystal Reports
- Multidimensional Reporting Against OLAP Data with Crystal Reports
- Introduction to OLAP
- OLAP Concepts and OLAP Reporting
- Recently Added or Changed OLAP Features in Crystal Reports
- Using the OLAP Report Creation Wizard and OLAP Expert
- Advanced OLAP Reporting
- Introduction to Crystal Analysis
Part IV. Enterprise Report Design Analytic, Web-based, and Excel Report Design
Introduction to Crystal Repository
- Introduction to Crystal Repository
- What Is the Crystal Repository?
- Why Implement the Crystal Repository?
- Installing the Crystal Repository
- Adding Objects to and from the Repository
- Migration of the Crystal Enterprise Repository
- Troubleshooting
Crystal Reports Semantic Layer Business Views
- Crystal Reports Semantic Layer Business Views
- Introduction to Business Views
- Why Implement Business Views?
- Performance and Implementation Considerations
- Business Views Architecture and Implementation
- Troubleshooting
Creating Crystal Analysis Reports
- Creating Crystal Analysis Reports
- Introduction
- Introducing Crystal Analysis
- Accessing OLAP Data with Crystal Analysis
- Designing Crystal Analysis Reports and Applications
- Adding Crystal Analysis Objects to a Report
- Troubleshooting
Advanced Crystal Analysis Report Design
- Advanced Crystal Analysis Report Design
- Introduction
- Advanced Crystal Analysis Designer Tools
- Custom Calculations and Advanced Data Analysis
- Setting Report Options
- Troubleshooting
- Crystal Analysis in the Real World MDX
Ad-Hoc Application and Excel Plug-in for Ad-Hoc and Analytic Reporting
- Ad-Hoc Application and Excel Plug-in for Ad-Hoc and Analytic Reporting
- Introducing Ad-Hoc Reporting Conceptually
- Introducing the Crystal Enterprise Ad-Hoc Reporting Application
- Crystal Reports Excel Plug-in
- Crystal Analysis Excel Plug-in
Part V. Web Report Distribution Using Crystal Enterprise
Introduction to Crystal Enterprise
- Introduction to Crystal Enterprise
- What Is Crystal Enterprise?
- Why Implement a Crystal Enterprise Solution?
- Versions of Crystal Enterprise
- Understanding the Core Functions of Crystal Enterprise
Using Crystal Enterprise with Web Desktop
- Using Crystal Enterprise with Web Desktop
- Introduction
- Crystal Enterprise User Launchpad
- Crystal Enterprise Web Desktop
- Customizing the Web Desktop and Report Viewers
- Publishing to the Web Desktop
- Customizing the Web Desktop
- Troubleshooting
Crystal Enterprise Architecture
- Crystal Enterprise Architecture
- Introduction
- Crystal Enterprise Architecture Overview
- The Client Tier
- The Application Tier
- The Server Tier: Introduction to the Crystal Enterprise Framework
- The Server Tier: Overview of the Crystal Enterprise Services
- The Data Tier
- The Crystal Enterprise Architecture in Action
- Taking Advantage of the Crystal Enterprise Distributed Architecture
- Extending Crystal Enterprise
Planning Considerations When Deploying Crystal Enterprise
- Planning Considerations When Deploying Crystal Enterprise
- Ensuring a Successful Crystal Enterprise Implementation
- Approaching the Project
- Identifying Business Pain
- Establishing Project Requirements
- Understanding Organizational Reporting Requirements
- Troubleshooting
Deploying Crystal Enterprise in a Complex Network Environment
- Deploying Crystal Enterprise in a Complex Network Environment
- Introduction
- Understanding Network Protocols
- Understanding Firewall Types
- Configuring the Crystal Enterprise Architecture for Your Network Environment
- Interaction Between the WCS and the WC
- Deploying Crystal Enterprise with an IP Packet Filtering Firewall
- Using Crystal Enterprise with NAT
- Exploring the NAT and Crystal Enterprise Relationship
- Crystal Enterprise and Proxy Servers
Administering and Configuring Crystal Enterprise
- Introduction
- Using the Crystal Management Console
- Managing Accounts
- Managing Content
- Introducing Servers
- Managing Crystal Enterprise System Settings
- Using the Crystal Configuration Manager
Part VI. Customized Report Distribution Using Crystal Reports Components
Java Reporting Components
- Java Reporting Components
- Overview of the Crystal Reports Java Reporting Component
- Understanding the Java Reporting Components Architecture
- Differences with the Java Reporting Engine
- Configuring the Application Server
- Delivering Reports in Web Applications
- Using the Crystal Tag Libraries
- Exporting Reports to Other File Formats
- Printing Reports from the Browser
- Common Programming Tasks
- Troubleshooting
Crystal Reports .NET Components
- Crystal Reports .NET Components
- Understanding Microsofts .NET Platform
- Understanding the Different Crystal .NET Components
- An Overview of the Crystal Reports 10 .NET Components
- The Report Designer
- The Report Engine Object Model
- Delivering Reports with the Windows Forms Viewer
- Delivering Reports with the Web Forms Viewer
- Database Credentials
- Setting Parameters
- Troubleshooting
COM Reporting Components
- COM Reporting Components
- Understanding the Report Designer Component
- Building Reports with the Visual Basic Report Designer
- Programming with the Report Engine Object Model
- Delivering Reports Using the Report Viewer
- Troubleshooting
Part VII. Customized Report Distribution Using Crystal Enterprise Embedded Edition
Introduction to Crystal Enterprise Embedded Edition
- Introduction to Crystal Enterprise Embedded Edition
- Introduction to Crystal Enterprise Embedded Edition
- Understanding Crystal Enterprise Embedded Edition
- Crystal Enterprise Embedded Edition Samples
- DHTML Report Design Wizard
- Troubleshooting
Crystal Enterprise Viewing Reports
- Crystal Enterprise Viewing Reports
- Viewing Reports over the Web
- Introduction to the Crystal Report Viewers
- Understanding the Report Source
- Implementing the Page Viewer
- Implementing the Part Viewer
- Implementing the Interactive Viewer
- Implementing the Grid Viewer
- Troubleshooting
Crystal Enterprise Embedded Report Modification and Creation
- Introduction
- Deploying RAS Environments
- Loading Report Files
- Locating RAS Components in a Network Architecture
- Installing the RAS SDK
- Best Practices in RAS Exception Handling
- The RAS SDK in Action
Part VIII. Customized Report Distribution Using Crystal Enterprise Professional
Introduction to the Crystal Enterprise Professional Object Model
- Introduction to the Crystal Enterprise Professional Object Model
- Understanding the Crystal Enterprise Object Model
- Establishing a Crystal Enterprise Session
- Querying the Crystal Enterprise Repository
- Viewing Reports
- The Crystal Enterprise Java SDK
- Accessing the Java SDK
- Troubleshooting
Creating Enterprise Reports Applications with Crystal Enterprise Part I
- Creating Enterprise Reports Applications with Crystal Enterprise Part I
- Advanced Scenarios with the Crystal Enterprise Object Model
- Scheduling Reports
- Scheduling to a Destination
- Using Crystal Enterprise Notifications
- Scheduling to a Server Group
- Scheduling to a Specific Format
- Setting Database Credentials
- Troubleshooting
Creating Enterprise Reporting Applications with Crystal Enterprise Part II
- Creating Enterprise Reporting Applications with Crystal Enterprise Part II
- Querying the Crystal Enterprise InfoStore
- Creating and Responding to Crystal Enterprise Alerts
- Creating Schedulable Program Objects
- Troubleshooting
Appendix A. Using Sql Queries In Crystal Reports
Creating Enterprise Reporting Applications with Crystal Enterprise Part II
EAN: 2147483647
Pages: 341
