Logical Database Model Reports
New Report Wizard
This chapter shows you how to prepare reports from logical database models. You can print model diagrams directly, and you can use the New Report Wizard to prepare detailed reports on databases, tables and data types. There are three kinds of reports available for logical models: Statistical Report; Table Report; and Types Report.
The Statistical Report provides a brief summary of overall model. For example, it lists the total number of tables, columns , foreign keys, and indexes. The statistical report is available only from the Database Model Diagram solution . So if you want a statistical report for an ER Source model, you need to first add it to database model project. To do this from the Database Model Diagram solution, choose Database > Project > Add Existing Document from the main menu, and then add the relevant ER source model file into the project. For a detailed discussion of this process, see Section 10.7.
The Table Report provides detailed information about all aspects of your logical model, and is the most useful of the three reports. The Types Report lists details about the logical data types in your model. You can run table and type reports from either the ER Source Model solution or the Database Model Diagram solution.
You can choose the level of detail in each report by selecting from customizable options to create summary reports or reports with comprehensive detail. The dialog boxes in each report use different input but many have a common structure. To avoid repetition, this chapter describes features that are unique to logical model reports. The Object Type report in Chapter 9 gives a detailed explanation of the common dialog box functions.
The procedures in this chapter refer to models that are open in the Database Model Diagram. You must begin by ensuring that your preferred logical model is open and is the active Visio model. If you have several models open , just click on the model you want in order to make it the active model.
To start the New Report Wizard from the Database Model Diagram solution, choose Database > Report from the main menu. The New Report Wizard will open as shown in Figure 15-1. When you are working in the Database Model Diagram solution, the New Report Wizard window shows seven report options in alphabetical order. If you do this from within an ER Source Model, only two options are in the list (Table Report and Types Report).
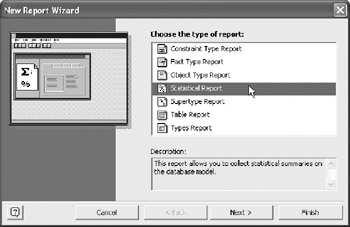
Figure 15-1: New Report Wizard for Database Model Diagrams.
Four of the reports in the list (Constraint, Fact, Object, and Supertype) are the same reports as those described in Chapter 9. If you run the four ORM reports from the Database Model Diagram, you get the same results as when you run them from the ORM Source Model. Please refer to Chapter 9 for a complete description of the four ORM reports.
The next sections show you how to prepare the Statistical Report, the Table Report, and the Types Report from within the Database Model Diagram solution.
Statistical Report
The statistical report summarizes a logical model's content by doing the following things:
- Counting the number and type of constraints, foreign keys, and attributes
- Extracting your model's source file information.
You start the Statistical Report by double clicking on "Statistical Report" in the New Report Wizard list shown in Figure 15-1. Double clicking is much faster than using the "Next" and "Finish" buttons . Even if you get it wrong, it is still faster to double click the report name , realize your error, and double click the correct report title to start again.
If you do single click Statistical Report and then click the Next button, you will see the confirmation panel shown in Figure 15-2. You can check that you have selected the correct report and then click either Back to correct your selection or Finish to confirm and continue.
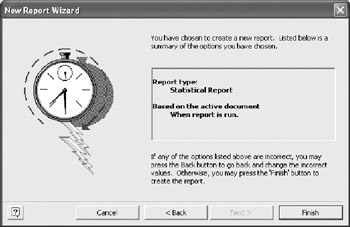
Figure 15-2: New Report Wizard for Logical Models ”Confirmation panel.
Clicking Finish will reveal the Statistical Report dialog box shown in Figure 15-3. The Statistical report Dialog Box has three tabs: Preferences, Headers, and Pagination. Click on the Preferences tab to ensure that your screen looks like Figure 15-3.
Statistical Report Bottom Row Buttons
The four buttons along the bottom of the windows shown in Figure 15-3, Figure 15-4, and Figure 15-5 (Print , Preview, Export to RTF and Close) work in exactly the same way as in all other reports . Please refer to the description of the bottom row buttons in the Object Type report in Chapter 9.
|
Preferences tab |
Headers tab |
Pagination tab |
|---|---|---|
|
You use the Preferences tab to choose your preferred notation by clicking one of the radio buttons labeled Relational and IDEFIX. If you want to report on external tables, make sure that you click on the "Include external tables" check box. |
The headers tab works in the same way as the header tab in the Object Type report. Please refer to the description of the Object Type report in Chapter 9 for a detailed explanation. |
The pagination tab works in the same way as the pagination tab the Object Type report. Please refer to the description of the Object Type report in Chapter 9 for a detailed explanation. |
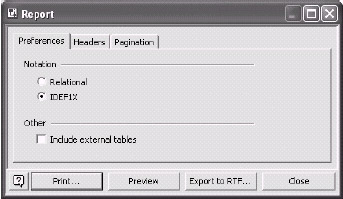
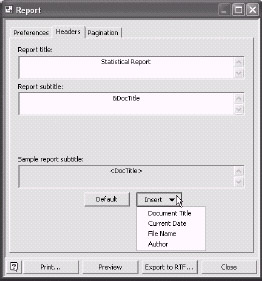
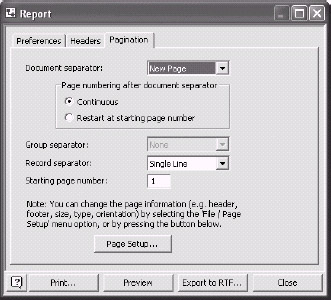
Table Reports
You can start the Table Report by double clicking on "Table Report" in the New Report Wizard list shown in Figure 15-1. Visio will then reveal a tabbed dialog box similar to Figure 15-6. The following paragraphs describe each of the functions in the table report.

Figure 15-6: Table Report Preferences tab.
Table Report Preferences Tab
Click on the Preferences tab to make sure that your screen looks similar to Figure 15-6.
Notation: You must choose one of the Notation radio buttons for your report. Even if you defined your logical model using relational notation, you can still switch to IDEFIX here.
Names : You must choose either conceptual or physical. If you want to review a logical schema, choose conceptual. If you want to review a physical schema, choose physical.
Show Annotations: Check this if you wish to include annotations.
Include External Objects: This checkbox will add objects that your model references but that are defined in a different model.
Predefined logical/physical reports ”Default To: Button. When you open the Preferences tab shown in Figure 15-6, the Default To: button label, will display the name of one of the predefined reports. For example, it may read "Default To: General Report." You can change the default report by clicking the Default To: button and selecting a report from the drop down list.
Figure 15-6 and Figure 15-7, show the states of the Default To button before and after a report selection. The text label on the Default To button in Figure 15-6 reads "Detailed Column Report." After clicking the button to reveal the drop-down list and then clicking "Table Report," the label on the "Default to:" button changes to "Table Report" as shown in Figure 15-7. When you choose a default report, you are choosing a predefined subset of the 61 attributes in the attribute tab (see Table 15-5 through Table 15-9).

Figure 15-7: Default To: button label.
You can use the default reports as they are. Table 15-2 gives a summary of the contents of each of the ten default reports. The numbers in parentheses after each report name in the column headed "Predefined Report name" indicates the number of pages generated from the sample model Patient_LS.vsd. For example: Combined(11) against report number 2, means that eleven pages are generated when you run the Combined report against the sample model Patient_LS.vsd.
|
Report Number |
Predefined Report Name |
What You Get with Each Report |
|---|---|---|
|
1 |
General(8) |
The first section of this report gives a summary of your model. Each of the remaining sections gives a detailed report on each table. |
|
2 |
Combined(11) |
This report combines the database summary report with the table report. |
|
3 |
Database(1) |
Summarizes the model. Notes are generated for each table. The Notes are derived from the primary key notes. |
|
4 |
Table(2) |
Gives a short summary of each table including Notes and Foreign keys. |
|
5 |
Column Summary(1) |
Gives a list of columns grouped by table number. Shows data type, nulls, and value/range. |
|
6 |
Detailed Column(5) |
For each table shows the column name, physical data type, allowable nulls, and Notes. Prints a group header for each table. |
|
7 |
Index Summary(1) |
Lists each index showing its column name and sort order. Groups by table name. |
|
8 |
Detailed Index(4) |
Expands the index details. Groups by table name with each table beginning on a new page. |
|
9 |
Foreign Key Summary(1) |
Shows foreign key with child column name and parent column name. Groups by table name. |
|
10 |
Detailed Foreign Key(4) |
Shows foreign key name, definition, relationship type, cardinality, nullability, verb phrase, inverse verb phrase, and referential integrity on update and referential integrity on delete. Each table grouped to start on a new page. |
You can use the default reports as an initial attribute selection and then change any combination of the checkboxes in the attribute tabs shown in Table 15-5 through Table 15-9. Each default report uses different attributes. Table 15-3 shows you how many attributes each default report uses for input. The numbers above the column names in the five columns on the right indicate the number of attribute checkboxes there are in each table attribute category. The numbers in each report row show how may of the possible attributes are used by each report. For example, the Foreign Key Summary (report 9) uses only two attributes out of a possible 22 table attributes and 61 total database attributes.
|
Report Number |
Predefined Report Name |
9 |
22 |
12 |
5 |
13 |
|---|---|---|---|---|---|---|
|
1 |
General |
9 |
11 |
7 |
3 |
11 |
|
2 |
Combined |
9 |
15 |
10 |
4 |
12 |
|
3 |
Database |
9 |
||||
|
4 |
Table |
11 |
||||
|
5 |
Column Summary |
1 |
||||
|
6 |
Detailed Column |
7 |
||||
|
7 |
Index Summary |
2 |
||||
|
8 |
Detailed Index |
3 |
||||
|
9 |
Foreign Key Summary |
2 |
||||
|
10 |
Detailed Foreign Key |
11 |
Table Report Attributes Tab
You use the attributes tab to set checkboxes for up to 61 attributes. The attributes are classified into five mutually exclusive categories: Database, Table, Column, Index and Foreign Key. You can use the Category: drop down list shown in Figure 15-8, to review the state of each checkbox in each attribute category. You can see the five attribute checkboxes for the index category on the left of Figure 15-8.
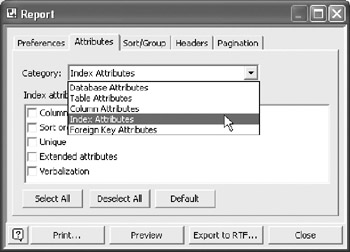
Figure 15-8: Table Report “Attributes tab categories.
You can choose to report some or all of the attributes by selecting each category in turn and selecting or deselecting each attribute checkbox within that category. Table 15-4 shows the scope of each category and the number of attributes it controls.
|
Category |
Category Scope |
Number of Attributes |
|---|---|---|
|
Database |
The physical target RDBMS, for example Microsoft SQL Server) |
9 |
|
Table |
each table in the schema |
22 |
|
Column |
every column in the schema |
12 |
|
Index |
every index in the schema |
5 |
|
Foreign Key |
every relation in the schema |
13 |
| Caution |
Do not hunt and peck among the 61 checkboxes in the five attributes tabs, or you might miss lunch . The number of possible sets of four attributes selected from 61 possible attributes gives you over 5 million options. (Tip: try COMBIN(61,4) in an Excel spreadsheet). |
You will find it best to develop and follow a structured attribute selection procedure. Your first step is to make sure that you understand what each attribute can give to you. You could start by trying the following procedure to help you to understand VEA's awesome reporting power.
- Make sure that you understand the meaning of each attribute (see Table 15-5 through Table 15-9).
- Load the sample model Patient_LS.vsd
- Choose "General Report" from the "Default to" list shown in Figure 15-6
- Open each attribute category in turn and check all the checkboxes. (Tip: Use the Select All buttons).
- Export the twelve-page report as an RTF file.
- Load the RTF file into your word processor.
- Add footers to show at least file name and page number.
- Print the report.
- Take the report and this book to a quiet place.
- Study the report.
- As you study the report, write down every report related question that occurs to you.
- Return to your PC and explore VEA to find the answers to your questions.
Database attributes category
You can use the database attributes tab to select or deselect any of nine attributes shown in Figure 15-9. Table 15-5 shows the meaning of each database attribute.
|
Database Attribute Name |
Attribute Meaning |
|---|---|
|
Target DBMS |
Shows the type of RDBMS driver you have selected, (e.g., Oracle). |
|
Number of tables |
Gives the total number of tables in your model. |
|
Number of columns |
The total number of columns across all tables in your model. |
|
Number of indexes |
The total number of indexes across all columns in your model. |
|
Number of foreign keys |
The total number of foreign keys across columns in your model. |
|
Last build date |
The date of the most recent physical database build. |
|
Extended attributes |
Extended database attributes. |
|
Table stats summary |
Gives each table name with Notes from the primary key plus, for each table, the number of columns, indexes, and foreign keys. |
|
Include view details |
Shows the SQL code used to generate a view that is included in your model. |
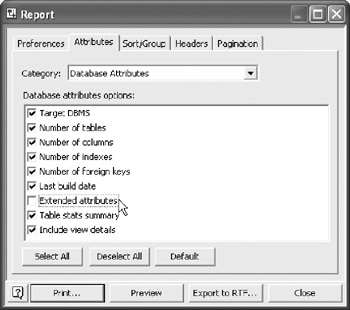
Figure 15-9: Database Attributes.
Table attributes category
You can use the table attributes tab to select or deselect any of the 22 attributes shown in Figure 15-10. Table 15-6 shows the meaning of each table attribute.
|
Table Attribute Name |
Attribute Meaning |
|---|---|
|
Record |
The number of each data record in your report. |
|
Physical name |
The physical name of each table plus table constraints and code. |
|
Conceptual name |
The conceptual name of each table plus table constraints and code. |
|
ID |
The internal Visio number for each table plus constraints and code. |
|
Name space |
The unique name that you have chosen for this table. |
|
External |
Tables that are not external show "No." External tables show "Yes." |
|
Notes |
Shows the Notes associated with the tables' primary key. If the primary key is a composite key then no Notes are shown. |
|
Owner |
Table owner. |
|
Target DB name |
The filename that you have chosen for your target physical database. |
|
Independent |
Tables that do not have foreign keys. |
|
Number of columns |
The total number of columns in a table. |
|
Number of indexes |
The total number of indexes in a table. |
|
Number of foreign keys |
The total number of foreign keys in a table. |
|
Primary key |
Shows the table's primary key. If the primary key is a composite key, all the columns in the composite key are listed. Code is also shown. |
|
Extended attributes |
Extended table attributes. |
|
User defined types |
User defined data types. |
|
Summary of columns |
Shows the following information about each column in each table: |
|
Code details |
Shows the constraint verbalization, type of code, and the SQL code. |
|
Summary of alternate keys |
Shows one line for each alternate key in each table. |
|
Summary of non-unique indexes |
Shows one line for each non-unique key in each table. |
|
Summary of foreign keys (Child) |
Shows: Foreign key name (table pair), child key and parent key. |
|
Summary of foreign keys (Parent) |
Shows Foreign key name (table pair), parent key and child key. |
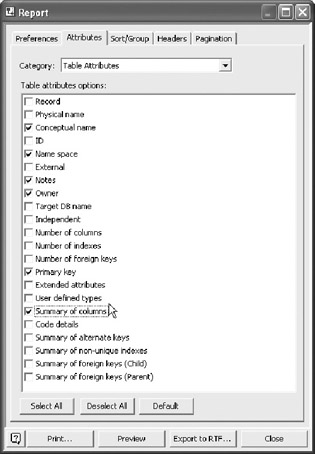
Figure 15-10: Table Report “Attributes tab.
Column attributes category
You can use the column attributes tab to select or deselect any of the twelve attributes shown in Figure 15-11. The meaning of each column attribute is shown in Table 15-7.
|
Column Attribute Name |
Attribute Meaning |
|---|---|
|
Physical name |
Physical column name (to be used in the physical database). |
|
Conceptual name |
Conceptual column name (derived from the domain name). |
|
Physical data type |
Product specific data type (e.g., Oracle). |
|
Portable data type |
One of the 24 built in data types. |
|
Allow NULLs |
Defines the nullability of a column. |
|
Value/Range |
Shows the permissible values that have been set for each column. |
|
External |
Shows if a column that has been defined in a different schema. |
|
Notes |
Shows the Notes for each column. (derived from domain notes) |
|
Foreign key role name |
Shows all columns with annotations (e.g., index or foreign key). |
|
Extended attributes |
Shows all columns plus any extended attributes. |
|
Default value |
Shows all columns with any default values that have been assigned. |
|
Check clause |
Check clause. |
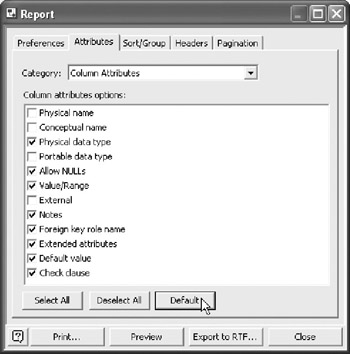
Figure 15-11: Column Attributes.
Index attributes category
You can use the index attributes tab to select or deselect any of the five attributes shown in Figure 15-12. Table 15-8 shows the meaning of each index attribute.
|
Index Attribute Name |
Attribute Meaning |
|---|---|
|
Columns |
Shows all columns plus indexes. |
|
Sort order |
Shows if the index is ascending or descending. |
|
Unique |
Shows all columns, with a summary of the indexes in each table. |
|
Extended attributes |
Extended index attributes. |
|
Verbalization |
Shows all columns, plus an index summary, verbalization and sort direction. |
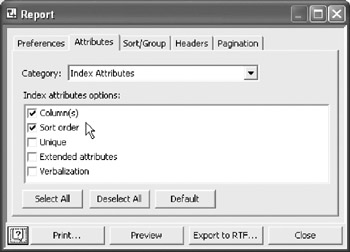
Figure 15-12: Index Attributes.
Foreign key attributes category
You can use the checkboxes in the tab header to choose to include Child foreign keys, Parent foreign keys, or both. If you leave both checkboxes unchecked, your foreign key report will be blank.
You can use the foreign key attributes tab to select or deselect any combination from the thirteen attributes shown in Figure 15-13. Table 15-9 shows the meaning of each foreign key attribute.
|
Foreign Key Attribute |
Attribute Meaning |
|---|---|
|
Definition |
Shows each foreign key name by table, with child column name and parent column name. |
|
Category is complete |
Shows foreign key names by table. |
|
Category discriminator |
Shows foreign key names by table. |
|
Relationship type |
Shows foreign key names by table and whether the foreign key is "identifying" or "non-identifying." (These are IDEF1X terms.) |
|
Cardinality |
Shows the foreign keys by table and the verbalized cardinality. |
|
Allow NULLs |
Shows nullability of each foreign key. |
|
Verb phrase |
Shows the verb phrase that links the parent and child keys. |
|
Inverse phrase |
Shows the inverse verb phrase that links the parent and child keys. |
|
Physical name |
Shows all foreign keys by table with their physical names. |
|
Notes |
Shows notes in the foreign keys' database properties. |
|
Referential on update Integrity |
Shows the action to be taken when the foreign key is updated. |
|
Referential Integrity on delete |
Shows the action to be taken when the foreign key is deleted. |
|
Verbalization |
Gives a full description of all foreign keys. |
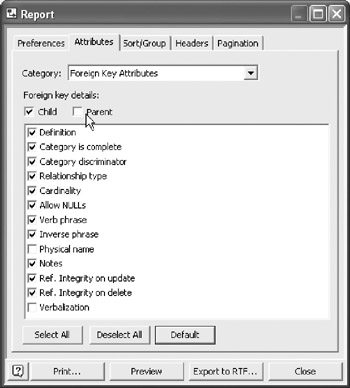
Figure 15-13: Foreign Key Attributes tab.
Table Report Sort Group tab
The Sort/Group tab works in exactly the same way as the Sort/Group tab described in the Object Type report in Chapter 9. You can choose to group your report by one of the three options shown in the drop down menu in Figure 15-14. The default sort key is Physical table name.
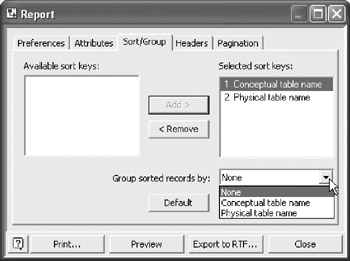
Figure 15-14: Sort/Group.
Physical table names are often short and cryptic. Conceptual names tend to be longer and more descriptive. You can sort by conceptual table name to help you to review database semantics, homonyms, and synonyms. Sorting by physical table name will help you to review your physical naming convention to ensure support for good system performance and ease of use by database performance specialists.
Table Report Header Tab
The header tab works in exactly the same way as the other headers. Please refer to the Object Type report in Chapter 9 for a complete description of the header tab.
Table Report Pagination Tab
The pagination tab works in exactly the same way as the other pagination tabs. Please refer to the Object Type report in Chapter 9 for a complete description of the pagination tab.
Table Report Bottom Row Buttons
The four buttons along the bottom of the window (Print ,Preview, Export to RTF and Close) work in exactly the same way as in all other reports. Please refer to the Object Type report description in Chapter 9 for a detailed explanation of the function of each button.
Data Types Report
You can use the Types report to report on all aspects of the data types in your database model diagram.
Data Types Report Selection Tab
You can choose from three data type categories: composite, user -defined, and built-in, as shown in Figure 15-15. If relevant, you can also include any referenced external types that are defined elsewhere. By default, your report sorts by the class of data type and then by type name . You can easily change this.
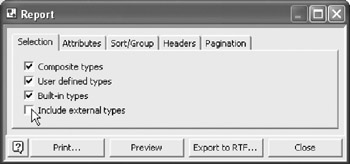
Figure 15-15: Data Types Report “Selection tab.
Table 15-10 summarizes the meaning of these options.
|
Selection |
Meaning |
|---|---|
|
Composite types |
Types with a composite structure. |
|
User defined types |
Shows any user defined data types. With physical data type, Notes, and a summary of any related method. |
|
Built in types |
Predefined data types for the specific DBMS. |
|
Include external types |
External types are data types that you have referenced in your model, but that are defined in a different model. |
Data Types Report Attributes Tab
You can select attribute information, such as data type names , base data types, and derived data types, by using the Attributes tab shown in Figure 15-16.
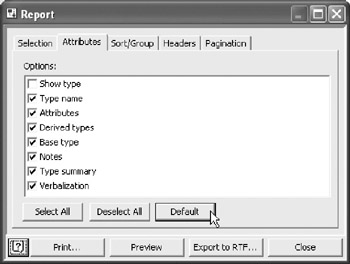
Figure 15-16: Data Types Report “Attributes tab.
Data Types Report Sort Group Tab
The Sort/Group tab works similarly to the Sort/Group tab described in the Object Type report in Chapter 9. Please refer to the detailed description of the Sort/Group tab in the Object Type report in Chapter 9.
Data Types Report Header Tab
The header tab works in exactly the same way as the other headers. Please refer to the detailed description of the header tab in the Object Type report in Chapter 9.
Data Types Report Pagination Tab
The pagination tab works in exactly the same way as the other pagination tabs. Please refer to the detailed description of the pagination tab in the Object Type report in Chapter 9.
Data Types Report Bottom Row Buttons
The four buttons along the bottom of the window (Print , Preview, Export to RTF , and Close) work in exactly the same way as in all other reports . Please refer to the detailed description of the bottom row buttons in the Object Type report in Chapter 9.
|
Attribute |
Meaning |
|---|---|
|
Show type |
Creates a placeholder for each individual data type instance. Not for use on its own. |
|
Type name |
The data types reported here are the DBMS-specific physical data types. |
|
Attributes |
Shows the data type names and their physical types. You must also select at least "Show type" and "Type name" checkboxes to get anything on your report. |
|
Derived types |
Derived types. |
|
Base type |
Base type. |
|
Notes |
Notes for user defined types. |
|
Type summary |
Type summary. |
|
Verbalization |
Verbalization. |
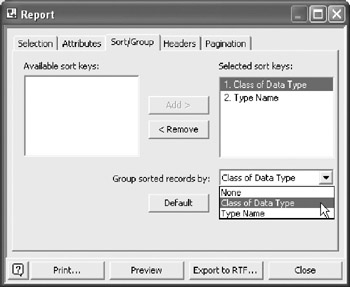
Figure 15-17: Data Types Report “Sort/Group Tab.
|
Sort Key |
Meaning |
|---|---|
|
Class of Data Type |
Sorts your report into the four classes shown on the selection tab in Figure 15-15. |
|
Type Name |
Sorts your report into alphabetical order of data type name. |
|
Sort Key |
Meaning |
|---|---|
|
Class of Data Type |
Groups your data types into the four classes shown in Figure 15-15. (e.g., If you sort by data type name and group by class of data type, your report will have four subsections with data types sorted alphabetically within each subsection). |
|
Type Name |
If you group by this sort key, then you will get one report page for each type of data type in your report. For example, if you select only built in types, you will get at least 24 pages in your report “one page for each of the 24 built in data types. |
Overview of Database Modeling and the Database Modeling Tool
The Conceptual Modeling Solution (ORM)
- Object Types, Predicates, and Basic Constraints
- ORM Constraints
- Configuring, Manipulating, and Reusing ORM Models
- Mapping ORM Models to Logical Database Models
- Reverse Engineering and Importing to ORM
- Conceptual Model Reports
The Logical Modeling Solution (ER and Relational)
- Creating a Basic Logical Database Model
- Generating a Physical Database Schema
- Editing Logical Models”Intermediate Aspects
- Editing Logical Models”Advanced Aspects
- Reverse Engineering Physical Schemas to Logical Models
- Logical Database Model Reports
Managing Database Projects
EAN: 2147483647
Pages: 150
- Chapter III Two Models of Online Patronage: Why Do Consumers Shop on the Internet?
- Chapter IV How Consumers Think About Interactive Aspects of Web Advertising
- Chapter VI Web Site Quality and Usability in E-Commerce
- Chapter XII Web Design and E-Commerce
- Chapter XVI Turning Web Surfers into Loyal Customers: Cognitive Lock-In Through Interface Design and Web Site Usability
