Other Features and Best Practices
This chapter covers several areas of importance, including how to get an ORM project started, model navigation, annotations, backgrounds, the Visio Reader, shape protection, and several other topics. Many of these topics are useful in extending the richness and features that Visio as a platform brings to the modeling team.
Model Reviews and Presentations
Presentations Purpose
Before you start preparing the material for your presentation, take some time to think about the result you want to achieve and how best to achieve it. For example, a management presentation to propose a database modeling project will not be the same as a discussion with a domain expert group to define the facts and entities in their working area. The following paragraphs summarize these two scenarios; a management presentation to get approval for a database modeling project and a typical domain expert fact review that would take place during the project.
Scenario 1 Presenting a Database Modeling Proposal
Suppose that you want to get approval for a database modeling project. How do you go about it? Do you eulogize about the power of database modeling and ORM or should you take a different approach? In this first scenario, you will learn about the fundamentals of getting approval for your database modeling project. You can use this scenario for your own project by changing the content but keeping the structure.
Let's discuss the parameters for your presentation. Plan for 30 minutes. Executives have a short span of attention! Seven slides will allow an average of three minutes per slide, plus ten minutes discussion time. So what can you say about a topic in 3 minutes? If you talk at the rate of one word per second, you get only 180 words of talk time per slide. You should balance this at 90 words for you, and 90 for audience comment. If they don't say anything, remember that finishing early gets a better audience rating! Let's now take a look at what to say on each slide.
Slide 1: State the purpose of the presentation. Say what you want your audience to agree to. Make it short. For Example: "Good afternoon. The purpose of this presentation is to get your approval to assign a budget of $0000 for a database modeling project." You can say that in 15 “20 seconds. Say it, and move on to slide 2.
Slide 2: State the consequences of the problem. For example: "One of our customers has been awarded $0000 damages because of a failure in one of our products. The cause of the failure has been traced to a conflict in our product specifications. There are hidden inconsistencies in the data structure of the software that we developed to run in our products." Now if your company sells electronic tin openers and a customer won a small personal injury claim, then the budget for which you plan to ask may be small. On the other hand, if you are NASA and you just lost a $125 million spacecraft near Mars then your project will be a bit bigger. (A true story: Mars Climate Orbiter loss: http://mars.jpl.nasa.gov/msp98/orbiter/) [Figure 17-1].
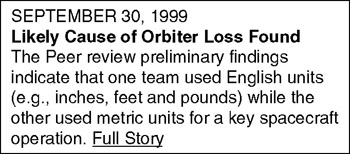
Figure 17-1: Mars Climate Orbiter Report.
It might take you 30 “40 seconds to say what you have to say on Slide 2. Say it and move immediately to slide 3.
By now you should have the undivided attention of your audience, and you are only one minute into your show! If you don't have audience focus by now, you are on the way to losing it. However, let's assume that the assembled company is now hanging on your every word and asking themselves three questions 1: "How come?" 2: "Who screwed up?" and 3: "Can they pin this thing on me?" Some people might verbalize the first two questions. Not many people will admit that they are also asking themselves the third question. If anybody goes for their cell phone at this point, you know why they're calling.
Slide 3: State the root cause of the problem. Slide 3 should summarize the answer to question 1: "How come?" You can safely ignore the other two questions because they will probably already be in the hands of Legal and Human Resources. If the person on the cell phone suddenly leaves the room, you know that they are not interested in the rest of your presentation because she now has other problems to solve.
It might take you two or three minutes to summarize the answer to "How Come?" because you have to explain the organizational procedures that caused The Problem without laying the blame on any individual or group of individuals. Such problems are usually systemic rather than personal anyway so keep well away from the witch hunt mentality . Focus on the procedures that caused The Problem because your project is going to propose new procedures to replace the procedures that caused The Problem.
Slide 4. Now that the remaining audience has a good grasp of The Problem and its root cause, they should be thinking "Oh My! What can we do about The Problem?" You answer that question with Slide 4 by reviewing the cause of The Problem and introducing The Solution which is of course your project proposal. You have to explain the difference between the way things are done today and they way you are proposing they should be done. This will probably also take up the next slide as well.
Slide 5. This should summarize The Solution, which is your database modeling project. You should end by explaining why things will be much better (The Benefits.) when The Solution is implemented.
Slide 6. Use this slide to summarize the differences between your project proposal and that way things are done today. Cite examples of other projects that have succeeded by using your new method. You should aim to help your audience to see that your approach is more effective than the approach that caused The Problem you described in Slide 2. It will help to have a hyperlink in Slide 6 that lets you jump back to slide 2.
Be prepared with lots of evidence. Slide 6 is where you will need to use the power of hyperlinks , OLE, Visio layers , and all the other technical wizardries explained elsewhere in this chapter. You need to be able drill down directly from each point in Slide 6 to the detailed information that supports each of your points. You can use a hyperlink to jump to a layered Visio drawing. You can use OLE and a wheel mouse to rescale each drawing by a factor of fifty or more. This helps you to quickly zoom in and out of the detail.
Slide 6 should of course include a hyperlink to a Gantt chart showing all the details of your Project Plan. Your audience will not want to see the details of your plan; they will just want to know that you have done your homework. This is where you slow down a little for questions. If you have prepared well, you will probably be about 15 minutes into your show. However, you are going to need the extra time to answer the questions from finance that you will get when you reveal slide 7.
Slide 7. This is where you go for gold. Slide 7 should contain the question that you want the audience to answer. "Request for authorization of a database modeling project budget of $0000." In Slide 7, you should summarize the benefits of approving your project, the budget, state a delivery timescale , and ask for the money. If you have done a good job, your budget will be approved, but not before you have run the gauntlet of the obligatory grilling by finance! At this point you should be prepared for zillions of detailed questions from finance as they contemplate the consequences of restructuring the corporate budget for the 99 th time since the CEO approved the annual budget just a few weeks ago. As long as Slide 7 has hyperlinks to a sophisticated multidimensional spreadsheet that has all the financial answers, you will be OK.
If you are now thinking "That was a fine explanation of a project proposal but does not have much to do with database modeling." just keep on repeating the phrase, "No Bucks; No Buck Rogers!" To be an effective database modeler, it makes sense to know how to defend your project which means knowing how to defend your budget. Remember, you may not be aware that you are competing for funds with someone like a tough production director who wants a new robot for the production line and can prove the efficiency gains ”in budget terms of course.
Scenario 2 Reviewing the Facts!
OK! So you are now a database modeling project manager with a big budget and nobody but you to move things forward! Step 1 is to use some of your budget to hire an assistant to recruit your project team and to send them on courses such as Microsoft's new ORM based SQL Server database modeling course number 2090A.
See http://www.microsoft.com/TRAINCERT/SYLLABI/2090afinal.ASP
Step 2 is to get the project moving right along by getting the facts from domain experts. You can use scenario 2 as a template for this task.
Getting agreement between domain experts.
You may have to begin by persuading departmental managers to release high value individuals to attend your fact finding workshop. (Or, even to persuade the managers to attend themselves. Gasp!) If you need to justify the attendance of the people you want, then adapt the approach outlined in scenario 1. Tip: You will find it helpful to have a "Scenario 1" presentation tucked away in your laptop ready for instant deployment. You never know when it might be needed! Let's assume that you managed to convene a fact finding meeting. What's the best way to run it?
Slide 1: Introduction: The three questions. Thank everyone for attending and invite each person to make a self-introduction. Give your audience a few moments to prepare by giving each person a card with the three questions you want them to answer: "What is my name ?", "Which department am I from?", and "What do I hope to achieve by attending this meeting?". You will find this to be a very effective ice breaker “ even if the people already know each other.
Slide 2:The group assignment. Use this slide to state the business problem, for example: "We just lost a $125 million spacecraft due to inconsistencies in facts and data definitions. We are here to help to ensure that such an event is not repeated."
Slide 3: Get the facts. Facilitate a discussion on how things are done today. Start by explaining what a "fact" is and how you go about defining one (see Chapters 4 and 5). Hand out a worked example on a single sheet of paper and walk everyone through the process of defining a fact. Make sure that you emphasize the importance of fact examples and object definitions. Use a second sheet of paper to explain a few simple constraints. It might take an hour or more before everyone "Gets it."
Next, organize your audience into teams of two. Then hand out five sheets of paper that look like the example you just used, but that have blanks to be filled in. Tell your audience that the next break will come after they have collectively agreed on five fact types. As each fact type is agreed, add it to your model. It helps to have your laptop hooked up to a large screen projector so that every member of the audience can clearly see you add the new fact type and can give their agreement before you store the latest version of the model with a new name. Repeat this fact finding procedure for the rest of the meeting. Have a 10 minute break every hour so that you can organize the fact types into pages. When you reconvene, begin by presenting a summary of the model as it now is.
You can adapt this approach to review existing facts. To review facts, prepare reports before the meeting (see Chapters 9 and 15) and hand the reports out as the basis for discussion. Invite the members of your audience to explain how their part of the organization uses and maintains the facts. Use questions to draw attention to potential inconsistencies. For example: your financial department may have lots of information about "accounts" that refers to bank accounts. However, the sales manager, whilst still concerned about bank accounts (his own for instance) may be more accustomed to using the word "Account" to mean a customer as used in "Account manager." As the facilitator, you can choose to referee a long battle for ownership of the word "Account" or you can use ORM domains to establish two separate ORM object types such as "CustomerAccount" and "BankAccount" and get agreement on that.
If you are unable to reach agreement and both parties want to continue to use an identical term to mean different things (the homonym problem) then write some text in the Database Properties Notes field to describe the situation and the action that has been taken. Then use the Database Properties "Name Space" function to give a unique system identity to each of the two usages.
Review one fact at a time and continue until you get agreement on the definition of all the facts. Take a 5 minute break every hour. Continue until each member of your audience has agreed on the definitions that should be written into the Database Properties "Notes." field. If you have a large audience it may take 5 minutes, 15 minutes or even more to get agreement on each fact, so try to limit fact finding reviews to a maximum of ten people.
The duration of the review will depend on the number of people in your audience, your skills as a facilitator, the effectiveness of your preparation, and the number of facts you want to review. You can use a ballpark estimate of 40 fact types a day for a fact review but set a lower target for fact discovery meetings. For example, it might take you two or more days to review a 5NF database model with 100 tables. Remember to select the audience so that you have those who understand the facts and those who can approve any changes to the facts. They may not always be the same people!
Support each fact review with printed reports from VEA (see Chapters 9 and 15). This will allow the members of your meeting to make notes and to think. When each fact is agreed, update your model immediately. At the end of the meeting, print a copy of the updated reports and store your updated model in a tool such as Visual SourceSafe. If there are business consequences, such as a change to corporate policy, sales documentation or application software updates then be aware that the change may commit your organization to significant expenditure in order to harmonize terms between departments and to implement the changes into existing computer applications. It's a good idea to get ready for the next finance grilling by updating your Scenario 1 support material.
For each fact review, you will need relevant database model diagrams and verbalized reports. You might consider making a standard "one fact" PowerPoint presentation that you can reuse for each fact by hyperlinking the appropriate diagrams into each slide. If you have a large screen projector then you can use OLE and a wheel mouse to click on a Visio database model object in your PowerPoint slide and drill down to the detail. Adding hyperlinks and layers to structure your material will help to reduce the time it takes to discuss each fact.
Presentations Designing Your Material
What's in a page?
First, you have to rethink what you mean by a "page." With paper documents, you have no alternative but to use separate physical pages. With Visio, you have much more flexibility. The main question is not about "pages" but about what you want to say and how best to say it.
The diagrams for a model may be spread over several Visio pages. Think of a page as a placeholder for a concept you want to explain or a point you want to make. So the way you decide what to put on a page is by thinking about your audience and what you want to say to them. If you are short of ideas, try starting with the AutoContent Wizard in Microsoft PowerPoint as shown in Figure 17-2.
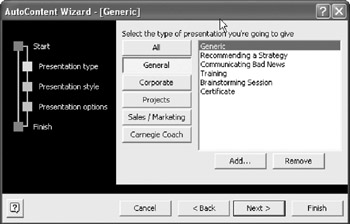
Figure 17-2: Microsoft PowerPoint AutoContent Wizard.
When you have chosen the main headings and sequence for your presentation you can begin to develop and organize your Visio database model material.
You should use each theme in your PowerPoint slides as a focal point for the hyperlinks to your layered Visio database model diagrams. Designing the PowerPoint show first will provide the context you need to decide how to layer your supporting database model diagrams.
Whether you use PowerPoint or not, you still have to structure your Database Models using Visio pages. You may have already done this as part of your database model development process. Pagination is explained in Chapter 3 and in Visio Help.
Layers
You can use layers to create a deep structure through which you can navigate during a presentation. You can hide such things as annotations you created by adding shapes from other stencils. You can easily set up layers, assign shapes to each layer and then show or hide the layers as required. Use Visio Help and some experimentation to develop your skills in using layers for database modeling. Layers give you a way of structuring your database models to meet your presentation needs. If you put too many shapes on a page, the drawing becomes harder to understand.
You can use Visio layers to create a deep structure in your database model. You can hide things such as annotations until you need them. You can assign database model components to each layer and then show or hide the layer to fit in with your PowerPoint show.
To set up a layers. Layers are defined in the Layers Properties Window which is found in the main menu ( View > Layer Properties ). See Figure 17-3. Remember this location, as this is where you also select which layers to make visible. To create a new layer, select New and enter a layer name (see Figure 17-4).
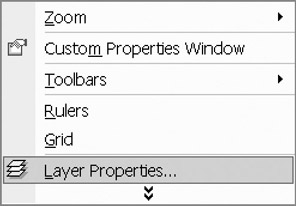
Figure 17-3: Main Menu ”View ”Layer Properties.
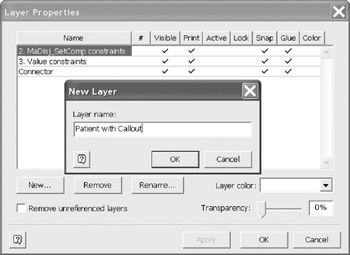
Figure 17-4: Creating a New Layer.
You can add as many new layers as you need to support your presentation strategy. This example shows four layers:
Layer example. This example uses the first page of the Patient conceptual model and the four layers defined above. To create the Patient All Layer:
- Select all shapes for this layer.
- Right-Click any object, then choose Format > Layer from the context menu.
- Select the Patient All layer (see Figure 17-6).
- Select "OK".
|
Layer |
Layer Scope |
Things to include |
|---|---|---|
|
1 |
Patient All |
All shapes on the page. |
|
2 |
Patient Only |
Patient object and the callout. |
|
3 |
Patient Related Objects |
Patient Only and All objects on the page “ no roles. |
|
4 |
Patient Object Roles |
Patient Only. |
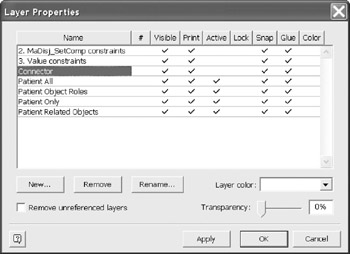
Figure 17-5: All defined layers for the Patient Conceptual Model.
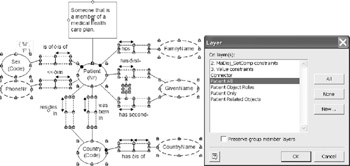
Figure 17-6: Creating the Patient All Layer.
This sequence is repeated for each layer, only the selection of objects and the assigned layer change.
To create the Patient Only layer, select the Patient, Callout, and the connection line shapes. Take care when selecting shapes because there are more individual shapes on the page than you may realize. Assign all four layers to these shapes. This is the smallest layer (view), however, these shapes are also part of each higher level in the structure.
To create the Patient Related Objects layer, select all the ORM object shapes then assign these objects to all except the Patient Only layer. The lower level is not assigned, however, this layer and all higher levels are assigned.
To assign shapes to the Patient Object Role layer, select the fact types of interest for this layer, select all the role boxes, connection lines and the external constraint, and then assign this to the Patient Object Role level and Patient All Layer.
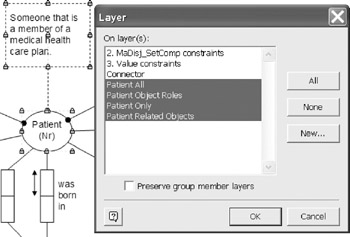
Figure 17-7: Assign shapes instances to the Patient Only Layer.
Viewing by layer example. Once the layers are defined and the shapes are assigned to the layer, you can view the drawing layer by layer. The easiest way to select the view is to right-click on the drawing and choose View > Layers . The Layer Properties window opens for you to select the layer you want to view. To display a layer, check the layer. To hide a layer, uncheck the layer. In Figure 17-10, the Patient Only is the only layer that is visible. Click on Apply to see the effect while leaving the Layer Properties window open .
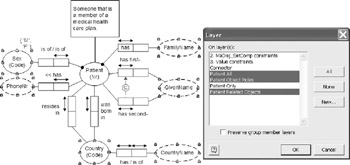
Figure 17-8: Assign shapes to the Patient Related Objects Layer.
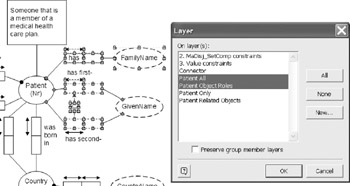
Figure 17-9: Assign shapes to the Patient Object Role Layer.
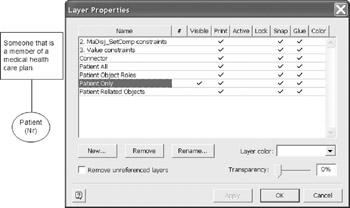
Figure 17-10: Patient Only Layer.
Now make the Patient Related Object visible as well (Figure 17-11). Select Apply again.
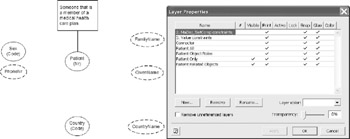
Figure 17-11: Patient Related Objects Layer.
Now make the Patient Object Role visible as well (Figure 17-12). Select Apply again.
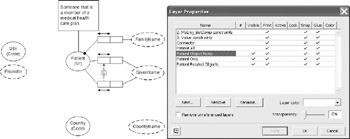
Figure 17-12: Patient Object Role Layer.
To view all you have two choices. You can select the Patient All layer and then click on Apply, or you can uncheck all except for Patient All and then Apply. See Figure 17-13.
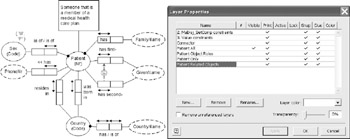
Figure 17-13: Patient All Layer.
You need to think carefully about your layering strategy before you assign shapes to a layer. You can use a hierarchical structure, as in this example, or you can make a flat, subject area structure. Layers are a general Visio feature and are not unique to database models. You can also use these techniques to structure a Logical Model. This may help with IDEF0 diagrams.
You should design a stable layer structure before you add shapes to the layers. If you don't do this then you may spend a lot of time editing layers rather than assigning shapes. You can use colors in each layer but make sure that you use color wheel principles mentioned elsewhere in this chapter.
Using Visio custom properties
Many Visio drawing elements have pre-defined custom properties, and you can also create new custom properties. The ORM and Entity Relationship stencil shapes typically do not have predefined custom properties.
To create a custom property, you right click the shape and select Shape ’ Custom Properties. You will see the message "No custom properties exist, would you like to create customer properties now?" Select "Yes."
The example shown in Figure 17-14 adds a custom property to help you to make a note of when this entity was approved by the review team. To create several properties select "New" and enter the information for the other properties one by one.
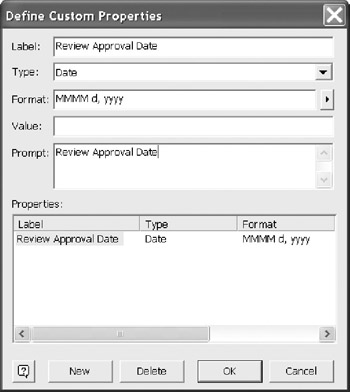
Figure 17-14: Creating a custom property.
Select "OK" when you are done creating custom properties. Going back to the shape on the drawing, right click on the shape, then select custom properties. Now a custom properties window appears and you can enter data into the new property as shown in Figure 17-15. For example, you can enter the approval date from your fact review as explained in Scenario 1 above. The "Define" option opens the custom property definition.
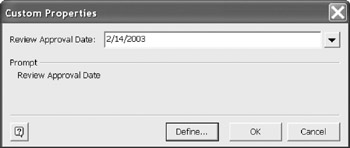
Figure 17-15: Viewing custom properties.
Adding hyperlinks
You can hyperlink to other pages in the same drawing, other pages in a different drawing, to other file types, and directly to objects on the web. Our example link is an internet address http://www.orm.net.
To set up a hyperlink, first select the shape to host the hyperlink then from the main menu choose View > Hyperlinks to open the hyperlink dialog box shown in Figure 17-16. You can use Address Browse to browse your computer, a computer on the network or the internet. Sub-Address browse is constrained by the Address Browse and displays the parts of the address to which you can make a direct link. For example, the subaddress can be a page in a Visio drawing, a tagged paragraph in MS Word or one of many other possibilities. If there is no sub-address then there are no linkable components in your target document. You can use any shape as the source for a hyperlink, however, you can only sub link if your target object supports sub linking.
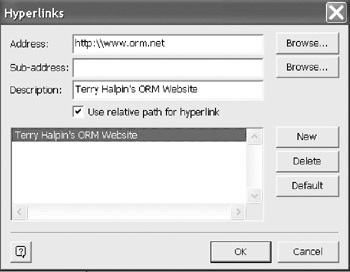
Figure 17-16: Hyperlink Definition Window.
To hyperlink to another page within the same drawing you only need to enter a page name in the Sub-address. The Address is not required.
To hyperlink to another Visio drawing, enter the file path/name in the Address and the specific page name, if desired, in the Sub-address. The file path /name can be to your machine or to any networked computer to which you have access permission.
Sub-addressing capability depends on what the target file type supports. You may be limited to a link to the beginning of the file. For example, when linking to MS Word, you can link to the file. You may or may not be able to link to a specific location in the file. Selecting Sub-address returns known link targets within the file. You can link to a specific spot if the author provided tags which support linking.
To link to an internet address, browse until you locate the target address. Then copy the address using Ctrl+C, and paste it into the hyperlink address using Ctrl+V.
You can hyperlink to other pages in the same drawing, to a page in another drawing or to most other documents on the web.
Annotating Visio diagrams with shapes
You can enhance your database diagrams with illustrative graphics by using Visio's other stencils. To add additional stencils choose File > Stencil and select your stencil from the menu. For example the Annotation Stencil is located at File > Stencils > Visio Extras > Annotations . When selected, the new stencil will appear in the open stencil list. To use an individual stencil, click on its header to make it the active stencil. You may find it best to choose your stencils after you have made your list of presentation objectives and you know exactly what you want to say. On the other hand, browsing stencils can sometimes help you to clarify your ideas about what you want to say.
In Figure 17-17(a) the block shapes stencil was used to note that these two tables are sourced from the marketing division. In Figure 17-17(b) an icon from the callout stencil was used to note why there is a hardware table. In Figure 17-17(c) the category note is from the annotations stencil and explains how Item is typed as a Hardware Item.
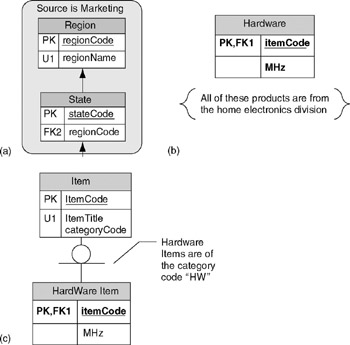
Figure 17-17: Annotation Examples.
You can add UML shapes from the UML stencil, but you cannot modify them directly. If you want to embellish a UML shape, use a shape from the block diagram stencil.
Using other Visio stencils
Visio has many stencils. To use another stencil, choose File > Stencils from the main menu and browse until you find the stencil you want. The stencil is added to your open stencil stack, which is usually located on the left side of the drawing, as shown in Figure 17-18. Click on a stencil header to see and use shapes from the stencil.
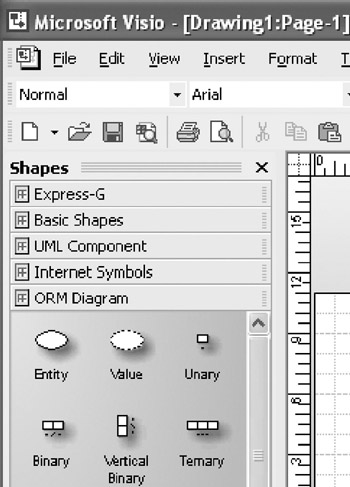
Figure 17-18: Visio Stencil Stack.
Some stencils have intelligent shape behavior. These shapes have shape behavior. These shapes have associated behavioral code. When using these shapes in a drawing that is not of that specific type, you can use the image of the shape, but no intelligent behavior is possible in your drawing. It is merely an image. UML and Network shapes with embedded intelligence will provide a shape, but not the associated behaviors that work in their own category. The ORM Diagram has ORM shapes but no modeling functions. The Express-G template has shapes for the Express-G notation (ER) but no modeling functions.
Some ORM constraints are not visible on the drawing surface. They are present in the constraints for the object, but no image is shown on the page. You can simulate the constraint on the page by using the appropriate shape from an ORM diagram stencil. The Express-G template contains shapes for drawing ER diagrams in the Express-G notation but does not have any intelligent shapes. Express-G is the graphical component of the Express formal information requirements specification language as described in ISO standard 10303-11. Express and Express-G are components of STEP (Standard for the Exchange of Product Model Data), an international standard for the computer-interpretable representation and exchange of product data.
Foreground and background
By default, all Visio pages are foreground pages. If you want to create a background to put a background feature on every foreground page you must begin by creating foreground page that contains all the background shapes that you want to use. A divisional logo is placed on the upper left of a foreground page (Figure 17-19).

Figure 17-19: Logo in the upper left corner of page.
When you are done adding shapes, choose File > Page Setup > Page Properties and set the page as a background. Enter a name for your new background page and click OK.
To apply the background page go to the page and again return to File > Page Setup > Page Properties and assign the background page, in Figure 17-20 the background page name is set to "Background." Click OK to finish.
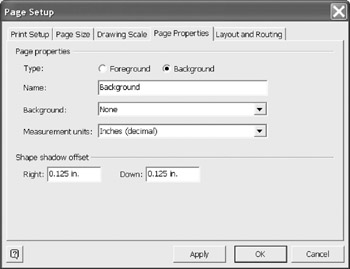
Figure 17-20: Setting the page as background.
You must apply a background to each foreground page on a page by page basis (Figure 17-21). You can add many shapes and properties to a background page, for example, a fill color, images, and text. The shapes on the background page will appear on each foreground page in the same spatial position as they appear on the background page. Take care to ensure that you place the background shapes where they will not interfere with the shapes on any of your foreground pages. If you are making a lot of pages, you will find it helpful to set structural standards for all foreground pages. For example, if you always want a background logo with some text along the top of each foreground page, then design all foreground pages to start below your own "upper margin" line.
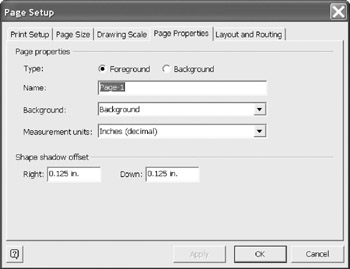
Figure 17-21: Assign the background to the foreground page.
Using color
Color helps to differentiate objects on the drawing surface. You can color any Visio shape in any of your database diagrams by right clicking the shape and choosing Format from the menu. Color can add structure or create chaos. Color selection is a complex process, and you should apply color wheel principles to get the right effect. You can find a color wheel explanation at http://hort.ifas.ufl.edu/TEACH/floral/color.htm.
The color wheel has three categories: primary, secondary, and tertiary. The three primary colors are red, yellow, and blue. These colors are used to create all other colors. When you combine two primary colors, three secondary colors are formed . You can make one of the six tertiary colors by combining a primary and an adjacent secondary color. Different colors are different wavelengths of light. A " clash " between two colors happens when the two light waves combine to overload the optical system of your eye. If you want to make extensive use of colors in your diagrams, it will help if you thoroughly understand the color wheel principles and then choose colors to clarify your messages.
Presentations Delivering your Presentation
Coping with audience attitudes. Some people prefer to look at drawings; others are more comfortable with words. You have to be prepared for both.
Those who like drawings. You can use drawings for review after some short training of the review team. Usually this is a train-as-you-go plan. In our experience, this has never caused and delays or issues with reviews. Actually, the reviewers usually prefer the diagrams once they realize they are diagrams of the sentences. The diagrams with an active verbalized window create a fast way to see both. Using a projector also keeps everyone on the same page. It is also possible to make changes while in the review, assuring everyone that the change is in place. The lack of paper copies reduces preparation time.
Those who like words. You can use words for those sessions where the reviewers are unfamiliar with the diagram notations or have a strong leaning for text. These reviews do tend to go slower. Creating an electronic version of the reports is one way to keep everyone on the same page during the review. Again, projecting this helps. This also limits dynamic changes as when using actual models. To use words, use the verbalizer or one of the report options discussed in Chapters 9 and 15.
Preparing both drawings and words. Use the verbalization function to discuss entities, facts and constraints. Use ORM or ER diagrams to give the big picture. Diagrams help everyone to get the big picture and Visio is an excellent tool to help you to design and to deliver your material. Since the ORM drawing is one model and the logical model is separate, you can open both models and toggle between them. Making changes to the ORM model can be reflected in the logical model with a simple rebuild. This often can be done very quickly, satisfying people who prefer one drawing notation over the other.
During the show. During a presentation, you might want to answer a question with an example that you did not prepare in advance. If you want to answer questions on the fly, then you can create a page dynamically by opening a new page, place a single fact type or object type on the ORM drawing and then right-click on one of the objects and select Show Relationships. You can keep adding information to the page as you continue to review.
Librarianship
Storing Where to Store and How to Protect
Passwords. You can protect your database models with passwords. To protect a file, choose View > Drawing Explorer Window . Then right-click the filename of the drawing you want to protect, and choose Protect Document from the context menu. This opens the Protect Document Dialog. Check the items that you want to protect.
If you want to restrict access, type a password. The password is not visible after you close the dialog box, so make a note of it, or it's Oops! Time again.
Lock shapes against deletion. Locking aspects of drawing shapes can prevent accidents, and control resizing or the movement of shapes. This feature cannot present some that has file update permissions from unlocking some aspect of the drawing, but it does help to manage these aspects.
Select the shape or shapes that you want to protect.
On the Format menu, click Protection.
Indicate what you wish to protect. In Figure 17-22 the shapes are protected against deletion. No modeler or reviewer can accidentally delete the region fact type without first removing the protection. To remove the protection, simply return to this window and remove the protection.
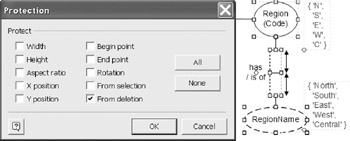
Figure 17-22: Setting Shape Protection.
Select "OK."
Any attempt to delete the "Region Name " object type results in the warning message shown in Figure 17-23.

Figure 17-23: Visio Warning “ stops user from violating a protection.
Visio File Types
In various places in Visio, you will see one or more of the six file types shown in Table 17-2 but you can's use them all directly from within the VEA database solution.
|
Drawing Type |
Screen and Printer |
For Use with XML |
|---|---|---|
|
Drawing |
vsd |
vsx |
|
Stencil |
vss |
vdx |
|
Template |
vst |
vtx |
Naming Conventions
You should establish naming conventions for files, objects, columns , tables, and just about any other group of things to which you want to refer. File naming is important because Visio saves all database drawings using file type .vsd and you will want to clearly separate your ORM Source Model files from your Logical Model files. For example, suppose you create an ORM Source Model and save it as "Test." Then you build a logical model and save the logical model as "Test". Oops! You just lost your ORM Source Model.
Naming conventions can be complex. The point to bear in mind is that you should use one! To get started, you can use a simple method such at the one used in this book's examples. We have named each model with a suffix to indicate the model type. For example, "Patient_CS" means Patient Conceptual Schema, and "Patient_LS" means Patient Logical Schema. You can find lots of advice about naming convention principles and practices in many places on the web.
Version Control
Database models are valuable documents, so you should set up your own version control system. If you use a tool such as Microsoft Visual SourceSafe, then you can manage versions a file-at-a-time. Visio has the standard Undo/Redo commands, but if you are designing many database models you will need more than this simple feature. You can find out more about Visual SourceSafe at http://msdn.microsoft.com/ssafe/. The Visual SourceSafe home page is shown in Figure 17-24.
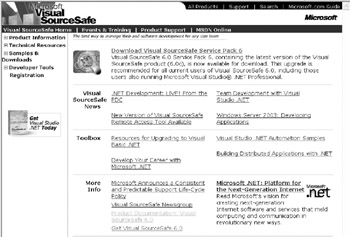
Figure 17-24: Visual SourceSafe.
Model Browsing
Large pages or models that involve many pages are navigated by selecting a fact type or object type in an ORM model, or a table in a logical data model. To find a fact type in an ORM drawing, select the Fact Types tab of the Business Rules window, right-click the fact type, and select Find Fact in Drawing from the context menu (Figure 17-25). This positions you at the first entered instance of the fact type. This will not position you at any duplicate instances of the fact type. This means if you are on a page that has a duplicate instance of the fact type on the drawing, it will take you the pages where the first instance was created, even though an instance is visible right in front of you.
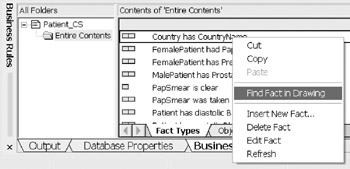
Figure 17-25: Find a fact type in the drawing.
This next example illustrates the same concept using an object type. Right-click an object type in the Object Types pane of the Business Rules window, and then choose Find Object Type in Drawing from the context menu (Figure 17-26).
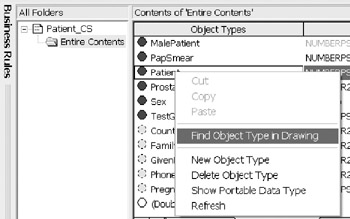
Figure 17-26: Find an object type in the drawing.
To locate a table in logical model drawing, open the Tables and Views window by choosing Database > View > Tables and Views from the main menu (Figure 17-27). Then double-click on the table or view name to locate the first instance.
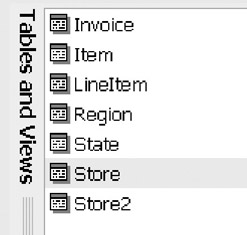
Figure 17-27: Find a table in the drawing.
VisioModeler 3 1
The VisioModeler version of the ORM tool is a free, unsupported product from Microsoft. Some modelers are still using this version, while others use it as way to investigate the features of ORM. It can be down loaded from http://www.microsoft.com/downloads/release.asp?ReleaseID=27489.
XML
You can extract ORM and Logical Model information as XML. To make an XML extract, you can use a free third-party add-in called Orthogonal toolbox. This is downloadable from the toolbox area at http://www.OrthogonalSoftware.com. This add-in extracts all the information exposed by the COM API for the VEA's database modeling engine.
This COM API is currently unsupported by Microsoft, and has a few limitations, but is still quite useful. The installation of Orthogonal Toolbox is very simple and adds a main menu item to your Visio application.
Distributing your Database Models
Web Pages
You can save your database models as web pages by opening a database model and choosing File > Save as Web Page . You will then see a standard folder save window. The name of your file will appear in the file name box with the extension ".htm". To save the file, click on Save.
You can publish ORM Source Model files, ER Source Model files and Database Model Diagram files as web pages. To publish a model diagram, click on the "Publish" button and you will see the Save as Web Page Dialog shown in Figure 17-28. Use this tabbed dialog box to format your database model for viewing as a web page.
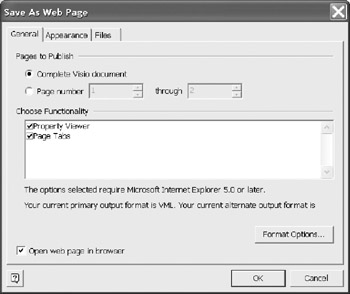
Figure 17-28: Save as Web Page.
Visio Reader
You can use the Visio Reader to share database models over the internet. Since the Visio Reader is a free and self-installing download, you don't have to worry about buying, installing, and managing a Visual Studio. Net license for everyone who wants to see your database models.
| Caution |
Don't install the Visio Reader on a machine that already has Visio installed because the reader then becomes the default program for viewing Visio files. |
You can download and install the Visio reader from the following web address. http://office.microsoft.com/downloads/2002/vviewer.aspx. To add Visio Reader to your installed version of Internet Explorer, just follow the installation instructions. Note that you need Internet Explorer Version 5 or later.
You can use Visio Reader to open and browse Visio files (VSD or VDX). When you use the Visio Reader you will see the toolbar shown in Figure 17-29.
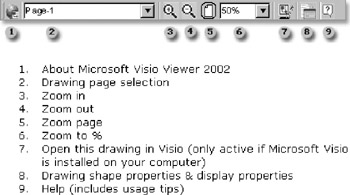
Figure 17-29: Visio Reader toolbar.
When you use the Visio Reader to view your database models over the internet, all the hyperlinks in your model documents remain active, so you can quickly create a powerful communications facility. However, if you don't use an effective naming convention or layers , you will end up with a chaotic jumble of files. Remember the PAP 4 principle: Preparation And Planning Prevent Pathetic Performance!
Reporting
As discussed in Chapters 9 and 15, there are several reports from an ORM or logical model that are useful for reviews. These reports are saved as Rich Text Files. Rich Text files can then be saved as web pages making the distribution of matching Visio drawings and reports possible.
Reports are accessible from the Database menu option Reports. In our simple example, a fact type report is selected from the Patient conceptual model using only the default options. Keep in mind that these reports also contain any examples and notes provided by the modeling team. So are excellent for reviews. As a matter of good practice, complete reports are the fastest way to get user confirmation of the model. The model is also a specification, so keep the specification up-to-date, and keep it as rich as possible with content.
You can filter the report to get a meaningful sub-report for a specific review (see Figure 17-31). Determine the information (attributes) that will be displayed, then sort and control the presentation issues, headers, and pagination.
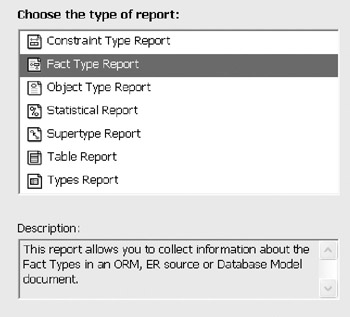
Figure 17-30: Selecting a Fact Type Report.
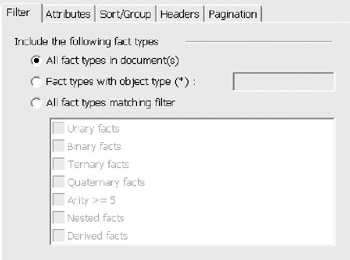
Figure 17-31: All fact types are selected by default.
This example reports information about each fact type in the model. By default, simple diagrams of the fact types are also presented, as shown in Figure 17-32. Only internal uniqueness and simple mandatory constraints can be displayed on these simple diagrams. However, all constraints are verbalized. In this example, the frequency constraint that each test group includes at least five patients is verbalized, even though it does not appear on the report diagram. Although not displayed diagrammatically in the report, this constraint is displayed as ">=5" on the TestGroup role in the actual ORM diagram for the model.

Figure 17-32: Sample of a default Fact Type Report.
In this example, the frequency constraint verbalization, though unambiguous, is a little awkward . Its meaning can be clarified by including examples to back it up, and by including a better verbalization as a note (e.g., "Each test group includes at least five patients"). This makes it easier for the domain expert to check whether the constraint is correct. For instance, maybe the frequency constraint should actually be: Each test group includes at most five patients (<=5). In general however, the automatic verbalization provided by the tool is easy to understand, and reports of this type provide a very useful means of validating business rules with the domain experts
Overview of Database Modeling and the Database Modeling Tool
The Conceptual Modeling Solution (ORM)
- Object Types, Predicates, and Basic Constraints
- ORM Constraints
- Configuring, Manipulating, and Reusing ORM Models
- Mapping ORM Models to Logical Database Models
- Reverse Engineering and Importing to ORM
- Conceptual Model Reports
The Logical Modeling Solution (ER and Relational)
- Creating a Basic Logical Database Model
- Generating a Physical Database Schema
- Editing Logical Models”Intermediate Aspects
- Editing Logical Models”Advanced Aspects
- Reverse Engineering Physical Schemas to Logical Models
- Logical Database Model Reports
Managing Database Projects
EAN: 2147483647
Pages: 150
- Challenging the Unpredictable: Changeable Order Management Systems
- Context Management of ERP Processes in Virtual Communities
- Intrinsic and Contextual Data Quality: The Effect of Media and Personal Involvement
- Healthcare Information: From Administrative to Practice Databases
- Development of Interactive Web Sites to Enhance Police/Community Relations
