Getting Started
Product Editions and Versions
Microsoft Visio is available in three different editions: Visio Standard, Visio Professional, and Visio for Enterprise Architects (VEA) . Visio Standard is a powerful, general-purpose drawing tool. Visio Professional includes all the functionality of Visio standard and adds a logical database solution for working with databases, as well as a Unified Modeling Language (UML) solution for working with object-oriented software.
Although Visio Professional allows you to create new logical database models and reverse engineer existing databases to logical database models, it does not allow you to forward engineer logical database models to physical database schemas. The UML solution in Visio Professional supports UMLdiagramming and reverse engineering of program code to class diagrams but does not support forward engineering to code from class diagrams.
Visio for Enterprise Architects includes all the functionality of Visio Professional, as well as much more extensive modeling capabilities for both databases and software. On the database modeling side, it supports both forward and reverse engineering, conceptual data modeling using Object-Role Modeling (ORM), model error checking, database model reports , and model-database synchronization. On the software modeling side, it adds support for forward engineering from class diagrams to code skeletons, model error checking, and model report generation.
Although the standard and professional editions of Visio may be purchased as individual products, Visio for Enterprise Architects is currently available only as a component of Visual Studio .NET Enterprise Architect . Visual Studio is available in a number of editions (Academic, Professional, Enterprise Developer, and Enterprise Architect), but only the Enterprise Architect edition contains VEA.
The Visual Studio .NET products first became available in January 2002. Visio for Enterprise Architects 2002 SR-1, the first service release for VEA, became available in April 2002. As well as including updates for its underlying Visio Professional 2002, this service release included bug fixes for VEA's database and software modeling solutions.
Visual Studio .NET 2003, the second major release of Visual Studio .NET, has been announced to ship on April 24, 2003, so should be available by the time this book is printed. The tool discussion in this book is based on the VEA version contained in the final beta of the Enterprise Architect edition of Visual Studio .NET 2003, which was released in November, 2002, under the code name "Everett." This version of VEA included several important bug fixes.
To improve productivity, you should ensure that your version of Visio for Enterprise Architects is at least as recent as that contained in the Enterprise Architect edition of Visual Studio .NET 2003.
Installation
Before installing the product, ensure that your system meets the following minimum configuration: 600 MHz Pentium-III, 256 MB RAM, 750 MB free space on system drive, 2.5 GB free space on installation drive, recent operating system (Windows 2000, Windows XP or Windows .NET Server), a CD-ROM or DVD-ROM drive, video resolution of at least 800 600, and a mouse or pointing device.
You may get by with a less powerful system, but if you intend to use the full power of the Visual Studio package (not just the Visio component), you'll appreciate the added performance provided by a powerful PC. The most recent requirements and installation details may be accessed in the Visual Studio ReadMe file, or online at http://go.microsoft.com/fwlink/?LinkId=8661.
To install VEA, you first have to install Visual Studio .NET Enterprise Architect. On inserting the first CD or DVD, the auto-install process starts and the setup screen shown in Figure 3-1 appears. If you wish to view the ReadMe file now, click on the View ReadMe option.
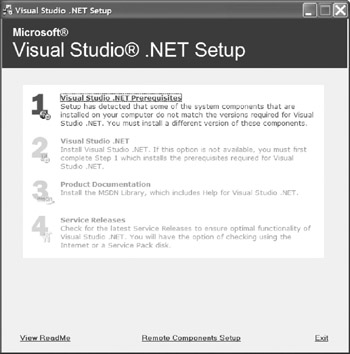
Figure 3-1: The opening screen for the Visual Studio installation process.
Follow the instructions in the Install Wizard to complete the installation of Visual Studio. This process typically takes at least two hours, even on a well-configured computer. By default, this installation does not install Visio for Enterprise Architects.
Although not strictly required, it is recommended that you uninstall any previous version of Visio before installing VEA. To uninstall a previous Visio version, choose Start > Control Panel > Add or Remove Programs , select the Visio program from the list of installed program, press the Change/Remove button and complete the uninstall process.
Assuming you have installed Visual Studio for Enterprise Architects, you may now begin the Visio installation by inserting the CD or DVD with Visio for Enterprise Architects in its label. The auto-install process starts, and the Visio setup welcome screen appears, as shown in Figure 3-2. Edit the user name and organization fields as needed to match your personal details, then press the Next button to display the End User License dialog. If you accept the license terms, ensure the check box is checked, then press the Next button to display the installation dialog shown in Figure 3-3.
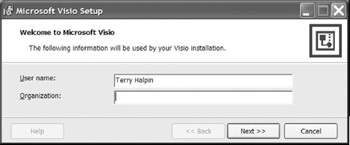
Figure 3-2: The opening screen of the Visio installation process.
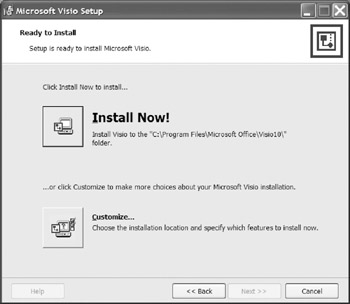
Figure 3-3: Choosing either the default or a custom installation.
Unless you want to customize the installation in some special way, choose the default installation by pressing the Install Now! Button . If you instead press the Customize button, you can change the location for installing the software, and you can specify which features are to be installed. In either case, the installation process should then continue without further input to successful completion, as reported by the dialog shown in Figure 3-4. Press OK to complete the installation.
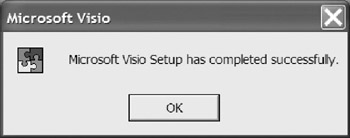
Figure 3-4: The final dialog for Visio installation.
The Visio Interface
Once Visio is installed, you can run it from the desktop by choosing Start > All Programs > Microsoft Visio . If a Visio icon appears on your desktop, you can also run Visio by double-clicking this icon. If you wish to run Visio on an existing Visio document file, you can do so by double-clicking that .vsd file in the Explorer directory.
The first time Visio runs, it takes a while to update its directory cache before you can use it. This delay does not occur in subsequent runs. On running Visio for the first time, the opening screen appears as shown Figure 3-5.
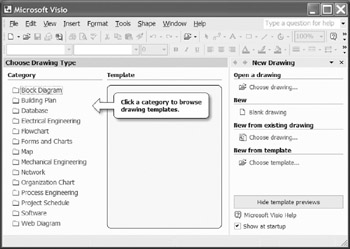
Figure 3-5: Visio's opening screen.
When you select the Database category from the category list shown in Figure 3-5 you will see a window with five icons similar to that shown in Figure 3-6. The Express-G and ORM Diagram templates are standard Visio stencils and are also included in Microsoft Visio 2003 Professional. These templates can only be used for drawing diagrams so they are not further discussed in this book. The remaining three options are for database modeling, and form the main subject of this book.
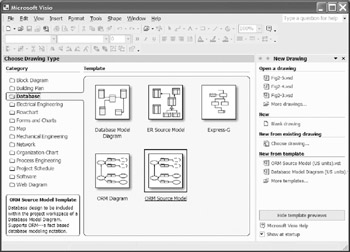
Figure 3-6: Templates for the database modeling solutions.
Let's take a tour of Figure 3-6. On the left hand side, you will see the category list of Visio's non-database solutions that were summarized in section 1 “3. When you design databases, you will use the database category exclusively so the other category options are not further discussed here. Beneath the category list you will see the tool tip that appears when you hover your mouse over one of the five menu icons.
Along the top of the window you can see several toolbars. You can display the toolbar menu shown in Figure 3-7 by right clicking anywhere in the gray area at the top of the main window. You use the toolbar menu to set your working toolbar defaults. In Figure 3-7 you can see the effect of selecting the toolbars for Standard and Formatting. You can easily view or hide a toolbar by clicking on its checkbox.
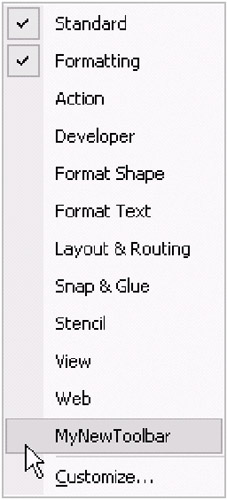
Figure 3-7: Toolbar Menu.
You can customize the toolbars by changing the buttons displayed on each toolbar or by adding a new toolbar and customizing that.
To customize a toolbar, click on Customize at the bottom of the menu shown in Figure 3-7 to reveal the toolbar customization dialog box shown in Figure 3-8. The Toolbars tab shown in Figure 3-8 gives you the same options as the right click list shown in Figure 3-7.
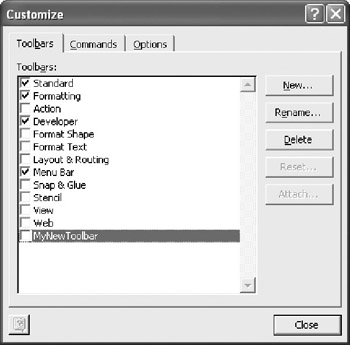
Figure 3-8: Customizing Toolbars tab.
You can add a new toolbar by clicking on the New button shown in Figure 3-8 to reveal the new toolbar naming dialog box shown in Figure 3-9.
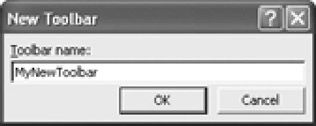
Figure 3-9: Naming a new toolbar.
When you have typed in a name for your new toolbar, click OK and the new toolbar name will appear at the bottom of the list of toolbars as shown in Figure 3-8.
You can adapt each toolbar to your needs by using the controls on the Commands tab shown in Figure 3-10 to add or delete toolbar buttons.
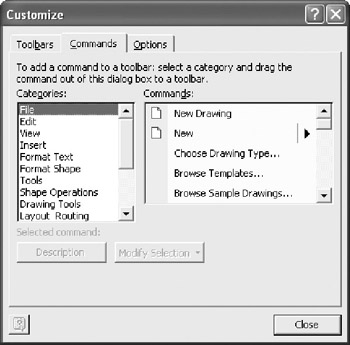
Figure 3-10: Customizing Commands tab.
You can use the Options tab shown in Figure 3-11 to further personalize your menus .
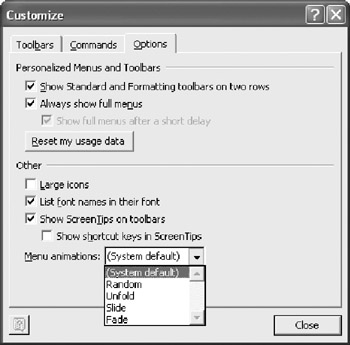
Figure 3-11: Customizing Toolbars ”Options tab.
If you unexpectedly get a screen that looks like Figure 3-12, you have accidentally hidden the database task pane and you should click on View > Task Pane to return to the database menu shown in Figure 3-6. When you reveal the View menu you will also see a "Toolbars" option that takes you to the toolbars menu previously discussed (see Figure 3-7).
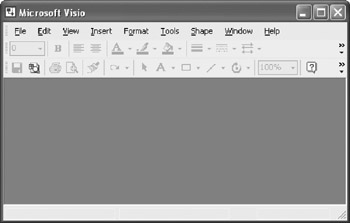
Figure 3-12: Hidden Task Pane.
Let's continue our tour of the main menu (Figure 3-6). The righthand side of your screen should look something like Figure 3-13.
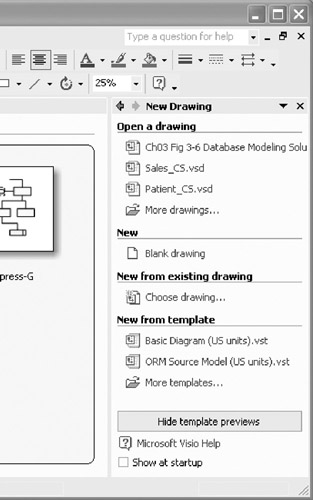
Figure 3-13: File functions.
Look at the list of files under the heading " Open a drawing". The file at the top of the list is the image of Figure 3-6 whereas the two files below it are the ORM Source Model examples used in this book. This list shows all the recently opened Visio files regardless of whether they are database related files or not. This makes Visio very flexible because you can switch from one category to another just by clicking on a filename. This is one place where you benefit from investing in a meaningful file naming convention of your own.
If you do get lost here, you can close all your open files by repeatedly clicking on the black "" in the top right hand corner of your screen and then start again by clicking on View > Task Pane. Be careful not to click on the red and white window exit button because that will instantly close Visio.
The "New" function opens the standard Visio drawing surface, which is useful if you need to make a quick Visio drawing to illustrate a point. The "New from Existing Drawing" function opens a file menu so you can select an existing file on which to base your next task. You can use the "New from Template" function to switch templates. If you click the checkbox next to "Show at startup," then Visio will start in whatever template you had open when you checked the checkbox.
When you click on the small down arrow at the top of the right hand window you will see the menu shown in Figure 3-14.
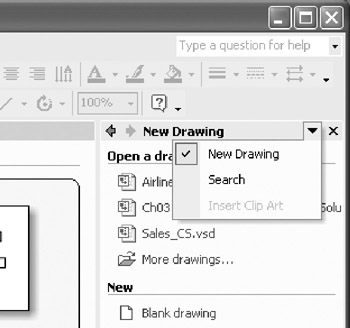
Figure 3-14: New Drawing and Search Options.
Clicking on the "Search" button will change the right hand window to look like Figure 3-15. Clicking on "Search Tips" will reveal a Help window that explains the Search functions. To return to the main menu (Figure 3-6), just click on the "New Drawing" option as shown in Figure 3-14.
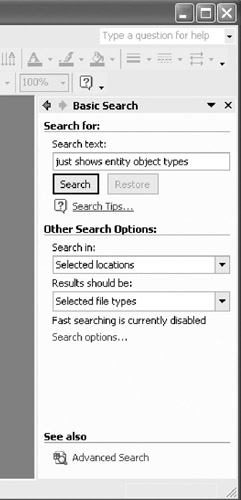
Figure 3-15: Search window.
Let's now take a look at floating and docking windows . If you can access the sample model Patient_CS.vsd, open it now, and Visio will give you a display that looks something like Figure 3-16.
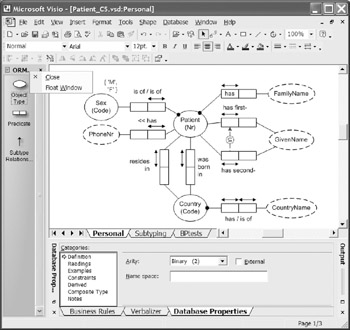
Figure 3-16: Right-clicking the title bar of the ORM Source stencil.
Here the screen displays a number of windows, including the ORM Source stencil, the Drawing window, and the Database Properties window. You can reposition any window by floating it. To float a window, right-click its title bar and choose Float Window from the context menu. Figure 3-16 shows the context menu for the ORM Source stencil.
You may now drag the window to another place on the screen. To dock a window, simply drag it to the edge of the screen where you want it. Figure 3-17 shows the ORM Source stencil docked at the right of the screen. To save space here, only the Drawing and ORM Source stencil windows are displayed in the figure.
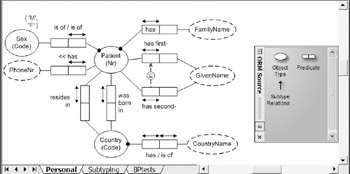
Figure 3-17: Docking the ORM Source stencil to another position.
You may float and dock any window. If you are floating the Database Properties window, you may also dock it by right-clicking its title bar (on the left of its window) and choosing Dock Window from its context menu.
The Drawing window has horizontal and vertical scroll bars. To move the drawing within the window, move the scroll bars by clicking them with the mouse. If you have a wheel mouse, you may use the wheel to scroll up or down.
To change the magnification at which the drawing is displayed, choose the zoom level from the magnification drop-down list box in the Standard Toolbar. Figure 3-18 shows the magnification set to 200%. If the Standard Toolbar is not displayed, you can display it by choosing View > Toolbars from the main menu, and checking the Standard option. You can also zoom in on any area by holding the Ctrl and Shift keys down as you select the zoom region. To pan and zoom around any area, open the Pan & Zoom Window by choosing View > Pan & Zoom Window from the main menu. Then move this window to focus in on an area of interest, as shown in Figure 3-18.
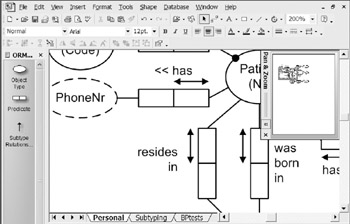
Figure 3-18: Panning and zooming.
Using Help
You can get lots of help from within Visio and from the Microsoft Office website. Figure 3-19 shows the result of typing "help" in the question box in the top right hand corner of your screen.
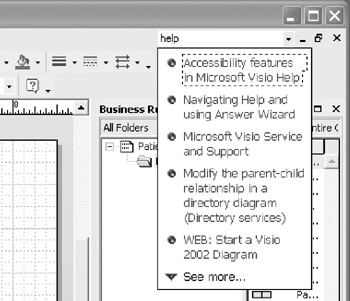
Figure 3-19: General Help.
If you click the small question mark shown in the top left hand area of Figure 3-19, you get the Visio specific help window. To show the Contents window, click the Show icon second from the left (which toggles it to a Hide icon). See Figure 3-20.
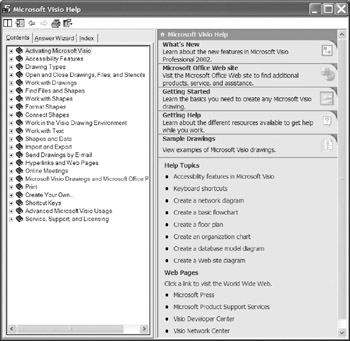
Figure 3-20: The Visio Help window.
If you double click on Help on the main menu, you reveal the help menu shown in Figure 3-21. The Microsoft Visio Help option displays the help window shown in Figure 3-20. The Developer Reference is for those who want to program Visio's shapes . This option is not about database development. If you are connected to the internet, Visio on the Web takes you directly to Microsoft's Visio website. Office on the Web takes you directly to Microsoft's Office website.
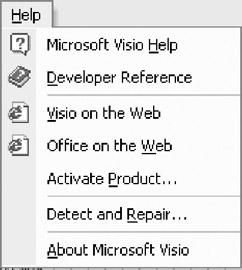
Figure 3-21: Main menu help.
The Activate Product option is a feature that you use when installing VEA. You can use Detect and Repair to automatically find and repair any errors in the Visio software. The About Microsoft Visio option shows version and license information.
A useful way to find help about the database modeling solution is by using the Answer Wizard tab that you can see on Figure 3-20. If you put "ORM" into the "What would you like to do" box and click on "Search," you will get a response similar to that shown in Figure 3-22. Have fun!
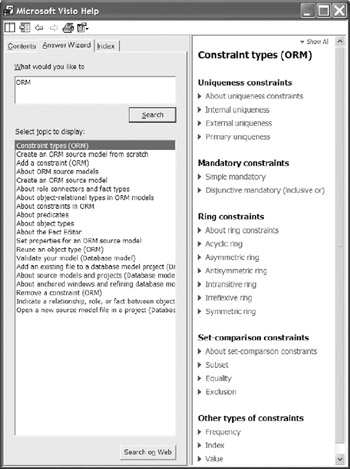
Figure 3-22: ORM help.
To activate Help at any time, you may also press the F1 key . This is especially handy when working within the database modeling solution, as the help displayed will often be context sensitive, displaying specific help related to the functional region where the cursor is currently positioned.
Pagination and Layers
When you view a large database model, it helps a lot to display different sub-areas of the model on different pages. If you look back at Figure 3-17, you'll see that the sample model Patient_CS.vsd is divided into three pages: Personal, Subtyping, and BPtests.
You can add a new page at any time using the Insert > New Page command on the main menu. To rename a page, simply right-click the relevant page tab at the bottom of the drawing window, choose the Rename Page option from the context menu, and enter the new name .
When you print the pages of your model, the page names are not included automatically. However you can print page names as well as other useful information by using page headers and footers . To add a header or footer to each page in your database model, choose View > Header and Footer from the main menu. This opens the Header and Footer dialog shown in Figure 3-23.
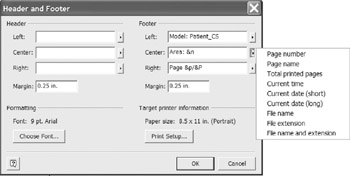
Figure 3-23: Adding a header or footer to pages for printing.
For the Left, Center, or Right regions of the header or footer, enter any text that you want to include in that region. Click the arrow to the right of the box, and then choose any tool-provided information that you want to include. For example, Figure 3-23 shows the footer entries for the Patient_CS model, including the pop-up menu options for adding details to the center area of the footer.
The left region of the footer contains the user text "Model: Patient_CS". The central region contains the user text "Area:", and the Page Name option has been selected to follow that text. The tool encodes the page name entry as the "&n" parameter. The right region of the footer includes the user text "Page" followed by the Page number (&p), then a slash "/", and then the Total printed pages (&P). For example, when printed, the first page of the Patient_CS model will include the following information in the footer: Model: Patient_CS, Area: Personal, Page 1/3. You can preview how the pages will look by clicking the Print Preview icon in the Standard Toolbar.
For Margin, type a value to specify how far the header or footer prints from the top or bottom of the page. To change the typeface, size , color , or other aspects of the header or footer font, press the Choose Font button and then make your choices.
You can add special fields to your drawings. To add a field you must first select the shape to which you want to add the field. Not all shapes allow you to add fields. You can always add a field to a text box created with the Text Tool from the Standard Toolbar.
Select the relevant shape, such as a text box, then select Insert > Field from the main menu to reveal the Field Dialog shown in Figure 3-24. Choose the relevant category from the Category list (e.g., Date/Time). In the Field list, select the field you want to add. (e.g., Print Date). In the Format list, click on the format you want to use. When you click OK , the field will appear on your drawing.
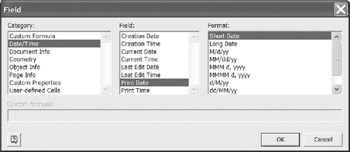
Figure 3-24: Field dialog.
Each Visio drawing contains at least one foreground page and may also contain one or more background pages . You use a background when you want the same shape such as a project name or company logo, to appear on more than one drawing page. The background element appears on each page to which you assign the background. You can assign only one background page to each foreground page, but each background can also have a background, so you can create a layered effect. When you assign a background to a foreground page, the shapes on the background are visible when you display the foreground page, but you cannot edit them from the foreground page. To set background pages, choose File > Page Setup > Page Properties from the main menu.
If you want to selectively view, edit, print, or lock shapes in a drawing, or to have several layers of text and shapes within the same page, you should use layers instead of a background. You use layers to organize related diagrams and parts of diagrams. A layer is a named category of shapes. By assigning shapes to different layers, you can selectively view, print, color, and lock the different shape categories. You can also snap and glue a shape to a layer. You can assign a shape to multiple layers or to no layers at all. Every page in a drawing can have a different set of layers. Some shapes are already assigned to layers. When you drop a shape on a page, the corresponding layer is added to the page. To use layers, choose View > Layer Properties from the main menu.
You can use layers to present a database model layer by layer. The top layer can reveal just a few main ORM objects or tables, and each successive layer can be used to reveal extra detail. This gives you a very powerful way to present complex database models. You can introduce your audience to the main ideas on the top layer and then gradually drill down to the layers that reveal the details. As with most other topics, the Visio Help has lots of information about layers. As discussed in section 5.10, the ORM Source Model solution places different kinds of constraints on different layers, so you can hide or display them at will.
Simple Examples of Forward Engineering
In this section, you'll learn how to create a simple ORM model and map it to a relational database model. You'll also see how to create the relational model directly, without using ORM. Finally you'll see how to automatically generate the Data Definition Language (DDL) code for the physical database schema.
The main purpose of this section is to give you a quick overview of how the tool supports database modeling at various levels. To derive maximum benefit from this section, you should work through the examples using the Visio tool. In following the steps outlined, you'll be introduced to various components of the user interface. These will be covered in detail in later chapters. For now, just try to understand the main ideas being illustrated by these examples.
The examples in this section are based on a simple fragment of an application domain that deals with medical patients . Suppose that you need to build a database to store facts that can be entered via a simple patient form, two instances of which are shown in Figure 3-25. How would you do this using the Visio tool?
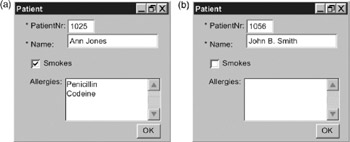
Figure 3-25: Two patient record forms.
Creating a Simple ORM Model
To create a formal model of data, you must understand, at least informally, the semantics or meaning of the data. To facilitate this move from data to information, the ORM approach suggests verbalizing the information in terms of elementary facts. The facts on form (a) of Figure 3-25 might be expressed informally as "Patient 1025 is named Ann Jones, smokes and is allergic to penicillin and codeine". To ensure that objects are well-identified, and the facts are all elementary, this may be restated as the following four facts:
The Patient with patient number '1025' has the PatientName 'Ann Jones'.
 The Patient with patient number '1025' smokes.
 The Patient with patient number '1025' is allergic to the Drug named 'Penicillin'.
 The Patient with patient number '1025' is allergic to the Drug named 'Codeine'.
Similarly, the following single fact is captured on form (b) of Figure 3-25.
The Patient with patient number '1056' has the PatientName 'John B. Smith'.
You might argue that form (b) also tells us that patient 1025 doesn't smoke and doesn't have any allergies. Well, there's no need to store that information explicitly in the database, because we typically assume that if a fact is not included in, or derivable from, the database then it's false ”this is called the closed world assumption.
The actual entries ("1025", "Ann Jones" etc.) on the form fields are called values, and are typically numbers or character strings. Values are often used to refer to other things called entities . For example, the value "1025" is used here to identify a patient, or entity instance. In this example, the two different patients have different names ("Ann Jones" and "John B. Smith"), but in general two patients might have the same name , so we use patient numbers instead to identify them.
A set of all possible instances of a given kind is said to be a type. The set of all possible patient names is a value type . Let's call this "PatientName". The set of all possible patients is an entity type . Let's call this "Patient". Similarly the set of all possible drugs is an entity type. Let's call this "Drug". In ORM, values and entities are treated as objects, so value types and entity types are object types .
| Note |
In languages like English that distinguish between singular and plural, it's good form to always use a singular term for an object type (e.g., "Patient" rather than "Patients"). |
When an entity can be identified using a single value, the manner or mode in which the value refers to the entity is said to be a reference mode. For example, "1025" refers to a patient by being a number for it, and "Penicillin" refers to a drug by being a name for it. Simple reference schemes may depicted by placing the reference mode in parentheses after the entity type name. The reference mode "number" is often abbreviated to "nr" or "Nr". For example, the entity types and reference schemes in our application may be set out as shown below:
Patient(Nr)
 Drug(Name)
Because values refer to themselves , they are self-identifying, so do not have a reference scheme. This may be shown by placing empty parentheses after the value type. For example, the PatientName value type may be declared thus:
PatientName()
Collectively, the two forms in Figure 3-25 contain five fact instances. Assuming the reference schemes above are declared, these facts may be set out more concisely thus:
Patient '1025' has PatientName 'Ann Jones'.
 Patient '1025' smokes.
 Patient '1025' is allergic to Drug 'Penicillin'.
 Patient '1025' is allergic to Drug 'Codeine'.
 Patient '1056' has PatientName 'John B. Smith'.
By removing the instance values, you can see that there are just three kinds of facts involved. These fact types may be set out thus:
Patient has PatientName.
 Patient smokes.
 Patient is allergic to Drug.
Removing the object types from these sentence types leaves the predicates. As in logic, a predicate is just a declarative sentence with the object terms removed. An ellipsis " " may be used as a placeholder for the object term. So the predicates for the above fact types are:
... has ...
 ... smokes ...
 ... is allergic to ...
The number of object-holes in the predicate is the arity of the predicate. The has and is allergic to predicates are binary predicates because they have two object holes. The smokes predicate is a unary predicate, because it has just one object hole. If a binary predicate is infix (its placeholders are at its ends), then the ellipsis symbols may be omitted. For example, the predicate has is implicitly the same as has .
To complete the model, you need to add any relevant constraints on the fact types. For this application, the relevant constraints may be expressed formally in ORM thus:
Each Patient has exactly one PatientName.
 It is possible that the same Patient is allergic to more than one Drug and that more than one
 Patient is allergic to the same Drug.
The set of sentences listing the reference schemes, fact types and constraints is an ORM schema, expressed in textual form. An ORM schema may also be depicted in graphical form. The following steps show one way to create the sample ORM schema in Visio for Enterprise Architects.
- Run Visio (e.g., Start > All Programs > Microsoft Visio ).
- Open the ORM Source Model template ( File New Database ORM Source Model ).
When you select the ORM Source Model template, a screen like Figure 3-26 appears. In addition to the menus and icons at the top, there is an ORM stencil, a Drawing window, and an area for displaying the Business Rules editor, and other windows you might open (e.g., Verbalizer). To reduce the space consumed by Figure 3-26, the display has been resized.
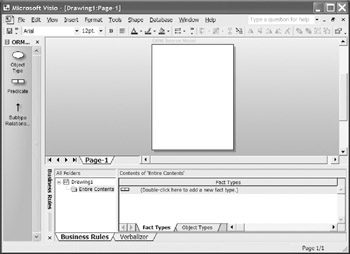
Figure 3-26: ORM stencil, Drawing window, and Business Rules window.Note Normally the drawing window occupies most of the screen. By default, the three shapes in the ORM stencil appear on the same horizontal row. You can give the drawing window more room by reducing the width of the ORM stencil so that the shapes line up vertically, as shown here. To do this, hover the cursor on the border between the stencil and the drawing window until the cursor changes to a resize cursor, then drag it to the left.
Further space for the drawing window has been reclaimed by turning off Rulers. For tidiness, grid lines have been suppressed. To control view aspects like this, open the View menu and toggle the relevant menu options.
You can add sentence types to an ORM model by dragging Object Type and Predicate shapes from the stencil to the drawing window. Alternatively you can add sentence types using the Fact Editor. For now, let's use the Business Rules editor to do this.
- Move the cursor to the bottom row displayed in the Fact Types pane of the Business Rules window (in our example, there is only one row).
The Fact Types pane now prompts you to start typing the new fact type. It also displays a New button at the right, as an alternative way to start entering a new fact type. See Figure 3-27.
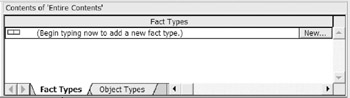
Figure 3-27: To enter a new fact type, press the New button (or just type the fact type). - Press the New button.
This causes the Fact Editor to appear. By default, the fact editor's input style is Guided, which is easier for occasional users. The Freeform input style is faster for experienced users. Let's be daring, and change the input style to Freeform.
- Set the radio button for Input Style to Freeform, as shown in Figure 3-28.
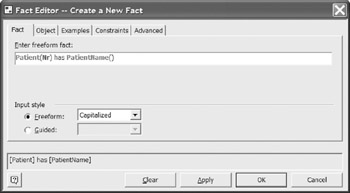
Figure 3-28: Entering a fact type in the Fact Editor using Freeform input style.The freeform setting allows you to enter fact types faster by using a formal syntax that can be parsed by the fact editor. If you choose Capitalized mode (the default), you must name each object type with a single word, starting with a capital letter, e.g., PatientName. If you want to start with a lower case letter, or embed spaces in the name, you must choose bracketed mode, e.g., [Patient Name].
Reference modes may be declared in parentheses after the entity type name, e.g. Patient(Nr). Value types are declared by appending empty parentheses, e.g. PatientName(). The rest of the sentence is parsed as the predicate.
- Type the fact type Patient(Nr) has PatientName() , and select the Constraints tab.
This opens the Constraints pane, which allows you to enter constraints on that fact type. Constraint Question #1 prompts you to select one of four alternatives from a drop-down list box.
- Select the Exactly One option, as shown in Figure 3-29.
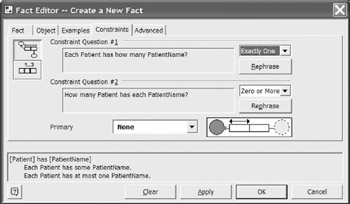
Figure 3-29: Adding constraints in the Fact Editor.The phrase "Exactly one" is short for "at least one and at most one", so this choice actually adds two constraints, which are automatically verbalized at the bottom. The default setting for Constraint Question #2 is correct, so leave it as is. The next chapter explains how to improve the wording of Constraint Question #2 by providing an inverse reading for the fact type, e.g., PatientName is of Patient .
- Press the Apply button.
This enters the fact type and its constraints into the model, and prompts you for a new fact type starting with Patient. Once you have chosen a reference scheme for an entity type, you don't need to repeat the reference scheme when specifying subsequent fact types.
- Complete the fact type Patient smokes , and press the Apply button.
This enters the unary fact type into the model, and prompts you for a new fact type starting with Patient.
- Complete the fact type Patient is allergic to Drug(Name) , and select the Constraints tab. Now select the Zero or More option for Constraint Question #1, and press the OK button.
This enters the fact type and its constraint into the model, and closes the Fact Editor. The three fact types you entered do not yet appear on the drawing window, but they are now displayed in the Business Rules window.
- Select the three fact types by placing the cursor on the first fact type, holding the Shift key down, and moving the cursor to the last fact type.
The first fact type is included in the selection even though it is not highlighted with the others (see Figure 3-30).
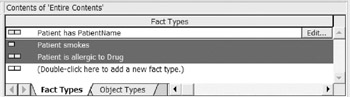
Figure 3-30: Selecting the fact types to drag onto the drawing window. - Now drag the fact types onto the drawing page where you want them displayed.
The model now appears in graphical format. You can finesse the display by moving the predicate text and object types around as shown in Figure 3-31. Entity types are shown as named, solid ellipses, with their reference mode in parentheses. Value types are shown as named, dashed ellipses.

Figure 3-31: Graphical ORM model for the sample application.Each predicate is shown as a named sequence of role-boxes. In ORM, a role is simply a part played in a relationship (which may be unary, binary or longer). Each role is connected by a line to the object type that plays it. If the role is mandatory for the object type, a black dot is added; otherwise the role is optional. For example, each patient must have a name, but needn't smoke or have allergies.
The arrow-tipped bars over predicates depict uniqueness constraints . The uniqueness constraint over the first role of Patient has PatientName , indicates that if you populate this fact type with a set of fact instances, each patient number occurs there at most once. So each patient has at most one patient name.
The spanning uniqueness constraint on the allergy fact type indicates that only the patient-drug combination need be unique. So a patient may be allergic to many drugs, and vice versa. ORM uses mandatory and uniqueness constraints instead of cardinality or multiplicity constraints, because this facilitates constraint validation by sample populations, and also scales properly to associations with three or more roles.
- To save your model , choose File > Save from the File menu, or click the Save (diskette) icon. This opens the Save-As dialog box. Choose the folder where you want to save the model, add a filename for the conceptual schema (e.g., Patient1_CS), press the Save button in the dialog, then press OK in the properties dialog. The file will be saved with the extension ".vsd" (Visio document).
Building a Logical Database Model from ORM
To transform an ORM model to a logical database model, you first add the ORM model to a database model project, and then build the logical model. Here's one way to do this for the ORM source model created earlier.
- From the File menu, open the logical modeling solution by choosing File > New > Database > Database Model Diagram .
- To create a database model project , choose Database > Project > Add existing document from the Database menu.
- An Add Document to Project dialog box should now appear. Use the Look in : field to navigate to your saved ORM model, then press the Open button . The ORM model should now be listed in the project window.
- Save the project file by pressing the Save icon on the main menu, and giving the logical schema a filename (e.g., Patient1_LS). The project file also has the extension ".vsd". The name and page of your current model is always listed in the title bar at the top of the screen.
- Now build the logical model by choosing Database > Project > Build from the Database menu.
VEA now builds the relational database schema automatically. The Output window records the progress of the build process. If the build fails, you will see error messages in the Output window. If the build succeeds, the resulting table schemes appear in the Tables and Views window at the left of the screen. By default, so long as the ORM model is correct, the build process generates a relational schema in fifth normal form.
Figure 3-32 shows roughly what the screen should look like at this stage. For a compact, tidy screenshot, some windows have been resized, and the ruler and grid display have been suppressed (using View menu toggles) ”there is no need for you to do this. Although the table structures have been created, they do not yet appear on a diagram. To see the logical database model in graphical form, you need to drag the table schemes onto the drawing page shown at the right of the project window. This is the next step.
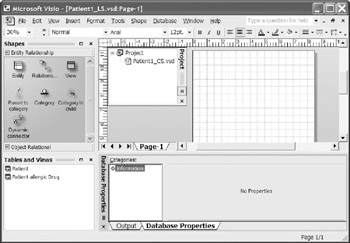
Figure 3-32: Building a logical database model from an ORM source model. - To select the two table schemes, mouse-click the first table scheme, hold the Shift key down, and click the second table scheme. Now drag the schema onto the drawing page by holding the mouse's left button down as you move the cursor to the drawing page. The result is shown in Figure 3-33.

Figure 3-33: The logical schema built from the ORM schema.
There are two table schemes, with one foreign key connection between them. Each table has its name in the shaded header, with its columns listed below. Primary keys are underlined , marked "PK" and appear in the top compartment for the columns. Mandatory (not null) columns are in bold. Foreign key columns are marked FK n where n is the number of the foreign key with a table. In this case we have only one foreign key that targets the primary key of the Patient table. The foreign key connection itself is depicted as an arrow from the foreign key table to the target table.
In this example, the names of the tables, as well as the names and data types of the columns, are those that are generated automatically by default. Various options exist to control how table and column names are generated. In practice it's best to set the data types on the ORM model, where object types correspond to conceptual domains. The correct data types then automatically propagate to all the attributes based on these domains. A detailed coverage of such issues is provided in later chapters.
Creating a Logical Database Model Directly
Instead of deriving a logical database model from an ORM model, you can create the logical model directly using the Database Model Diagram template. For example, to create the relational model displayed in Figure 3-33, proceed as follows .
- From the File menu, open the logical modeling solution by choosing File > New > Database > Database Model Diagram.
The screen should now look similar to Figure 3-34. For a compact, tidy screenshot, some windows have been resized, and the ruler and grid display have been suppressed (using View menu toggles) ”there is no need for you to do this.
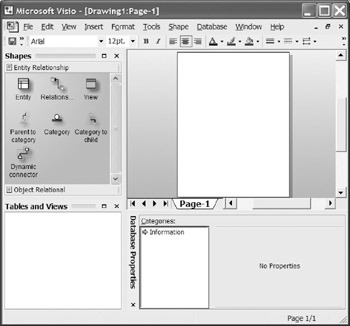
Figure 3-34: The Database Modeling Diagram template.The Entity Relationship stencil to the left of the screen is used to construct a relational database schema. This stencil has seven shapes. If you hover the cursor over a shape, a Screen Tip appears to explain its purpose. Only the first two of these shapes are needed to construct the sample database model.
The Entity shape depicts a relational database table structure. This structure is technically called a table scheme, to distinguish it from an actual table, which includes a set of data rows. From now on however, we will often refer to a table scheme informally as a table.
The Relationship shape is used to establish a connection from a foreign key in one table to the column(s) that it references (typically a primary key in another table).
- Select the Entity shape and drag it onto the drawing window. This creates a local instance of the shape, and names it Table 1.
When a table shape is selected, its Database Properties window is also displayed. You can use this to set all the properties of the table. In the Categories section, an arrow to the left indicates which category is currently selected for editing.
- Check that the Definition Category is selected. Now edit the Table 1 entry in the Physical name field to rename the table as "Patient". This change is immediately applied to the shape in the drawing window, as shown in Figure 3-35.
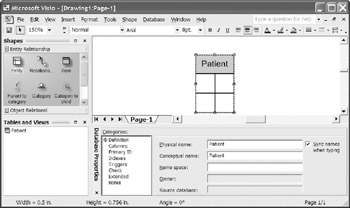
Figure 3-35: Using the Entity shape to declare a table scheme. - Select the Columns category to bring up the properties pane to edit columns. In the Physical Name field enter the column name "patientNr". Leave the default data type unchanged. Check the Required check box to declare the column not null, and then check the PK check box to declare it a primary key column. On the drawing surface, the primary key column is now displayed in the top compartment of the table shape, and marked " PK ". The column name appears in bold type, indicating that it is a mandatory column.
- Move the cursor to the second row, add the column name "patientName", and check the Required box.
The second column now appears on the table shape, below the primary key line.
- Move the cursor to the third row, add the column name "smokes", and check the Required box.
The third column now appears on the table shape, below the primary key line. The table shape and properties sheet should now appear roughly as in Figure 3-36. In practice, you would normally make some changes to data types, but we'll postpone discussion of that till a later chapter.
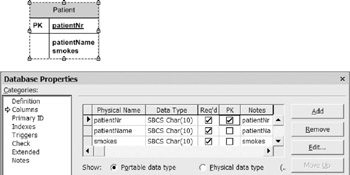
Figure 3-36: Adding column details to the Patient table. - Drag another instance of the Entity shape to the drawing window, edit its Definition category to rename the table as "Allergy", and then edit its Columns category to add the columns named "patientNr" and "drugName", and check both of these to be Required, PK columns. The drawing window should now show two table shapes as shown in Figure 3-37.

Figure 3-37: The two table schemes are now defined.All that remains is to add the foreign key connection between the tables. Declaring the Allergy.patientNr column to be a foreign key referencing the Patient.patientNr column ensures that each patient for which an allergy is recorded is also recorded in the Patient table. From an ORM perspective, this is just a way to implement the mandatory constraint that patients have their names recorded.
- Drag an instance of the Relationships shape in the Entity relationship stencil onto the drawing window. Move the end with no arrow-tip into the middle of the Allergy table, until the table is highlighted in red, and a red rectangle appears on the line end where it attaches to the table. This indicates that the line end is glued to the table shape.
- Move the arrow-tip end into the middle of the Patient table, until the table is highlighted in red, and a red rectangle appears on the arrow tip indicating it is glued to the table shape. The foreign key connection should now be displayed by a connecting arrow as in Figure 3-38. The foreign key column Allergy.patientNr is marked FK1.

Figure 3-38: The foreign key reference is now displayed. - To save your model , choose File > Save from the File menu, or click the Save (diskette) icon. This opens the Save-As dialog box. Choose the folder where you want to save the model, add a filename for the logical schema (e.g. Patient2_LS), press the Save button in the dialog, then press OK in the properties dialog. The file will be saved with the extension ".vsd" (Visio document).
Generating a Physical Database Schema
Regardless of whether you created a logical database model directly, or derived it from an ORM model, you can use that logical model to generate the physical database schema for a target DBMS. Generation gives you the option to generate the DDLscript instead of having the tool build the tables for you. It is usually best to first generate the DDLscript, which you can later execute within your chosen DBMS.
- Open the sample logical model in the Database Model Diagram template (e.g., double-click either Patient_LS.vsd or Patient2_LS.vsd).
- Select Database > Generate from the Database menu. This invokes the Generate Database wizard.
- Ensure the option Generate a text file of the DDL script is checked, and press the Next button.
- In the Installed Visio drivers field, choose the target database driver (e.g., Microsoft Access), if needed using the Setup options to configure it. In the Database name field, enter a database name (e.g., MyDB), and press the Next button .
- Accept all the defaults for the next screens, and choose Yes when prompted whether you want to view the generated DDLscript.
The DDLscript now appears in a code editor. You may save it if you wish. The code shown below is extracted from a DDLscript generated from the Patient1_LS file discussed earlier, choosing SQLServer 2000 as the target DBMS. This code has been reformatted and stripped of comments to save space. If you used Patient2_LS as the logical model, the names will differ slightly because different naming choices were made. Later chapters discuss how to control name generation and provide an in-depth treatment of the Generate wizard.
create database "MyDB"
 use "MyDB"

 create table "Patient allergic Drug"
 ("Patient Nr" char(10) not null,
 "Drug Name" char(10) not null)

 alter table "Patient allergic Drug"
 add constraint "Patient allergic Drug_PK" primary key ("Patient Nr", "Drug Name")
 create table "Patient" (
 "Patient Nr" char(10) not null,
 "PatientName" char(10) not null,
 "Smokes" bit not null)

 alter table "Patient"
 add constraint "Patient_PK" primary key ("Patient Nr")

 alter table "Patient allergic Drug"
 add constraint "Patient_Patient allergic Drug_FK1"
 foreign key ("Patient Nr") references "Patient" ("Patient Nr")
This completes the introductory overview of the tool. By now, you should have some basic understanding of how to employ the tool to create simple data models and use them to generate physical database schemas. The database modeling solution in Visio for Enterprise Architects is very powerful, and so far we have only scratched its surface. The remainder of the book examines VEA's functionality systematically and in detail.
Overview of Database Modeling and the Database Modeling Tool
The Conceptual Modeling Solution (ORM)
- Object Types, Predicates, and Basic Constraints
- ORM Constraints
- Configuring, Manipulating, and Reusing ORM Models
- Mapping ORM Models to Logical Database Models
- Reverse Engineering and Importing to ORM
- Conceptual Model Reports
The Logical Modeling Solution (ER and Relational)
- Creating a Basic Logical Database Model
- Generating a Physical Database Schema
- Editing Logical Models”Intermediate Aspects
- Editing Logical Models”Advanced Aspects
- Reverse Engineering Physical Schemas to Logical Models
- Logical Database Model Reports
Managing Database Projects
EAN: 2147483647
Pages: 150
