Data Mining for Business Process Reengineering
Overview
Ted E. Lee
The University of Memphis, USA
Robert Otondo
The University of Memphis, USA
Bonn-Oh Kim
Seattle University, USA
Pattarawan Prasarnphanich
The University of Memphis, USA
Ernest L. Nichols, Jr.
The University of Memphis, USA
Copyright © 2003, Idea Group Inc. Copying or distributing in print or electronic forms without written permission of Idea Group Inc. is prohibited.
Abstract
Transitioning from a mining to meaning perspective in organization data mining can be a crucial step in the successful application of data mining technologies. The purpose of this paper is to examine more fully the implications of that shift. The use of data mining technology was part of our cycle time study of the Poplar County Criminal Justice System (a fictitious name). In this paper we will report on the use of data mining in the Poplar County Criminal Justice System (PCCJS) study in an attempt to speed up their case handling processes. Marketing and finance researchers are more involved with "simple" (i.e., direct) relationships, whereas BPR researchers are more concerned with long chains of interacting processes. This difference appears in the tools these researchers use: marketing and finance researchers are more interested in set-theoretic problems, BPR researchers, in graph-theoretic problems. Yet data mining technologies incorporate graph-theoretic algorithms. Consequently, they should be able to support hypothesis generation in BPR activities. We were able to come up with relevant and meaningful hypotheses for BPR in the PCCJS system by using data mining technology, specifically sequential pattern analysis: "Which areas we should look into in order to speed up the case handling process?" This valuable outcome would have not been possible without data mining technology, considering the large volume of data on hand. It is hoped that this study will contribute to broadening the scope of applicability of data mining technology.
Introduction
The terms data mining and knowledge discovery conjure up images of miners searching for gold or explorers seeking an unknown continent. Those images can be powerful, yet misleading, in that they strongly suggest that those using data mining tools have a clear picture of where and for what they are looking. More explicitly, those images of knowledgeable searchers imply the existence of two types of knowledge, which may not necessarily be true for data mining tool users: 1) a set of clues or "signs" that act as inputs to 2) a set of decision rules that process the clues into desired outcomes. For example, expert gold miners have a knowledge base of important signs and rules that allow them to distinguish gold ore from pyrite ("fool's gold").
Data mining in organizational environments, on the other hand, is conducted in human social contexts. This environment is vastly more complex and subtle than the mechanistic, engineered world of the miner. This difference is significant, in that many of the signs encountered in the human world of data mining activities are often equivocal, and the decision rules are more heuristic. "Mining" for patterns in organizational databases is thus more like mineralogical, or, better yet, archeological research, in which the relationships between data are fuzzy, messy, equivocal, or unknown.
Transitioning from a mining to meaning perspective in organization data mining can be a crucial step in the successful application of data mining technologies. The purpose of this paper is to examine more fully the implications of that shift. The use of data mining technology was part of our cycle time study of the Poplar County Criminal Justice System (a fictitious name). In this paper we will report on the use of data mining in the Poplar County Criminal Justice System (PCCJS) study.
The Poplar County Criminal Justice System Study
Located in the southeastern United States, Poplar County (fictitious) contains a large metropolitan area of roughly one million people. Recent growth patterns have created problems with the county's infrastructure. One of — if not the most problematic infrastructure — has been the County Jail. The jail is constantly overcrowded. Originally built for a population of about 1,500 inmates, the jail now regularly houses about 2,300–2,500 inmates. This overcrowding has created a number of problems, some of which have prompted lawsuits from inmates as well as from the Federal Courts.
The Poplar County Commissioners have taken steps to increase the Jail's capacity; however, it has also determined that some of the overcrowding was associated with the length of time required to bring cases to trial and adjudicate them. Consequently, the Commissioners asked the researchers for their help in resolving some of these issues. The study began with interviews of County Jail personnel. Those interviews revealed many problems with which the Jail had responsibility but little control. For example, they had no control over who came into the Jail and who went out. They could not tell law enforcement officers that they could not take in prisoners, nor could they force the Courts to release more prisoners to make room. The interviews revealed the systematic interrelationships between the Jail and other agencies within the Poplar County Criminal Justice System (PCCJS).
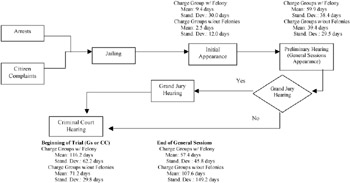
To gain a better understanding of the PCCJS and the determinants of jail overcrowding, three intelligent strategies were employed. The first two strategies involved interviewing important PCCJS personnel, including, but not limited to, the County Sheriff's Office, General Sessions Court Clerk's Office, Pretrial Services, District Attorney's Office, local police departments, and so on. The first strategy involved objective questioning aimed at better understanding the effects of formal PCCJS workflows on jail overcrowding. This line of questioning led to the development of a PCCJS workflow process chart. That diagram provided a map to explain how the actions of one group impacted jail overcrowding. The second strategy involved subjective questioning aimed at eliciting beliefs as to how effectively and efficiently the formal workflow process worked. This second line of questioning was intended to "breath life" into the workflow diagram by ascertaining trouble spots and bottlenecks, as well as pinpointing possible solutions. Because of limited space, only the general process diagram for PCCJS is presented in Appendix I.
The third strategy was to analyze PCCJS transaction data to ascertain the system's overall performance. This data, which was drawn from almost all agencies within the PCCJS, was stored in Poplar County's Information Systems Services database. Unfortunately, the database was designed for tracking, but not for performance evaluation; that is, the database could report where and when a case was supposed to go next, but not how long it took to process an incoming jail inmate.
However, the researchers faced a dilemma in integrating the three types of data. On the one hand, the objective and subjective data gleaned from the interviews was used to construct a graph-theoretic workflow process diagram. On the other hand, the relational structure of the County's PCCJS relational database was set-theoretic. At issue was how to analyze set-theoretic data to support graph-theoretic BPR in a cost and time effective manner.
Method
Officials in a Criminal Justice system were interviewed to elicit their understandings and beliefs of the workflow operations. Members of the County Jail, County Sheriff's Office, Local Police Department, Pretrial Services, County Clerk, Public Defender's Office, and other agencies were interviewed. Based on those interviews, a workflow diagram was generated. The interviewees were then asked to engage in two rounds of double-checking.
Random sets of transaction data for the Criminal Justice System was collected over a period of three years. To account for seasonal variations in caseloads, one week was selected randomly from every quarter between summer 1997 to spring 2000. All cases from those weeks were selected. Any transaction associated with those cases was then selected and stored in the study's database. In this way, the start times of the cases were spread in a randomized fashion across the time study, but the transactions were drawn from anytime. The data was then analyzed using the two methods in data mining: association rules analysis and sequential pattern analysis.
Data Mining
A major difficulty with the dataset was its internal relational structure. Like all relational databases, the PCCJS database was build upon a set theory foundation. That foundation gives relational database management systems wide applicability to those problems that can be conceived in and resolved through sets. For example, large numbers of customer-based transactions have long been successfully stored and analyzed through set-theoretic relational database systems.
However, many of the problems faced in BPR in general—and in the PCCJS study in particular—are often better understood in a graph-theoretic framework. (e.g., path analysis). Under these circumstances, traditional settheoretic relational database capabilities have limited usefulness. Newer capabilities, particularly those based on data mining technologies, have built upon traditional relational database systems by incorporating graph-theoretic tools. The power of data mining technologies has been widely applied and investigated in the marketing and financial domains.
The problems facing BPR are different in many ways from those faced by marketing and financial organizations. One of the most evident is that marketing and finance researchers are more involved with "simple" (i.e., direct) relationships, whereas BPR researchers are more concerned with long chains of interacting processes (i.e., "hidden information"). This difference appears in the tools these researchers use: marketing and finance researchers are more interested in set-theoretic problems, BPR researchers, in graph-theoretic problems. Yet data mining technologies incorporate graph-theoretic algorithms. Consequently, they should at first glance be able to support hypothesis generation in BPR activities. The purpose of this paper is to investigate the extent to which graph-theoretic data mining algorithms can generate BPR hypotheses.
We started with the following two questions:
- Whether the presence of a type of reset reason is associated with another type of reset reason — Association Rules analysis
- Whether the presence of a type of reset reason is followed by another type of reset reason over a period of time, showing a sequential pattern — Sequential Pattern Analysis
The layout of the study's data set is provided in Appendix II. For example, whenever there is a status change in the case (#9749904), the change is recorded into the PCCJS system with a specific reason. The sequence of the reset reasons in the order of time is AR =>AT =>AT =>FA =>AT =>FF =>BW =>AT. If a case goes well as scheduled, there will be a smaller number of reset reasons for the case in that sequence. By using the technique of sequential pattern analysis, it is hoped that we could identify potentially problematic and/or meaningful sequential patterns of reset reasons in the cases under consideration.
Analysis of Association Rules Using Clementine
The data set used for our analysis is randomly select from 1997 to 2000: 09/ 28/97–10/04/97, 11/23/97–11/29/97, 02/22/98–02/28/98, 06/14/98–06/20/98, 07/26/98–08/01/98, 10/04/98–10/10/98, 02/28/99–03/06/99, 04/18/99–04/24/99, 07/11/99–07/17/99, 10/17/99–10/23/99, 02/06/00–02/12/00, and 04/16/00–04/22/00. The SPSS, a statistical software package, is used to detect missing value, invalid data, and outliers. The data cleaning process should be conducted at first, before performing further analysis, because the problem of missing data, incorrect or invalid data, and outliers could have a significantly destructive impact on final results. Fortunately, there are no missing values, incorrect data, and outliers in this data set; as a result, all observations are used for data mining analysis.
To conduct an analysis for association rules, the interested items, which are the reset reasons for our study, need to be recorded in a binary format (yes or no; 1 or 0). Since our original data set is in a different format (refer to Appendix I), data conversion process is required. SAS is used for this data conversion. There are 28 possible reset reasons resulting in 28 fields in the converted version. An example of data conversion can be shown as below:
Original format
|
Booking No. |
. . . . . . . . . . . . . . . . . . |
Reset Reasons |
. . . . . . . . . |
|---|---|---|---|
|
97049600 |
. . . . . . . . . . . . . . . . . . |
AR |
. . . . . . . . . |
|
97049600 |
. . . . . . . . . . . . . . . . . . |
AT |
. . . . . . . . . |
|
97049600 |
. . . . . . . . . . . . . . . . . . |
VR |
. . . . . . . . . |
|
97049700 |
. . . . . . . . . . . . . . . . . . |
AT |
. . . . . . . . . |
|
97049700 |
. . . . . . . . . . . . . . . . . . |
VP |
. . . . . . . . . |
Converted format
|
Booking No. |
. . . . . . . . . . . |
AR |
AT |
. . . |
VP |
VR |
. . . . . |
|---|---|---|---|---|---|---|---|
|
97049600 |
. . . . . . . . . . . |
1 |
1 |
. . . |
0 |
1 |
. . . . . |
|
97049700 |
. . . . . . . . . . . |
1 |
0 |
. . . |
1 |
0 |
. . . . . |
After the conversion, there are a total of 10,319 records to be used to perform data mining analysis. Clementine version 5.01, one of several commercial data mining tools, is selected to discover any association rules for reset reasons. The result of this analysis appears in Appendix III. Unfortunately, we were not able to find out any relevant or meaningful association rules among reset reasons.
Analysis of Sequential Patterns of Reset Reasons Using IntelligentMiner
The sequential pattern technique is used to search for any meaningful sequential patterns of the reset reasons. The potential findings would hopefully contribute to any reduction in cycle time of the jailing processes. For the sequential pattern analysis type, we had to use IntelligentMiner version 6.1 by IBM because Clementine version 5.01 did not support this type of analysis, which we overlooked at the outset of this project. So, we ended up doing data preparation again for this new data mining tool. Prior to conducting data mining analysis with the IntelligentMiner, data preparation, such as data cleaning and combining files into a single file, was performed with SAS and a new data file based on our original data set was produced as a flat file. The IntelligentMiner accepts input data in the form of either flat file format or database table/view. The data file produced from SAS is inputted into the IntelligentMiner under Data Wizard in the IntelligentMiner. Before performing mining or any analysis, a data object must be created and specified as input data through Data Wizard. Then, sequential pattern analysis for reset reason can be conducted. There are three input fields specified for the analysis:
- Transaction group field: Booking Number
- Transaction field: Create Date (Date the record was created or date the reset occurred)
- Item field: Reset Reason
The result of this analysis appears in Appendix IV. The result is somewhat interesting in the sense that there are many sequential patterns with consecutive AT reset reasons in the data set: AT=>AT (38%), AT=>AT=>AR (27%), RP=>AT=>AT(25%), RP=>AT=>AT=>AR (19%), and AT=>AT=>AT (16%). Especially, existence of the last sequential pattern with three consecutive AT reset reasons calls for further analysis. This result gives a clue as to which area the PCCJS Commissioners should look into to speed up the handling of the cases on their system.
Discussion
The result of association rules analysis does not help us answer the first question we had at the beginning. After careful evaluation on the all identified association rules, it is concluded that there is no relevant or meaningful association rule among the reset reasons in cases. This interpretation might make sense, because most algorithms implementing association rules analysis are based on a simple counting algorithm. However, the result of sequential pattern analysis help us generate several BPR hypotheses, i.e., which areas we should look into to possibly reduce the number of reset reasons in cases, and, in turn, speed up the overall jail processing time for cases in the PCCJS system. As pointed out earlier, there are five significant sequential patterns in the reset reasons:
- AT=>AT (38%)
- AT=>AT=>AR (27%)
- RP=>AT=>AT(25%)
- RP=>AT=>AT=>AR (19%)
- AT=>AT=>AT (16%)
The first identified sequential pattern tells that 38% of the total cases under consideration involve two reset reasons of AT that is either reassignment of a defending attorney or request for determent of case by defending attorney. The next three sequential patterns are more specialized ones that are already factored into the first pattern. One of the most interesting and significant is the last sequential pattern: 16% of the total cases under consideration involve three reset reasons of AT. The next phase of this study will be to further investigate such cases that have these identified sequential patterns.
As in any IS project, selection of a right data software tool is important, especially when a given project needs to meet a tight deadline. We started with Clementine 5.01 by SPSS for association rules analysis because of easy access to this data mining tool. Since the sequential pattern analysis is one of the most typical data mining techniques discussed in the literature, we inadvertently assumed that this feature would be supported in Clementine. Even if there were some features available in Clementine to identify possible sequence patterns, we could not find a feature that specifically implements sequential pattern analysis. After switching to IntelligentMiner for sequential pattern analysis, we also ran the same data set for association rules analysis in IntelligentMiner for performance comparison. The result of association rules analysis from Intelligent Miner was same as that from Clementine, but there was a significant difference in processing time (20 to 30 min in Clementine vs. five to 10 min in IntelligentMiner). The IntelligentMiner provides both descriptive result and visualized result, unlike Clementine, which provides only the descriptive result. With the Intelligent Miner, the conversion of data to be represented in a binary format is not required (refer to the subsection of "analysis of association rules using Clementine"). Hence, the same data format can be used to perform both association rule analysis and sequential pattern analysis. Based on our observation, IntelligentMiner is a more comprehensive data mining tool and can handle more complicated analysis than Clementine. However, it seems that Clementine is easier to understand and use than IntelligentMiner.
Conclusion
So far, we demonstrate how data mining technology can provide a support for analyzing business processes in the PCCJS system. The power of data mining technologies has been widely applied and investigated in the marketing and financial domains. One of the most evident is that marketing and finance researchers are more involved with simple relationships, whereas BPR researchers are more concerned with long chains of interacting processes. However, an appropriate application of data mining technology to BPR effort can be beneficial. We were able to come up with relevant and meaningful hypotheses for BPR in the PCCJS system by using data mining technology, specifically sequential pattern analysis: "Which areas we should look into in order to speed up the case handling process?" This valuable outcome would have not been possible without data mining technology considering the large volume of data on hand. It is hoped that this study will contribute to broadening the scope of applicability of data miming technology.
Appendix I General Process Diagram (W Times From Initial Arrest)
Appendix II Data Layout for PCCJS Study
|
RNI# |
Booking number |
Charge Code |
Court Code |
Arrest Agency |
Officer ID |
Arrest Date & Time |
Charge Time |
Charge Group Disposed Date |
Charge Group Disposed Indicator |
Probation Start Date |
Court Division |
Court Date |
Court Session |
Reset Reason |
Creation date |
|---|---|---|---|---|---|---|---|---|---|---|---|---|---|---|---|
|
162905 |
97049904 |
1 |
GS |
SO |
S2529 |
9/30/97 09:27 |
9/6/00 8:45 |
8/6/1998 |
Y |
8/6/1998 |
7 |
8/6/98 |
1 |
AR |
09/30/97 4:39 |
|
162905 |
97049904 |
1 |
GS |
SO |
S2529 |
9/30/97 09:27 |
9/6/00 8:45 |
8/6/1998 |
Y |
8/6/1998 |
7 |
8/6/98 |
1 |
AT |
10/01/97 14:03 |
|
162905 |
97049904 |
1 |
GS |
SO |
S2529 |
9/30/97 09:27 |
9/6/00 8:45 |
8/6/1998 |
Y |
8/6/1998 |
7 |
8/6/98 |
1 |
AT |
10/29/97 14:51 |
|
162905 |
97049904 |
1 |
GS |
SO |
S2529 |
9/30/97 09:27 |
9/6/00 8:45 |
8/6/1998 |
Y |
8/6/1998 |
7 |
8/6/98 |
1 |
FA |
11/12/97 11:49 |
|
162905 |
97049904 |
1 |
GS |
SO |
S2529 |
9/30/97 09:27 |
9/6/00 8:45 |
8/6/1998 |
Y |
8/6/1998 |
7 |
8/6/98 |
1 |
AT |
12/03/97 13:59 |
|
162905 |
97049904 |
1 |
GS |
SO |
S2529 |
9/30/97 09:27 |
9/6/00 8:45 |
8/6/1998 |
Y |
8/6/1998 |
7 |
8/6/98 |
1 |
FF |
01/07/98 17:48 |
|
162905 |
97049904 |
1 |
GS |
SO |
S2529 |
9/30/97 09:27 |
9/6/00 8:45 |
8/6/1998 |
Y |
8/6/1998 |
7 |
8/6/98 |
1 |
BW |
07/26/98 12:54 |
|
162905 |
97049904 |
1 |
GS |
SO |
S2529 |
9/30/97 09:27 |
9/6/00 8:45 |
8/6/1998 |
Y |
8/6/1998 |
7 |
8/6/98 |
1 |
AT |
07/27/98 10:58 |
|
|||||||||||||||
Appendix III
|
Support(%) |
Confidence(%) |
Rule Body |
Rule Head |
|
|---|---|---|---|---|
|
16.2225 |
92.0300 |
[ AR]+[ AT]+[ DP] |
==> |
[ RP] |
|
18.6452 |
91.6600 |
[ AR]+[ DP] |
==> |
[ RP] |
|
20.2539 |
89.2400 |
[ DP] |
==> |
[ RP] |
|
17.5308 |
89.1100 . |
[ AT]+[ DP] |
==> |
[ RP] |
|
18.7809 |
90.5600 |
[ VR] |
==> |
[ AT] |
|
11.4740 |
88.5600 |
[ PH] |
==> |
[ AT] |
|
11.7841 |
88.0500 |
[ VR]+[ RP] |
==> |
[ AT] |
|
16.2225 |
87.0100 . |
[ RP]+[ AR]+[ DP] |
==> |
[ AT] |
|
10.3111 |
87.0000 |
[ FF] |
==> |
[ AT] |
|
19.6724 |
86.6800 |
[ DP] |
==> |
[ AT] |
|
17.6277 |
86.6600 |
[ AR]+[ DP] |
==> |
[ AT] |
|
17.5308 |
86.5600 . |
[ RP]+[ DP] |
==> |
[ AT] |
|
11.4740 |
96.8100 |
[ FF] |
==> |
[ AR] |
|
10.1173 |
96.4000 |
[ BW] |
==> |
[ AR] |
|
48.7063 |
82.9100 |
[ RP] |
==> |
[ AT] |
|
37.7847 |
81.8600 |
[ RP]+[ AR] |
==> |
[ AT] |
|
16.2225 |
92.5400 |
[ RP]+[ AT]+[ DP] |
==> |
[ AR] |
|
18.6452 |
92.0600 |
[ RP]+[ DP] |
==> |
[ AR] |
|
20.3411 |
89.6200 |
[ DP] |
==> |
[ AR] |
|
17.6277 |
89.6100 |
[ AT]+[ DP] |
==> |
[ AR] |
Appendix IV Result of Sequential Pattern Analysis
|
Sequence Support |
Item sets |
Sequence Support |
Item sets |
Sequence Support |
Item sets |
Sequence Support |
Item sets |
|---|---|---|---|---|---|---|---|
|
51.72 |
AT |
20.002 |
DP |
14.042 |
AT |
11.668 |
RP |
|
AR |
RP |
RP |
AT |
||||
|
VR |
|||||||
|
40.406 |
RP |
19.76 |
RP |
13.577 |
RP |
||
|
AT |
AT |
RP |
11.474 |
PH |
|||
|
AT |
AT |
AT |
|||||
|
46.138 |
RP |
AR |
AT |
||||
|
AR |
11.455 |
FF |
|||||
|
19.508 |
DP |
13.364 |
RP |
AR |
|||
|
38.085 |
AT |
AT |
RP |
||||
|
AT |
RP |
11.154 |
RP |
||||
|
18.762 |
AT |
AR |
AT |
||||
|
37.475 |
RP |
VR |
AT |
||||
|
AT |
13.306 |
RP |
AT |
||||
|
AR |
18.413 |
DP |
VR |
||||
|
RP |
11.086 |
RP |
|||||
|
32.804 |
RP |
AR |
13.218 |
AT |
AR |
||
|
RP |
RP |
AR |
|||||
|
17.463 |
DP |
AT |
|||||
|
27.406 |
AT |
AT |
10.96 |
AT |
|||
|
AT |
AR |
13.005 |
RP |
AT |
|||
|
AR |
RP |
VR |
|||||
|
17.153 |
DP |
RP |
|||||
|
26.514 |
RP |
RP |
AT |
10.922 |
RP |
||
|
RP |
AT |
RP |
|||||
|
AT |
12.899 |
RP |
AT |
||||
|
16.223 |
RP |
AT |
AT |
||||
|
26.156 |
RP |
RP |
RP |
AR |
|||
|
RP |
RP |
||||||
|
AR |
12.501 |
AT |
10.902 |
AR |
|||
|
16.038 |
AT |
AT |
AT |
||||
|
25.254 |
RP |
AT |
AT |
||||
|
AT |
AT |
AR |
10.747 |
AR |
|||
|
AT |
AT |
||||||
|
15.99 |
AR |
12.249 |
RP |
AR |
|||
|
20.709 |
RP |
AR |
AT |
||||
|
RP |
RP |
10.534 |
AT |
||||
|
AT |
15.874 |
DP |
AT |
AR |
|||
|
AR |
AR |
AT |
|||||
|
AT |
12.23 |
AT |
|||||
|
20.341 |
DP |
AR |
AR |
||||
|
AR |
AR |
Part I - ERP Systems and Enterprise Integration
- ERP Systems Impact on Organizations
- Challenging the Unpredictable: Changeable Order Management Systems
- ERP System Acquisition: A Process Model and Results From an Austrian Survey
- The Second Wave ERP Market: An Australian Viewpoint
- Enterprise Application Integration: New Solutions for a Solved Problem or a Challenging Research Field?
- The Effects of an Enterprise Resource Planning System (ERP) Implementation on Job Characteristics – A Study using the Hackman and Oldham Job Characteristics Model
- Context Management of ERP Processes in Virtual Communities
Part II - Data Warehousing and Data Utilization
- Distributed Data Warehouse for Geo-spatial Services
- Data Mining for Business Process Reengineering
- Intrinsic and Contextual Data Quality: The Effect of Media and Personal Involvement
- Healthcare Information: From Administrative to Practice Databases
- A Hybrid Clustering Technique to Improve Patient Data Quality
- Relevance and Micro-Relevance for the Professional as Determinants of IT-Diffusion and IT-Use in Healthcare
- Development of Interactive Web Sites to Enhance Police/Community Relations
EAN: 2147483647
Pages: 174
