The Second Wave ERP Market: An Australian Viewpoint
The Second Wave ERP Market An Australian Viewpoint
Overview
Andrew Stein
Victoria University, Australia
Paul Hawking
Victoria University, Australia
Copyright © 2003, Idea Group Inc. Copying or distributing in print or electronic forms without written permission of Idea Group Inc. is prohibited.
Abstract
This chapter presents the market penetration of SAP systems in the Australian market together with an analysis of three mini-case study implementations. The implementations showcase a global rollout, a global consolidation and a "greenfields" small to medium implementation, and present the diverse range of implementations that are occurring in the Australian ERP marketplace. The global ERP industry blossomed in the 1990s, automating back office operations and, in the new century, moves have been made to introduce a "second and third wave" of functionality in ERP systems. Research up-to-date has been limited, especially in the relation to market penetration, of these new "second wave" products in the Australian region. The trend in 2000/01 was for upgrades and restructure in preparation for the move to e-commerce. In 2002, there has been an expanded focus on mysap.com, small to medium enterprises and the expansion into "third wave" products. This chapter looks at the market movement and demographics of companies that have implemented SAP software, the dominant ERP vendor within the Australian marketplace, and will focus on the trends that are impacting the Australian ERP market.
Introduction
ERP sales now represent a significant proportion of total outlays by business on information technology infrastructure. A recent survey of 800 U.S. companies showed that almost half of these companies had installed an ERP system and that these systems were commanding 43% of the company's application budgets (Carlino, 1999a). The global market for ERP software, which was $16.6 billion in 1998, is expected to have a compound annual growth rate of 32%, reaching more than $66 billion in sales by 2003 (Carlino, 1999b), and is estimated to have had 300 billion spent over the last decade (Carlino, 2000). More recent estimates show a slowing in demand for core ERP systems with an increasing emphasis on upgrades and extended functionality "bolted on" existing systems. There are several reasons for this diversification of ERP systems: integration of business processes, need for a common platform, better data visibility, lower operating costs, increased customer responsiveness and improved strategic decision making (Iggulden, 1999). The primary objective of this chapter is to ascertain the level of ERP implementation in Australia and to profile the demographics of the companies that had implemented this software. SAP Australia was chosen as the study vector, as it is reported as dominating the ERP market in Australasia (IDC, 1999). The first phase of the study, as presented in this chapter, provides an analysis of SAP clients in Australasia broken down by industry sector, organisation size, and types of software implemented. The second phase of the study evaluates the ERP modules implemented as per industry sector and organisation size. This helps to identify implementation trends for companies considering implementing an ERP system. The second phase will also present three SAP implementation mini-case studies to highlight the range and type of organisations moving or upgrading in the ERP marketplace.
ERP Market Penetration
Market penetration of ERP systems varies considerably from industry to industry. A recent report by Computer Economics, Inc. stated that 76% of manufacturers, 35% of insurance and health care companies, and 24% of Federal Government agencies already have an ERP system or are in the process of installing one (Stedman, 1999). Over 60% of the U.S. Fortune 1000 companies are using ERP systems and this has resulted in the major ERP vendors targeting small to medium enterprises (SMEs, also known as SMBs) to generate new sales (Stein, 1999; Piturro, 1999). This has seen the development of new implementation methodologies and modifications of ERP systems to reduce implementation complexity and the associated costs. Vendors are also extending beyond their core ERP systems to support web-based applications, e-commerce, and customer-relationship management.
The five leading ERP vendors (SAP, Oracle, Peoplesoft, JD Edwards, and Baan), account for 62% percent of the total ERP market revenue (Carlino, 1999b). SAP is the largest client/server and mainframe ERP software vendor with approximately 39% market share. The company has approximately 27,800 employees and 17,500 customers in 110 countries (SAP, 2002) representing 44,500 installations. Curran and Kellar (1998) sought to establish the extent that SAP software had been adopted by major US companies (see Table 1). Despite the enormous growth in the use of ERP systems, there is very little research associated with these products (Gable & Rosemann, 1999). This lack of research is further exacerbated when applied to the Australasian region.
|
6 out of the top 10 Fortune 500 companies |
7 of the top 10 petroleum companies |
|
7 out of the top 10 most profitable companies |
6 of the top 10 electronics companies |
|
9 of the 10 companies with the highest market value |
8 of the top 10 chemical companies |
|
7 of the top 10 pharmaceutical companies |
8 of the top 10 food companies |
A search of current research literature did not reveal any studies that have attempted to quantify the level of ERP usage in the region. Two proprietary reports have been produced related to ERP usage in Australia, however both of these studies had relatively small samples. The Gartner Group's ERP and FMIS Study (1998) surveyed 3,783 Chief Financial Officers and achieved a valid response rate of approximately 11%. This included only 72 responses from companies that had implemented an ERP system from one of the five leading ERP vendors. Nolan and Norton's SAP Benchmarking Survey (2000) surveyed 270 companies that had implemented SAP's ERP software and achieved a 16% response rate.
SAP Asia Pacific
The managing director (Bennet, 2002) of SAP Australia was quoted recently:
"What we're seeing here now is that Australian … businesses are gradually and steadily rolling out IT systems that will enable them to take advantage of and grab opportunities when the global economy bounces back."
He was reporting on the expansion of mySAP.com licenses in the Asia-Pacific region and the move to "second wave" products. MySAP.com is a new term used to describe SAP's range of products. The term "second wave" refers to the expansion of the existing core R/3 system with either third party "bolt-on" products or SAP new products. Along with the move to added functionality, SAP Australia moved to restructure their internal business units (Bennett, 2001). The Sales area was reorganised into three units: Public Sector & Financial, Telco/ Utilities and Manufacturing/Mining. The Marketing and Alliance areas were merged and all staff received training in customer engagement. These moves were all configured to move the focus from the product to the customer, which seems to take account of the need to build the business through customer retention and value adding, rather than plumbing new markets. One additional market that is being (Bennett, 2001) explored is the small to medium market. In Australia, there are 10,000 small-medium businesses (SMBs) with the subsidiaries of multi-nationals constituting 40% of the SMBs. The further changes impacting upon SAP Australia have a more global impact, with operations being globalised in 2001 and services in 2002.
Research Methodology
The first phase of the study presents the results of an analysis of customer information from SAP Australia. Victoria University is a member of the SAP University Alliance Program. This program was established to develop and deliver ERP education and to promote ERP research in Australasia. In accordance with these guidelines, SAP regularly provided confidential customer data files to the University. The first data file was the customer file that contained information such as client name, contact, implementation date and version details. The second file contained information like name, go-live date and module, which was supplied bimonthly. The two files were combined into a database and cross-referenced with external sources to include financial and other pertinent demographic data pertinent to the enterprises. This data was then loaded in SPSS v10 and analysed with standard statistical measures.
The second phase of the study presents three mini-case studies. Case study research methodology was used as the chapter presents an exploratory look at implications of second wave ERP implementations. Yin (1994, p. 35) emphasises the importance of asking "what" when analysing information systems. Yin goes further and emphasises the need to study contemporary phenomena within real life contexts. Walsham (2000, p.204) supports case study methodology and sees the need for a move away from traditional information systems research methods, such as surveys, toward more interpretative case studies, ethnographies and action research projects. Several works have used case studies (Chan, 2001; Lee, 1989; Benbasat et al., 1987) in presenting information systems research. Cavaye (1995) used case study research to analyse inter-organisational systems and the complexity of information systems. The data collection process included examination of existing documentation, content analysis of email, interview of actors and direct observations.
Results
Customers
A customer according to SAP is an organisation who is using SAP software. In Australia and New Zealand this includes SAP itself, the 17 universities (which are part of SAP University Alliance), SAP implementation partners and the traditional business users of the software. As mentioned previously, SAP has approximately 17,500 customers in 110 countries with 387 SAP customers in the Australasian region. Of these, 329 were based in Australia and 58 in New Zealand. The customers are spread across all industry sectors. SAP uses its own industry sectors to categorise its customers, as illustrated in Table 2. SAP Australia includes additional categories to classify its customers compared to the SAP worldwide figures. Although the worldwide figures have less categories, there is an additional "Other" category (11.9%) which does not appear in the Australasian data. It must be remembered that the worldwide data would include the data for the Australasian region. The major sector where SAP software has been implemented in Australasia is the Public Sector (16.5%). Further analysis of the Public Sector category indicated that SAP customers were predominantly at both the Federal and State government levels with only two customers at the Local government level. At State level, the New South Wales and Queensland Governments are the main customers. The Public Sector category reveals a significant difference between Australasian and SAP worldwide, which could be a reflection of the multiple levels of the Australian political system. Also, each department within the governments is classified as a separate customer by SAP. Anecdotally however, SAP admits that they have a very high market penetration in this sector in the Australasian region compared to the rest of the world. The next highest category in the Australasian figures is the SAP Service Providers (11.4%). SAP, up until recently, considered themselves as a software developer and vendor. They did not consider themselves as software implementers and accordingly formed partnerships with a number of companies to perform this role. These were usually the major accounting and IT consulting companies. The "SAP Service Providers" category includes these implementation partners. It is necessary for these companies to internally install the different versions of the SAP software to provide a development and training environment for their consultants. The figures for this category in the Australasian region are comparable with the worldwide figures (11.4% compared with 10.0%).
|
Industry Sector |
Australasia Customers (N=387) |
World Customers(N=17,583) |
|---|---|---|
|
Sap Public Sector |
16.5% |
3.0% |
|
Sap Service Provider |
11.4% |
10.0% |
|
Sap Consumer Products |
8.3% |
9.7% |
|
Sap High Tech & Electronics |
5.9% |
11.1% |
|
Sap Retail |
5.9% |
6.4% |
|
Sap Chemicals |
5.4% |
8.5% |
|
Sap Higher Education & Research |
5.2% |
0.7% |
|
Sap Utilities |
4.4% |
4.1% |
|
Sap Mining |
4.1% |
[a] |
|
Sap Telecommunications |
2.8% |
3.4% |
|
Sap Media |
2.6% |
2.2% |
|
Sap Engineering & Construction |
2.6% |
9.7% |
|
Primary Metal & Steel |
2.6% |
[a] |
|
Sap Automotive |
2.3% |
5.4% |
|
Sap Banking |
2.3% |
2.0% |
|
Transportation & Storage |
2.3% |
[a] |
|
Sap Oil & Gas |
2.3% |
3.2% |
|
Forest Products & Paper |
2.3% |
2.8% |
|
Sap Pharmaceuticals |
2.1% |
3.1% |
|
Metal Products |
2.1% |
[a] |
|
Building Materials, Clay & Glass |
1.8% |
[a] |
|
Sap Insurance |
1.6% |
1.9% |
|
Textiles Production |
1.3% |
[a] |
|
Sap Aerospace & Defence |
0.8% |
1.5% |
|
Sap Healthcare |
0.5% |
2.4% |
|
[a]SAP worldwide has an "Other" category at 11.9% |
||
The major discrepancy between the Australasian and worldwide figures occurs in the Higher Education and Research category (5.2% and 0.7% respectively). This can be explained by how SAP Australasia classifies its customers. The 17 universities that are part of the SAP University Alliance program in Australasia have been included in this category. These universities receive the software free of any cost, which is in contrast to the three universities within Australia that are using SAP software as a business system. It would appear that the worldwide figures only include universities that have purchased the software. There are approximately 170 universities in the Americas which are part of the SAP University Alliance Program. If they were included in the worldwide figures, then the category percentage would be far higher than its present value (0.7%). This reinforces the assumption that the worldwide figure only includes universities that have purchased the software. SAP produces a pre-configured version of their software designed specifically for the Higher Education and Research sector. However, none of the universities within Australasia have purchased this version, rather opting for the standard version of the SAP software. There are many other discrepancies between the Australasian and worldwide figures, especially in the Engineering & Construction and Healthcare sectors, which cannot be explained at present. This is a potential direction for further research. In the Nolan and Norton (1999) study it was concluded that the majority (55%) of SAP customers were from the Consumer and Industrial Markets classification (Table 3). Even though the study had a smaller sample and was limited to Australian customers, their findings are indicative of the Australasian market when compared with Table 2. The major discrepancy between our analysis and Nolan and Norton's is in the Higher Education sector. This, however, would be for the same reason outlined earlier. The size of the enterprise is an important factor when considering market penetration. Traditionally, SAP was restricted to larger organisations due to its complexity and associated costs. As mentioned, SAP, as well as the other ERP vendors, have developed a number of strategies to reduce implementation costs in an attempt to make their software more affordable to mid-range organisations (Piturro, 1999). The customer data was classified by revenue to provide an indication of the size of companies implementing SAP software. Business Review Weekly (2000) annually produces the BRW1000, which is a ranking by revenue of the largest listed, private, government and foreign enterprises operating in Australia. Using the BRW figures, financial data was obtained for 146 of these companies (Table 4).
|
Industry Sector |
Australia Customers (N=43) |
|---|---|
|
Consumer & Industrial Markets |
55% |
|
Public Sector |
16% |
|
Energy and Natural Resources |
14% |
|
Health Care and Life Services |
5% |
|
Information/Communication/Entertainment |
5% |
|
Financial |
5% |
|
Size $millions |
Customers % |
|---|---|
|
>1000 |
38% |
|
750–1000 |
8% |
|
500–749 |
14% |
|
250–499 |
20% |
|
<250 |
20% |
There was difficulty sourcing data for the remaining companies as they were either public sector organisations (16.5%), universities (5.2%), or subsidiaries of larger companies. Companies using SAP software represent over $205.6 billion in annual revenue. According to Table 3, the majority of companies (60%) had annual revenues over $500 million, which supports the notion that large companies are the dominant market for ERP vendors. However, 40% of the companies had revenues under the $500 million, with the lowest being $58 million. The large percentage of smaller companies reflects the shift in ERP vendors' strategy in recent years to target small to medium enterprises. Future research comparing the date of implementation to the size of the company could further test the effectiveness of this strategy. This will help determine whether market penetration of smaller companies has been a recent occurrence. Previously, figures were presented on market penetration in the Fortune 500 US companies (Curran & Kellar, 1998). Using the BRW1000 list, similar statistics can be produced for Australian companies who have implemented SAP software.
|
The largest 5 employers use SAP |
2 out of top 3 diversified resources companies |
|
3 out of top 5 private companies |
2 out of top 3 diversified industrials companies |
|
4 out of top 5 public companies |
2 out of top 3 energy companies |
|
2 out of top 3 building materials companies |
4 out of top 5 communication companies |
|
3 out of top 5 mining companies |
A recent report identified the top 100 IT users in Australia. Using the SAP customer list it was determined that nine out of the top 12 IT users were SAP customers and 45% of the total list were also SAP users.
Implementations
From 1989 to July 2000, 387 customers implemented or were in the process of implementing SAP software. This does not include update or upgrade implementations. A break down of the initial year of implementation for each customer is included in Table 6.
|
Year |
Number of Implementations |
% |
|---|---|---|
|
1989/94 |
13 |
3.4% |
|
1995 |
28 |
7.2% |
|
1996 |
41 |
10.6% |
|
1997 |
62 |
16.0% |
|
1998 |
109 |
28.2% |
|
1999 |
72 |
18.6% |
|
2000 |
45 |
11.6% |
|
Not specified |
17 |
4.4% |
The data indicates that approximately 65% of companies have had their ERP systems for at least two years. Nolan and Norton (2000) grouped implementations into levels of maturity. They argued that when evaluating costs of an ERP implementation, the company's previous experience with ERP systems should be considered. Their maturity classifications were:
- Beginning - implemented SAP in the past 12 months,
- Consolidating - implemented SAP between one and three years,
- Mature - implemented SAP for more than three years.
Applying the maturity classification to the above data indicates that the majority of Australasian companies are in the Consolidating stage (58.4%), followed by the Mature phase (37.2%), and the Beginning phase (11.6%).
The increasing numbers of implementations leading up to 2000 reflect companies implementing solutions to the Y2K problem. A recent study by the Institute of Management Accountants (2000) found that 64% of companies surveyed had initiated an ERP project to redress their Y2K issues (Krumwiede et al., 2000). This could also partially explain the decrease in implementations after 2000. Additionally the post-2000 decrease would also be due to the introduction of a consumption tax (Goods and Services Tax) in Australia in June 2000. Many organisations would have focused their information technology expenditure on modifying their existing systems to calculate and record this new tax. The data indicated that although there were 387 customers, this represented 711 instances. An instance is a separate implementation of SAP software, usually for the purpose of handling data for a separate company within the overall enterprise or used to support an installation of one of SAP's software solutions. Table 7 provides details of the different SAP products and the number of implementations. SAP has developed two major releases of their ERP software. The first was R/2, which was mainframe based, while R/3, their newer client server based version was released in 1992. In addition to their ERP software, they released a range of products that were referred to as the "second wave" products. These products were basically enhancements to the ERP software. They included Business Information Warehouse (BW), Knowledge Warehouse (KW), Strategic Enterprise Management (SEM), Customer Relationship Management (CRM) and Advanced Planner and Optimisation (APO). SAP recently has grouped its "second wave" products and R/3 with added e-Commerce functionality (Workplace/Portal and Marketplace) and referred to it as mySAP.com.
|
Software |
Pre-2001 Implementations |
Live 2001 Implementations |
User Segment |
Key Market |
|---|---|---|---|---|
|
R/3 |
506 |
N/a |
N/a |
All |
|
CRM |
69 |
29 |
>50 |
AU/NZ |
|
eProc |
56 |
12 |
>50 |
AU/JP/SG |
|
BW |
263 |
110 |
1–20 |
AU/JP |
|
APO |
73 |
15 |
1–20 |
AU/NZ |
|
Workplace |
122 |
31 |
>20 |
AU/Korea |
SAP's major sales in the Australasian region have been its R/3 product. The 506 R/3 implementations represent 374 customers, which indicates that many of these customers are now adding value to their ERP implementation by purchasing the "second wave" products. Even though SAP is attempting to develop new markets for their R/3 product, it would be expected that the sales of the "second wave" products will increase, while sales of R/3 will decrease due to market saturation. It could be argued that the implementation of "second wave" products is a measure of maturity of the ERP implementation. It would be expected that companies would not be implementing any of the "second wave" products until their ERP implementation was fully functional. Therefore, there would be a relationship between a company's experience with SAP R/3 as defined by Nolan and Norton's (2000) maturity classification and the implementation of the "second wave" products. MySAP.com is touted as SAP's eBusiness solution that facilitates back-end and front-end integration.
The "marketplace" component provides a foundation for collaborative eBusiness. The data supplied by SAP will provide a basis for determining the extent of eBusiness solutions implementation by many of the leading companies in Australasia. A direction for future research would be the relationship between levels of maturity as defined by Nolan and Norton and the adoption of eBusiness solutions. Chris Bennett (Bennett, 2001) signalled this move into added functionality when he commented,
"All these wins and conversion programs signal the next stage in the e-commerce environment."
To look at the spread of business activity of SAP Asia-Pacific three case studies are presented: a global roll-out representing a full R/3 with extensive second wave functionality, the national upgrade showing the conglomeration of disparate systems into one R/3 roll-out, and, finally, the SMB roll-out. Each case will show a diversity of implementations, features and impacts.
Mini Case Study 1 The Global Roll Out
In 2001, Cadbury Schweppes instigated project PROBE (Programme Realisation Of Benefits Enabled ERP). This is not just an ERP rollout, but a global project to re-engineer the existing processes and systems to capture expected benefits. The enterprise developed eight guiding principles in a Future Business Process Model (FBPM, see Figure 1). The PROBE global project involves 13,000 users in 27 business units spanning 15 countries. The first rollout was conducted in 19 sites across Australia involving 1,500 users. Countries that were involved included Australia, New Zealand, USA, UK, Sweden, South Africa, Germany, Canada and Belgium, with Price Waterhouse Coopers as the Global implementation partner.
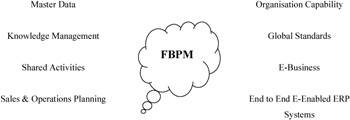
Figure 1: Future Business Process Model (FBPM) (BCO5651, 2002)
The FBPM divides the business into seven areas that are used for the process design (see Figure 2). Each of these areas is decomposed into groups, processes and tasks and then into transactions. The process and data design have produced upwards of 450 flowcharts.
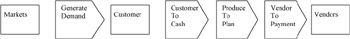
Figure 2: FBPM, process mapping
Once the processes are disassembled they are then analysed and built into a new business process.
The decomposition of existing processes to yield new processes promises to yield major benefits (see Figure 3).
|
Cross functional |
Performance measures included |
|
Integrated |
Job roles included |
|
Finite number of end-to-end scenarios |
Benchmarked on SAP best practice |
|
Consistent, common & routine approach to data |
Benchmarking fully enabled |
Figure 3: Cadbury Schweppes blueprint benefits
This re-engineering process is extensive and Australia was selected as the first go-live before it is to be rolled out world-wide. The choice of Australia as test site is interesting, as the head office is sited in the United Kingdom. The systems to be implemented go from the supply chain to CRM. The implementation follows five tracks (see Figure 4).
|
Program Management |
Go-Live Change Integration Technical Infrastructure Systems Integration Process & Data Design |
Local Implementation |
Figure 4: Five track implementation (BCO5651, 2002)
A variation of ASAP was utilised for implementation with the main phases being Blueprint Input, Blueprint Internalisation, Local Realisation, Final Preparation and Go-live Support. The global roll-out is all-encompassing in scope. The next mini-case looks at a national upgrade for the "Big Australian."
Mini Case Study 2 The Global Consolidation
Broken Hill Proprietary (BHP) is the "Big Australian." For decades, BHP was the largest Australian company and mirrored the resource nature of Australia's economy in the 20th century. In 2001, BHP merged with the UK-based Billiton Corporation to form BHPbilliton, one of the largest resources enterprises in the world. In Australia, BHP had commenced a global consolidation of its ERP systems. Throughout the company (BHP, 2001) there were 27 different ERP systems, including several different ERP platforms operating on a number of hardware platforms. Whilst many of the systems were SAP, they had been implemented differently and master data had been defined differently depending on what industry and country it was to support. This made it very difficult to compare data from the different areas of the company. The new implementation, known as GSAP, would focus exclusively on SAP and be based on common definitions of master data across the company. Added functionality was incorporated in the "upgrade," including knowledge management (KM), advanced planner and optimiser (APO) and business warehouse (BW). All systems are to be hosted on two servers, one based in Australia and the other in America. The scope of the rollout was expected to exceed $AUD200 million. The Billiton Corporation was also a SAP customer before the merger. The common definition of master data developed by BHP and the global consolidation has extended to include the Billiton Corporation. The total project is now expected to exceed $AUD600 million.
Mini Case Study 3 The Greenfields Small to Medium Enterprise
Tyco Flow Control is an Australian-based (SAP, 2002a) subsidiary of Tyco International. The company found that, due to a number of acquisitions over recent years, their manufacturing and corporate systems faced a number of difficulties when providing connectivity between the various business units. The company decided to implement SAP R/3 in its Unistrut division. Unistrut manufactures and markets a wide range of metal framing systems and electrical and mechanical support systems. The scope of the project was to support the full planning cycle from forecasting and budgeting to detailed production scheduling. The company implemented SAP's sales and distribution, production planning and controlling modules, as well as the advanced planning and optimisation (APO) solution. The total cost of the project was $AUD2.5 million. The company found post-implementation a number of benefits, including the reduction of physical inventory, counting to a daily job with no additional person-power from a task, which occurred twice a year involving 15 people over three days.
Discussion
The use of ERP systems in Australasia is well established with many leading companies implementing these types of systems. The companies represent all industry sectors with the Public Sector being most dominant. The companies vary in size and the products implemented. Sales have slowed since 2000 and it will be interesting to follow future sales' trends and directions. Research related to the extent of ERP implementation has been limited. This study into the ERP (SAP) market in Australasia provides a foundation for future research into the adopters of ERP systems. The data that SAP has provided to the university is invaluable and will enable researchers to conduct ongoing research into the various implementation trends associated with these products. Throughout the chapter there are indications of the type of research in progress as an extension of this initial study as well as future directions. These studies, other than contributing to the gamut of knowledge associated with ERP products and information systems, will be a valuable resource to companies considering the implementation of this type of software. It is envisaged that these series of studies will provide benchmarks for various aspects of ERP implementations. Originally, ERP systems were developed to support very large companies in a narrow range of industries. As this market became saturated, the ERP vendors have added functionality to enable them to explore new markets. The data presented in this chapter reflects the diversity of ERP implementations in terms of company size, industry sector and functionality. In the Australasian region many companies are now looking at how to get added benefits from their initial investment in their ERP system. They are increasing the level of functionality offered by their ERP system or implementing some of the "bolt on" solutions such as data warehousing and customer relationship management.
It appears that many companies were pushed down the ERP path by year 2000 compliancy and/or poor disparate systems. These implementations have matured to a certain extent, enabling companies to investigate how they can further leverage their investment in the ERP system. The second wave of implementations are proactive, compared to the reactive nature of initial implementations, and are strategic in nature, forming the basis for future initiatives.
Conclusion
This chapter has presented the emerging market positions of SAP Australia and the necessity to be agile and pursue new markets in order to remake the business. The three emerging markets are the upgrade value adding markets, the "second wave" added functionality market and the small-to-medium market. Further research needs to maintain a focus on the emerging themes of ERP business and to do this it will be necessary to further track new implementations, new products, the success of these new products in the marketplace and the emerging role of implementation partners. Several emerging trends that should be the basis for further study include virtual supply chains, employee self-service modules, employee/enterprise portals, and the ability of these portals to interface SAP and non-SAP systems.
References
BCO5651, (2002). Presentation of Global Rollout, Enterprise Implementation Seminar, Victoria University, April 20th, 2002.
Benbasat, I., Goldstein, D., & Mead, M. (1987). The case research strategy in studies of information systems. MIS Quarterly, 11 (3), 369–386.
Bennett, C. (2001). SAP Update, delivered to ASUG Plenary, December.
Bennett, C. (2002a). SAP expands mySAP.com user base with new contracts and additional licenses. Retrieved May 16, 2002 from http://www.sap.com/australia/company/press/2002/0508.asp.
BHP (2001). BHP SAP Update, delivered to ASUG Plenary, December.
BRW (2000). The BRW1000. Business Review Weekly Retrieved on October 20, 2000 from http://www.brw.com.au/stories/19991113/intro.htm.
Carlino, J. (1999a). AMR research predicts ERP market will reach $66.6 billion by 2003 Retrieved January 7, 2000 from http://www.amrresearch.com/press/files/99518.asp.
Carlino, J. (1999b). AMR research unveils report on enterprise application spending and penetration. Retrieved January 7, 2000 from http://www.amrresearch.com/press/files/99823.asp.
Carlino, J. (2000). AMR research predicts enterprise application market will reach $78 billion by 2004. Retrieved January 8, 2002 from http://www.amrresearch.com/press/files/.
Cavaye, A. (1996). Case study research: A multi-faceted approach for IS. Information Systems Journal, 6 (3), 227–242.
Chan, R., & Roseman, M. (2001). Integrating knowledge into process models: A case study. In Proceedings of the Twelfth Australasian Conference on Information Systems. Southern Cross University, Australia.
Curran, T., & Kellar, G. (1998). SAP R/3 Business Blueprint. Prentice Hall, NJ.
Farley, D. (1998, March). Defining enterprise resource planning. APICS.
Gable, G., & Rosemann, M. (1999, November 1–2). ERP in university teaching & research: An international survey. In Proceedings of the 3rd Annual SAP Asia Pacific Institutes of Higher Learning Forum Maximizing the synergy between teaching, research and business, Singapore.
Gartner Group, (1998, November). ERP and FMIS Study. Sydney: Gartner Group.
IDC (1999). ERP Market Statistics. Sydney: IDC.
Iggulden, T. (Ed.) (1999, June). Looking for Payback. MIS, 75–80
Krumwiede, K. R., & Jordan, W. G. (2000, October 31). Reaping the promise of enterprise resource systems. Institute of Management Accountants. Retrieved August 9, 2000 from http://www.erpsupersite.com/scream/nov/1/sm-20001101a.htm.
Lee, A. (1989). Case studies as natural experiments. Human Relations, 42 (2), 117–137.
Nolan & Norton Institute (2000). SAP Benchmarking Report 2000. KPMG Melbourne.
Piturro, M. (1999, September). How midsize companies are buying ERP. Journal of Accountancy, 188 (3), 41–47.
SAP (2002a). SAP Best Practice Awards. Retrieved October 5, 2002 from http://www.sap.com/.
SAP (2002b). SAP Corporate Profile. Retrieved October 5, 2002 from http://www.sap.com/company/profile_long.htm.
Stedman, C. (1999, August 16). What's next for ERP? Computerworld, 33 (33), 48–49.
Stein, T. (1999, January 4). Big strides for ERP. InformationWeek, 715, 67–69.
Walsham, G. (2000). Globalisation and IT: agenda for research In Organisational and Social Perspectives on Information Technology (pp. 195–210). Boston, MA: Kluwer Academic Publishers.
Yin, R. (1994). Case study research, design and methods, (2nd edition). Newbury Park: Sage Publications.
Part I - ERP Systems and Enterprise Integration
- ERP Systems Impact on Organizations
- Challenging the Unpredictable: Changeable Order Management Systems
- ERP System Acquisition: A Process Model and Results From an Austrian Survey
- The Second Wave ERP Market: An Australian Viewpoint
- Enterprise Application Integration: New Solutions for a Solved Problem or a Challenging Research Field?
- The Effects of an Enterprise Resource Planning System (ERP) Implementation on Job Characteristics – A Study using the Hackman and Oldham Job Characteristics Model
- Context Management of ERP Processes in Virtual Communities
Part II - Data Warehousing and Data Utilization
- Distributed Data Warehouse for Geo-spatial Services
- Data Mining for Business Process Reengineering
- Intrinsic and Contextual Data Quality: The Effect of Media and Personal Involvement
- Healthcare Information: From Administrative to Practice Databases
- A Hybrid Clustering Technique to Improve Patient Data Quality
- Relevance and Micro-Relevance for the Professional as Determinants of IT-Diffusion and IT-Use in Healthcare
- Development of Interactive Web Sites to Enhance Police/Community Relations
EAN: 2147483647
Pages: 174
