Reporting with Rave
Overview
Database applications let you view and edit data, but quite often their output should be physically printed to paper. Technically, Delphi supports printing in many different ways, from direct text output to the use of the printer Canvas, from sophisticated database reporting to the generation of documents in various formats (from Microsoft's Word to Sun's OpenOffice). In this chapter we'll focus exclusively on reports and in particular on the use of the third-party reporting Rave engine included in Delphi 7. If you are interested in other Delphi techniques for driving the printer, see the related material on my website (discussed in Appendix C, "Free Companion Books on Delphi").
Reporting tools are important because they can perform complex processing by themselves: the reporting subsystem can become a stand-alone application. Although this chapter focuses on how you can produce a report from the dataset within your Delphi programs, you should always keep in mind the autonomous nature of reports evaluating such a tool.
Reports must be created with care, because they represent a user interface for your applications that goes beyond and is sometimes more significant than the software itself. Many more people will probably look at the printed reports than just the users who produce the reports using the programs. For this reason, it's important to have good-quality reports and a flexible architecture to let users customize them.
| Note |
This chapter was written with the help of Jim Gunkel of Nevrona Designs, the company that developed the Rave engine. |
Introducing Rave
Reports are a primary means of retrieving information from the data being managed by an application. To solve the problems associated with presenting a visual report of data in a meaningful and informative manner, traditional visual reporting applications have offered banded layout tools geared toward table-style data listings. Today, however, more complex reporting requirements exist that are not easily handled by banded layout tools.
Rave Reports is a visual report design environment offering many unique features that help make the reporting process simpler, quicker, and more efficient. Rave can handle a wide variety of report formats and includes advanced technologies such as mirroring, to encourage the reuse of report contents for quicker changes and easier maintenance.
This chapter presents a brief introduction to Rave's features. Additional information about Rave can be found in the online Help files, in the PDF documentation on Delphi's CD, in several demo projects, and on the producer's website, www.nevrona.com.
| Note |
A key feature of Rave—and one of the reasons Borland chose it over other solutions—is that it is a completely cross-platform solution you can use on both Windows and Linux. Not only do Rave components integrate with both the VCL and CLX, but the Rave Designer is itself a cross-platform application written in CLX. |
Rave The Report Authoring Visual Environment
To start the Rave visual report design environment, double-click on a TRvProject component dropped on a form or select Tools ® Rave Designer in the Delphi IDE. When you activate this environment, you'll see a window like that shown in Figure 18.1. As you can see, the Rave Designer includes several sections: the Page Designer, Event Editor, Property panel, Project Tree panel, toolbars, Toolbar Palette, and status bar.
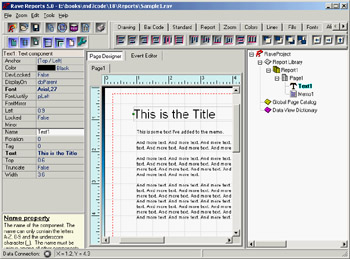
Figure 18.1: The Rave Designer with a simple report
| Note |
Any time you want to see the result of your efforts, press F9 in the Rave Designer for a preview of the current report. |
Keep in mind that Rave allows your end users to create or modify their own reports. You can set the Rave Designer level to Beginner, Intermediate, or Advanced in the Edit ® Preferences dialog box (in the Environment section) so your end users will be working at the level they're comfortable with and won't have more power than you want to give them. You can also lock features of the report so they cannot be modified.
Page Designer and Event Editor
The central portion of the Rave Designer window hosts the Page Designer (where you lay out the report) and the Event Editor (where you can provide scripts to customize the report at run time).
The Page Designer is the most noticeable aspect of Rave. This page is the foundation of a report, where you perform all the designing actions. The page displays a grid pattern, although you can change the look and feel of the page with the preference settings. The names of the current pages being designed appear in the tabs above the Page Designer (Page1 in the figure).
The Event Editor allows you to define custom scripting code for the report components. Each component has several different types of events that can be used for calculations, string manipulation, or custom report logic. The Event Editor is an advanced feature of Rave; I'll cover it briefly at the end of this chapter.
The Property Panel
The Property panel at left in the Rave Designer helps you customize the way components appear or behave. This panel has a role similar to that of Delphi's Object Inspector: When a component is selected on the page, the Property panel reflects the selection by displaying the different properties associated with that component. If no component is selected, the Property panel is blank.
Also as in the Delphi IDE, you can change a property value by editing the contents of the edit box, selecting an option from a drop-down list, or bringing up an editor dialog. You can double-click on any property that has a list of choices (instead of clicking on the down arrow button and selecting the option) to advance to the next item in the list.
The Project Tree Panel
The Project Tree panel on the right side of the designer is very informative. It also provides an easy way to navigate a report project's structure. The Project Tree contains three main nodes: Report Library, Global Page Catalog, and Data View Dictionary:
Report Library Contains all the reports within the project. Each report has one or more pages. Each of those pages will normally include one or more components.
Global Page Catalog Manages reporting templates. The reporting templates can contain one or more components and can then be reused via Rave's mirroring technology. They can include items such as letter headings and footers, pre-printed forms, watermark designs, or complete page definitions that can be the foundation for other reports. You can think of the Global Page Catalog as a repository—a central location for you to store reporting items you want to be able to access from multiple reports.
Data View Dictionary Defines all the data views and other data-related objects for reports.
Toolbars and the Toolbar Palette
As in Delphi, Rave includes two types of toolbars: component toolbars and IDE toolbars. However, unlike in Delphi (which uses the tabbed Component Palette exclusively for components), in Rave you can place either type of toolbar in the open area at the top of the designer or dock them in the tabbed Toolbar Palette. At first this process can be confusing, but after you arrange the toolbars to suit your needs (using the Dock and Undock shortcut menu commands, and not by dragging them as you'd expect) you'll probably find it quite flexible.
The default component toolbars in Rave are Standard, Drawing, Report, and Bar Code. I'll describe the component toolbars in more detail later in this chapter. For the moment, suffice to say that other component toolbars may be present if you've installed add-on packages in the Rave Designer, and that components can be rearranged in the toolbars.
Editor toolbars have the ability to change or modify the project or existing components. Here is summary of the commands they host:
Project Toolbar Similar to a component toolbar, because it lets you create new report, page, and data object components in the report project. The Project toolbar can also be used to create new report projects, save and load existing report projects, and send the current report to the printer or preview.
Alignment Toolbar Has numerous tools for aligning and positioning components on a page. The first component selected often determines the benchmark for an alignment operation. You can change the printing order of components using the order buttons: Move Forward, Move Behind, Bring to Front, and Send to Back. The tap buttons let you move components in very small increments.
Fonts Toolbar Can be used to change font attributes such as Name, Size, Style, and Alignment.
Fills Toolbar Provides the fill style for shapes such as rectangles and circles.
Lines Toolbar Allows you to change the border widths and styles of lines and borders.
Colors Toolbar Determines primary and secondary colors (normally foreground and background, respectively). The left mouse button selects the primary color, and the right mouse button selects the secondary color. Eight custom color boxes are available for commonly used custom colors. Double-clicking on the primary or secondary color box at right on the toolbar opens the Color Editor dialog, which provides additional color selection tools.
Zoom Toolbar Provides many tools that allow the Page Designer to zoom in or out for easier editing.
Designer Toolbar Lets you customize the Page Designer and the Rave Designer through the preferences dialog.
The Status Bar
At the bottom of the Rave Designer is the status bar. The status bar provides information about the direct data view connection status and the mouse position and sizing. The data connection LED's color tells you the status of the Rave data system (DirectDataViews): gray and green indicate an inactive or active connection, respectively; yellow and red indicate specific data access situations (respectively, waiting for response or a time-out).
The X and Y values are the coordinates of the mouse pointer in page units. When you're dropping a component on the page, if you don't release the mouse button, the size of the component will be shown by the dX and dY values (d stands for delta).
Using the RvProject Component
Figure 18.1 shows a trivial Rave report, which is stored in a .rav file. To connect this report to your Delphi 7 application you use the Rave page, which provides a series of components. The central component is RvProject. Place this component on a form or data module, set its ProjectFile property to a Rave file, and write this event handler code for a button:
RvProject1.Execute;
You now have a working application (the RavePrint example among the source code files) that can print a report and that includes an embedded print preview feature, as you can see in Figure 18.2. The referenced file should be distributed separately, and can be modified without having to change the Delphi program. As an alternative, you can also embed the .rav file into the Delphi executable by loading it in the DFM file. To accomplish this, use the StoreRAV property of the Rave project component.
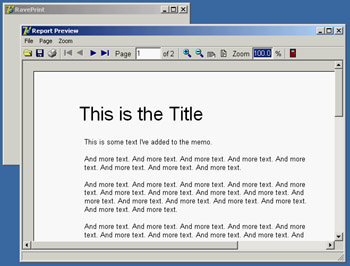
Figure 18.2: The Rave Report Preview window for a report
| Note |
As I mentioned earlier, the RvProject component, as well as all the components available in Rave Reports, can be used in either a VCL or a CLX application. The entire Rave engine is fully cross-platform. |
To control the most important settings of the report and the preview, you can hook an RvNDRWriter or an RvSystem component to the Engine property of the RvProject component:
RvNDRWriter Component Generates an NDR formatted file when the report is executed. NDR formatted files are of a proprietary binary format and store all information needed by the rendering components to reproduce the report in a wide variety of formats.
RvSystem Component Combines the RvNDRWriter component with a standard print, preview, and rendering user interface. Many properties are available to customize the user interface, and override events can be defined to replace the standard dialogs with custom versions.
Rendering Formats
The Rave engine produces an NDR file or stream, generated by the RvNDRWriter. Rave's rendering engine can convert this internal representation to a wide variety of formats. To let a user choose one of the target file formats, drop the desired render components within a form of your Delphi program. When running the RvProject component's Execute method (as in the RavePrint example), you can choose one of the file formats in the dialog box displayed by Rave and visible in Figure 18.3.
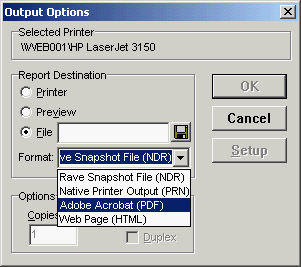
Figure 18.3: After executing a Rave project, a user can choose the output format or rendering engine.
These are the available rendering components on the Rave page of Delphi's Component Palette:
RvRenderPreview Can be used to display an NDR file or stream to the screen. A ScrollBox component is used to display the report pages, and many methods and properties are available to create custom preview dialogs. Unless you need a custom print preview, you should use the RvSystem component for previewing instead of RvRenderPreview.
RvRenderPrinter Sends an NDR file or stream to the printer. Unless you need a custom printing or previewing interface, you do not need to use this component—RvSystem provides standard printing functionality.
RvRenderPDF Converts an NDR file or stream to PDF (Adobe Acrobat) form. You can use properties and events to customize the type of output that is created and to provide compression support.
RvRenderHTML Converts an NDR file or stream to HTML (DHTML) form. Each page is rendered to a separate page and can be combined with templates for greater output control.
RvRenderRTF Converts an NDR file or stream to RTF form. The RTF format uses field areas for accurate positioning and reproduction of the report.
RvRenderText Converts an NDR file or stream to text form. Many graphical commands and components, such as lines and rectangles, are ignored during text rendering.
In addition to letting a user choose a file format in the dialog, rendering can be done programmatically. For example, to convert a report to a PDF file directly, you can write the following code (taken again from the RavePrint example):
procedure TFormRave.btnPdfClick(Sender: TObject);
begin
 RvSystem1.DefaultDest := rdFile;
 RvSystem1.DoNativeOutput := False;
 RvSystem1.RenderObject := RvRenderPDF1;
 RvSystem1.OutputFileName := 'Simple2.pdf';
 RvSystem1.SystemSetups := RvSystem1.SystemSetups - [ssAllowSetup];
 RvProject1.Engine := RvSystem1;
 RvProject1.Execute;
end;
Data Connections
Data connection components provide a link between data contained in a Delphi application and the DirectDataViews available in the Rave Designer. Notice that the value defined in the Name property for each data connection component is used to provide the link with the Rave report. For this reason, take care to avoid changing the component names after the DirectDataViews are created in Rave.
The data connection components are as follows:
RvCustomConnection Provides data to Rave reports using programmed events and can be used to send non-database data to a visual report.
RvDataSetConnection Connects any TDataSet class descendent component to a Rave DirectDataView. Using the FieldAliasList property, you can also modify the names of the dataset fields, replacing them with more legible names for the developers or end users building the report. If you need sorting or filtering for lookups or master-detail relationships within the Rave reports, you can handle the OnSetSort and OnSetFilter events.
RvTableConnection and RvQueryConnection Connect BDE Table and Query components to a Rave DirectDataView. Rave natively provides sorting and filtering support for table connections.
As a first example of how to construct a database-related report, I've created the RaveSingle example, which is an update of the DbxSingle program (built in Chapter 14, "Client/ Server with dbExpress") with a Rave project and a connection:
object RvDataSetConnection1: TRvDataSetConnection
 RuntimeVisibility = rtDeveloper
 DataSet = SimpleDataSet1
end
object RvProject1: TRvProject
 ProjectFile = 'RaveSingle.rav'
end
In the Rave Designer, I created a new project, the file RaveSingle.rav in the RaveSingle folder. To refer to the data exposed by the Delphi program, you need to add a data view by clicking the New Data Object button on the Project toolbar, selecting the Direct Data View option (more details on the other alternatives later), and choosing an available connection. The list you'll see depends on the connections available in the project currently active in the Delphi IDE.
You can now create a report with the help of a wizard. From the Rave Designer menu, choose Tools ® Report Wizards ® Simple Table. Select the data view (you should have only one if you've followed these steps), and in the following window choose the dataset fields you want to include in your report. You should see a report like the one shown in Figure 18.4.
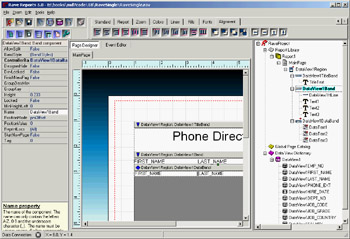
Figure 18.4: The RaveSingle report (generated with the help of a wizard) at design time
As you can see the in the Project Tree, the wizard generated a report page with a Region containing three Band components: one for the title, one for the table header, and a data-aware band for the items. I'll cover the details of using these components in the section "Regions and Bands," later in this chapter; for the moment, I wanted to build and let you experiment with a working example.
Components of the Rave Designer
The previous section discussed the Rave components available in Delphi, because when you use this reporting engine you'll do most of your work in the report designer. The core element of a report (available at the top of the Project Tree view) is the RaveProject component, also called the Project Manager. This is not a component you drop on a report, because there is always only one object of this type in every report (as there is one global Application object in a Delphi program).
The RaveProject component is the owner of all the other report components. Like every component in Rave, the Project Manager has properties. To see them, select RaveProject in the Project Tree, and then look in the Property panel. To create a new RaveProject, click the New Project button on the Project toolbar. Doing so will create a new file, as well as the new Project Manager.
Every project can host multiple reports, represented by the Report component. A Report component contains the pages of a report. There can be multiple Reports in one project, and each Report can have multiple Pages. The Page component is the base visual component upon which you can place the report's visual components. You complete the designing and layout of a report here.
In addition to the list of reports available under the Report Library node, a Rave project has a Global Page Catalog, introduced earlier, and a Data View Dictionary. The Data View Dictionary is a detailed list of the data conduits made available by the hosting Delphi application (using the Delphi Rave connection components covered earlier) or activated directly from the report to a database.
You design the report by placing visual components directly on the page or on another container, such as a Band or a Region. Some of these components are not connected with database data—for example, the Text, Memo, and Bitmap components in the designer's Standard toolbar. Other components can be connected with a field in a database table (or are data-aware, to use a Delphi term), such as the DataText and DataMemo components on the Report toolbar.
Basic Components
The Standard toolbar contains seven components: Text, Memo, Section, Bitmap, Metafile, FontMaster, and PageNumInit. Many of the standard components are used frequently when designing reports.
Text and Memo Components
The Text component is useful for displaying a single line of text on the report. It acts like a label that can contain simple text (not data). When placed on the report, the Text box is surrounded by a box that indicates its boundaries.
Memo components are similar to Text components, but they can contain multiple lines of text. When you set the Memo's font, all text in the Memo will have the same font, as in a Delphi Memo component. Once you've entered the text, the Memo box can be resized, and the text within the Memo box will be repositioned accordingly. If text seems to missing from the Memo box after it has been entered in the Memo Editor, resize the box to allow all text to be visible.
The Section Component
The Section component is used to group components, like a Panel in Delphi. It provides advantages such as letting you move all components that form part of the Section with one mouse click, as opposed to making you move each component individually or try to select all components before moving.
The Project Tree is helpful when you're dealing with the Section component. From an expanded node, it is easy to see what components are in each Section, because compound components can form a tree with parent-child relationships.
| Tip |
The Section component is important when you're mirroring, which allows visual design inheritance within your report designs. |
Graphical Components
The Bitmap and Metafile components let you place images in a report. Bitmap supports raster image files with the extension .bmp, and Metafile supports vector image files with the extensions .wmf and .emf. Metafiles are not supported when you use Rave in a CLX application, because they are based on a specific Windows technology.
The FontMaster Component
Each Text component in a report has a Font property. By setting this property, you can assign a specific font to the component. In many cases, it may be useful and necessary to set the same font properties for more than one object. Although you can do so by selecting more than one component at a time, this method has a drawback: You have to keep track of which fonts must be the same typeface, size, and style, which is not an easy task for more than one report.
The FontMaster component lets you define standard fonts for different parts of the report, such as the headers, body, and footers. The FontMaster is a non-visual component (designated by the button's green color), so there will be no visual reference to it on the page (unlike in Delphi); and, like other non-visual components, it can only be accessed using the Project Tree.
Once you've set the FontMaster component's Font property, linking it to a body of text is simple. On the report, select a Text/Memo component, and then use the down arrow button by the FontMirror property in the Property panel to choose a FontMaster link. Any component whose FontMirror property is set to the FontMaster will be affected by and changed to the FontMaster's Font property.
When you set a component's FontMirror property, the component's Font property will be overridden by the FontMaster's Font property. Another side effect of using the FontMaster is that the Font toolbar is disabled when the FontMirror property is set for that component.
There can be more than one FontMaster per page; however, it is good practice to rename FontMaster components to describe their function. You should also locate them on a Global Page, so they can be used by all reports within the project and provide a more consistent typographical layout.
Page Numbers
PageNumInit is a non-visual component that lets you restart page numbering within a Report. Its use is similar to that of other non-visual components. You use PageNumInit when more advanced formatting is required.
For example, consider a customer statement report for a checking account. The account statements customers receive every month may vary in the number of pages. Suppose the first page defines the account summary page layout, the second defines the customer's credits/deposits, and the third defines withdrawals and debits. The first two reports may need only one page; but if account activity is high for a customer, then the withdrawals section may be several pages long. If the user producing the report wants each section's pages numbered individually, the summary and deposits pages should both be marked "1 of 1". If an active customer account has three pages of withdrawals and debits, this section of the statement should be numbered "1 of 3", "2 of 3", and "3 of 3". PageNumInit comes in handy for this kind of page numbering.
Drawing Components
Like the standard components, drawing components aren't related to data. Rave reports can include three components for lines: Generic lines are drawn in any direction and include angled lines; horizontal and vertical lines have a fixed direction. Available geometric shapes include squares, rectangles, circles, and ellipses. You can drop a shape on a report and then move it behind another element. For example, you can place a rectangle around a DataBand, set it so that it is sized to completely fill the band, and then move it behind the other components placed in the band.
Bar Code Components
Bar code components are used to create many different kinds of bar codes in a report. Bar codes are for users who know exactly what they need, you must have background knowledge about bar codes and how they are used. To define a bar code value, go to the Property panel and type the value in the Text property box.
Rave bar codes support includes the following:
- POSTNET (POSTal Numeric Encoding Technique) bar code, specifically used by the U.S. Postal Service
- I2of5BarCode (interleaved 2 of 5), for numeric information only
- Code39BarCode, an alphanumeric bar code that can encode decimal numbers, the uppercase alphabet, and a few special symbols
- Code128BarCode, a high-density alphanumeric bar code designed to encode all 128 ASCII characters
- UPCBarCode (Universal Product Code), which has a fixed length of 12 digits and was designed for coding products
- EANBarCode (European Article Numbering System), which is identical to the UPC but has 13 digits, 10 numeric characters, 2 country code characters, and a check digit
Data Access Objects
In most cases, a report will be based on a data feed, either directly from a database or from a Delphi application. The data might come from a dataset connected to a database or from some internal processing of a Delphi program. When you choose the New Data Object button on the Project toolbar, you'll see the alternatives shown here and described in the following list:
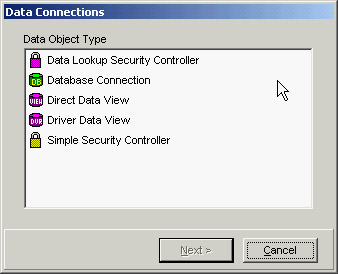
RaveDatabase Component (Database Connection) Provides database connection parameters for the DriverDataView component. Only database connections for which DataLink drivers are installed will be allowed.
RaveDirectDataView Component (Direct Data View) Provides a means to retrieve data from a data connection component located within the hosting Delphi application, as in the last example. (The selection is called Direct Data View even if this is not the direct database connection from the report, but is instead the indirect connection based on data fetched from the database by a hosting application.)
RaveDriverDataView Component (Driver Data View) Provides a means to define a query for a specific database connection using a query language such as SQL. A query builder will be displayed to define the query.
RaveSimpleSecurity Component (Simple Security Controller) Implements the most basic form of security by using a simple list of username and password pairs in the UserList property. UserList contains one username and password pair per line in this format: Username = password. CaseMatters is a Boolean property that controls whether the password is case sensitive.
RaveLookupSecurity Component (Data Lookup Security) Allows username and password pairs to be checked against entries in a database table. The DataView property specifies the DataView to use to look up the username and password. The UserField and PasswordField properties are used to look up the username and the password to verify against.
Regions and Bands
A Region component is a container for Band components. In its simplest form, the Region could be the whole Page component. This would be true for a report that is a list type. Many master-detail reports could be made to fit a single-Region design. However, do not be limited by thinking of a Region as being the entire Page; the properties for a Region deal with its size and location on the Page. Creative use of Regions will give you more flexibility when you're designing complex reports. Multiple Regions can be placed on a single Page; they can be side-by-side, one above the other, or staggered about the Page.
| Tip |
Do not confuse a Region with a Section. Region components contain Bands and only Bands. A Section component can contain any group of components, including Region components, but cannot directly contain Bands. |
When you're working with Bands, you must follow a simple rule: Bands must be in a Region. Notice that the number of Regions on a Page is not limited, nor is the number of Bands within a Region. As long as you can visualize the report mentally, you can use a combination of Regions and Bands to solve any difficulties faced when putting those thoughts into design. There are two band types:
DataBand Used to display iterating information from a DataView. In general, a DataBand will contain several DataText components. A DataBand's DataView property must be set to the DataView component over which it will iterate and will typically contain other data-aware components that operate on that same DataView.
Band Used to print header and footer bands within a Region. Supported header and footer types include Body, Group, and Row; they are selected using the BandStyle property. Page headers and footers are not needed in a Band because you can drop them directly on the page outside the Region component.
ControllerBand is an important property for the Band component. This property determines which DataBand a Band belongs to (or is controlled by). When the controlling DataBand has been set, notice that the graphics symbol on the Band points in the direction of that controlling Band and that the color of the symbols matches. The letter codes shown on the Band are explained in the following section, "The Band Style Editor."
The Band Style Editor
Go to the BandStyle property of a Band or DataBand component and click the ellipsis button to open the Band Style Editor:
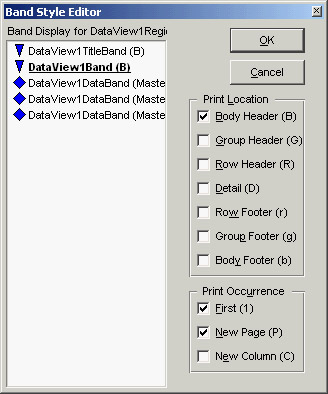
This editor provides a simple method to select the features you want for a Band by using the check boxes. Note that a Band can have several different features active at a time. This means it is possible for a Band to be both a Body Header and Body Footer simultaneously.
The display area in the Band Style Editor is designed to represent the flow of a report in pseudo-layout style. DataBands are duplicated three times to show that they are repeated. The current Band that is being edited is highlighted: Although you see the other Bands in the editor, you can only modify the settings of the current one.
The Band Style Editor uses symbols and letters in the display area and in the Page Layout area (for example, see Figure 18.6) to inform you about each Band's behavior. The major difference between these two representations is that the Band Style Editor display arranges the bands in a pseudo flow according to the definition of each Band. In the Band Style Editor the Bands are arranged according to the logical flow and the order they are placed in the report at design time. The Bands sequence in the report's output is mainly controlled by this order.
Headers (capital letters BGR, which stand for Body, Group, and Row, respectively) will print first, followed by the DataBand, and then the footers (lower case letters bgr) for each level. However, if more than one header is defined for a particular level, then the header Bands are processed in the order they are arranged in the Region. So, it is possible to put all the headers at the top, all the DataBands in the middle, and all the footers at the bottom of a Region for all levels of a master-detail report. Alternatively, you can group each level, with the appropriate headers, footers, and DataBands together for each level. Rave lets you use the Region layout in a way that makes the most sense to the design flow. Just remember that the order of precedence for Bands at the same level is controlled by their order within the Region.
Two symbols show the parent/child or master/detail relationships of the various bands:
- The triangle symbol (up/down arrows) indicates that the band is controlled by a master band with the same color (level), which can be found in the direction of the arrow.
- The diamond symbol represents a master or controlling band.
These symbols are both color-coded and indented to represent the level of master-detail flow. Remember that you can have a master/detail/detail relationship in which both details are both controlled by the same master or one of the details is controlled by the other detail.
Data Aware Components
You can place different data-aware Rave components within a DataBand. The most common choice is the DataText component, used to display a text field from a dataset, as you saw in the RaveSingle example.
Two options are available for entering data in a DataField property. The first is to select a single field using the drop-down list; this approach is fine for normal database reporting where only a single data field for each DataText item may be needed. The second is to use the Data Text Editor.
The Data Text Editor
Many reports require various fields to be combined. Two common examples are city, state, and zip code, or first name and last name combinations. In code, you can accomplish these combinations using statements like the following:
City + ', ' + State + ' ' + Zip
FirstName & LastName
The DataField property has a Data Text Editor, shown in Figure 18.5, which assists you in building composite fields. Click on the ellipsis to open the DataText Editor; it gives you the power to concatenate fields, parameters, or variables to build a complex data-aware text field by selecting items from the list boxes. This editor includes a lot of combinations; I will cover them quickly here, and you can try them in practice.
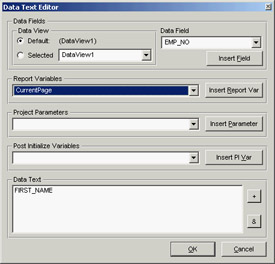
Figure 18.5: The Rave Designer's Data Text Editor
Note that the dialog box is divided into five groups: Data Fields, Report Variables, Project Parameters, Post Initialize Variables, and Data Text. Data Text is the result window: Watch this window when you're inserting items. The two buttons on the right side of this window are plus (+) and ampersand (&). The + button adds two items together with no spaces, and the & button concatenates them with a single space (as long as the previous field was not blank). So, the first step is to decide whether you want to use + or &, and then select the text from one of the three groups above the Data Text window.
The DataText component is not limited to printing database data: You can also use project parameters and report variables. Go to the Report Variables group, look in the list box, note the variables that are available. The Project Parameters list could contain UserName, ReportTitle, or UserOption parameters initialized by the application. To create the list of project parameters, select the Project node in the Project Tree (the top item). Then, in the Properties panel, click the ellipsis button by the Parameters property to open typical string editor, where you can enter the different parameters you want to pass to Rave from the application (such as the UserName).
From Text to Memo
The DataMemo component displays a memo field from a DataView. The main difference between the DataMemo component and the DataText component is that the DataMemo component is used to print text that may require more than one line and will thus need to be wrapped. For example, it could be used to print remarks about a customer at the bottom of each Page of an invoice.
One use for the DataMemo component is mail-merge functions. The easiest way to accomplish this is to set the DataView and DataField properties to the source of the Memo field. Then, launch the Mail Merge Editor by clicking the ellipsis button by the MailMergeItems property. This editor lets you set the items in the Memo that will be changed.
To use the Mail Merge Editor, click the Add button. In the Search Token window, type the item that is in the Memo and that will be replaced. Then, either type the replacement string in the Replacement window or click the Edit button to start the Data Text Editor that will help you select different DataViews and fields.
Calculating Totals
The CalcText component is a data-aware totaling component. The main difference between the DataText component and the CalcText component is that the CalcText component is specially designed to perform calculations and display the results.
The CalcType property determines the type of calculation being performed; values include Average, Count, Maximum, Minimum, and Sum. For example, you can use this component to print the totals of an invoice at the top of each page.
The CountBlanks property determines whether blank field values are included in the Average and Count calculation methods. If RunningTotal is True, then the calculation will not be reset to 0 each time it is printed.
Cycling on Data inside Pages
The DataCycle component is basically an invisible DataBand that adds data-iterating capabilities directly to a Page. This component is useful for form-style reports where using Regions and Band components would be cumbersome. It is important to make sure the DataCycle component appears before any components on the Page that process information from the same DataView.
Advanced Rave
In this long introduction to Rave, you've seen that this reporting system is so complex I could devote an entire book to it. I've already built a couple of examples, and I could continue by showing a master/detail relationship or other reports with a complex structure. However, with the wizards available and the information provided so far, you should be able to build similar examples yourself. So, in this section I'll build only one example of this type, and then provide information about a few relevant features of Rave that aren't easy to understand by trial and error.
| Note |
Among other features of Rave not discussed here is one that allows you to distribute the report designer to end users (to let them customize the reports), either bound to a Delphi program or as a stand-alone tool. Rave also has a server version that allows you to surface reports from a web server. |
| Tip |
You can learn more about these features and other aspects of Rave on Nevrona's website. Specifically, you should browse the tip collection located at www.nevrona.com/rave/tips.shtml. |
Master Detail Reports
To create a master/detail report in Rave, you need two datasets in the corresponding Delphi application, but these datasets don't need to have a master/detail relationship defined in the program—the report can define such a relationship. In the RaveDetails demo program, each of the two datasets is exposed through a Rave connection:
object dsDepartments: TSimpleDataSet
 Connection = SQLConnection1
 DataSet.CommandText = 'select * from DEPARTMENT'
end
object dsEmployee: TSimpleDataSet
 Connection = SQLConnection1
 DataSet.CommandText = 'select * from EMPLOYEE'
end
object RvConnectionDepartments: TRvDataSetConnection
 DataSet = dsDepartments
end
object RvConnectionEmployee: TRvDataSetConnection
 DataSet = dsEmployee
end
The report has two corresponding data views, each connected to a DataBand component (both hosted within a Region). The first DataBand, used for the main dataset, has no special settings. The secondary DataBand defines the master/detail relationship using a few properties. The MasterDataView property refers to the data view of the master dataset, and the MasterKey and DetailKey properties refer to the fields that define the join (in this case, they both refer to the field DEPT_NO). The ControllerBand property refers to the DataBand showing the data of the master dataset.
In case master/details report, the most important settings are managed by the Band Style Editor, where you must set the band as a detail. You can see this editor for the RaveDetails example in Figure 18.6. The master data view's KeepRowTogether property is set to True, to avoid having details end up in a different page than the master.
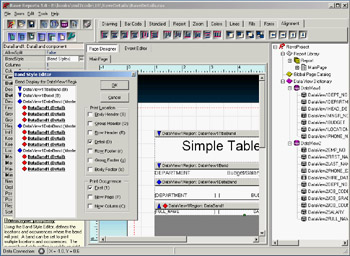
Figure 18.6: The master/detail report. The Band Style Editor appears in front of it.
| Warning |
To create a master/detail report, you may want to use the corresponding wizard available in Rave. In the version shipping with Delphi 7, this wizard doesn't work. At the time of this writing an update to fix this and other issues is still not available. |
Scripting Reports
At the beginning of this chapter I mentioned the Event Editor window of the Rave Designer, but so far I haven't used it. This tool is used to write code (scripts) within a report, responding to events of the various components as you'd do in Delphi. Writing scripts in the Rave Designer allows you to customize, or fine-tune, the output of a report in sophisticated ways. The language Rave uses for the scripts is Pascal based and a variation of the Delphi language, so you should be able to pick it up easily.
The RaveDetails example shows in bold font salaries that are greater than a specified amount. The obvious way to accomplish this is to write scripting code to be executed for each instance of the detail band—that is, for each record in the employee database. Instead of modifying the Font property directly, I decided to add two different FontManager components to the report page and name them to make their role understandable: fmPlainFont and fmBoldFont. You can open the report to see their properties and layout.
In the report, to highlight values outside a given range, you handle the DataText component's BeforePrint event. To do so, move to the Event Editor page, choose the DataText component connected to the Salary field, and select the event. In the event's code editor window, write the following code:
if DataView2Salary.AsFloat > 100000 then
 self.FontMirror := fmBoldFont;
else
 self.FontMirror := fmPlainFont;
end if;
The script changes the FontMirror property of the current object (self) to refer to one of the two FontManager components on the page, depending on the field value. Notice that DataView2Salary is a reference to one of the fields of the data view—the one connected to the current DataText component. Compile the script and run the report to see its effect, shown in Figure 18.7.
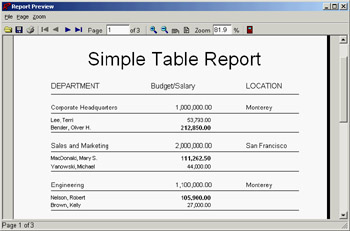
Figure 18.7: The bold text in the report is determined at run time by a script.
| Warning |
Every time you edit a script, remember to click the Compile button; otherwise your changes won't take effect! |
Mirroring
Reporting templates can contain one or more components and can be reused via Rave's mirroring technology. The DataMirrorSection component mirrors other Sections based on the contents of a DataField. The use of mirroring sections allows the DataMirrorSection to be very flexible. Remember that Sections can contain any other component including graphics, regions, text, and so on.
For example, you could use a DataMirrorSection component to make a single report produce different envelope formats for international or U.S. addresses. The template for international customers could include a line for the country have the text centered on the envelope, whereas the U.S. format would not include the country line would offset the text to the right of center and lower on the envelope.
Normally, one of the settings will be defined as the default. If a default is not defined and the field value does not match any of the other settings, then the format used will be the normal contents of the DataMirrorSection component.
Calculations to the Max
In addition to the simple CalcText component discussed earlier, the Rave Designer includes three components for handling more complex situations: CalcTotal, CalcController, and CalcOp.
CalcTotal
The CalcTotal is a non-visual version of the CalcText component. When this component is printed, its value is typically stored in a project parameter (defined by the DestParam property) and formatted according to the DisplayFormat property. It can be useful when you're performing totaling calculations that will be used by other calculations before being printed. If the value of the CalcTotal will only be used by other calculation components, such as CalcOp, you should leave the DestParam property blank.
CalcController
CalcController is a non-visual component that acts as a controller for CalcText and CalcTotal components through their Controller properties. When the controller component is printed, it signals all calculation components that it controls to perform their operation. This process allows a report to recalculate totals on group bands, detail bands, or whole pages depending upon the location of the CalcController component.
The CalcController component can also initialize a CalcText or CalcTotal component to a specific value (through the InitCalcVar, InitDataField, and InitValue properties). The CalcController component will initialize values only if it is used in the Initializer property of CalcText or CalcTotal components.
CalcOp
CalcOp is a non-visual component that allows an operation (defined by the Operator property) to be performed on values from different data sources. The result can then be saved in a project parameter like CalcTotal, as indicated by the DestParam and DisplayFormat properties.
For example, suppose you need to add two DataText components, as in A + B = C (where A and B represent the two DataText component values and C represents the result stored in a project parameter). The three source types have many different values associated with them.
The calculation can start with different types of data sources:
- A DataField source is a field in a table, or a DataView in Rave terms. Thus in order to choose a field, you must first select a DataView.
- For a Value source, you fill in the property with a numeric value.
- A CalcVar source represents another calculation variable; you can choose one from the drop-down menu that lists all the calculation variables available in the page. This value can be from another CalcOp component or from some other calculation component.
After choosing the data sources, you select the operation to be used between them. The Operator property has a drop-down menu you can use to make the appropriate choice. In the example A + B = C, the operator is coAdd.
Sometimes a function needs to be performed on a value before it is processed with the second value. In this case the source's Function property is handy. With a function, you can converted a value (such as hours to minutes), compute a trigonometric function (like the sin of the value), or perform many others calculations (such as a square root or absolute value).
Just as it is important to do the calculations in order, it is important to make sure the components are in order in the Project Tree. A report executes components down the Project Tree. For CalcOp components or any calculation component, this means they must be in the correct order. It is also important to note that if a source value is dependent on any other components (like other CalcOp components or DataText components), those components must come first in the Project Tree.
What s Next?
This chapter has focused using Rave to add reporting capabilities to Delphi applications. I've covered basic reports and data-driven reports, describing both the components you can use in a Delphi application to connect with a report and the components you can use in the report to display data passed by the application. I also touched on some of the more advanced features of Rave, like the use of the Band Style Editor, scripting, mirroring, calculations, and a few others.
If you are looking for more documentation, refer to the PDF files that are available with Delphi but not installed with the product. These manuals and many others are available on the Delphi 7 Companion CD.
This chapter ends the book's coverage of Delphi database technologies, although you'll also use databases in the following part of the book (devoted to Internet and web programming). I'll begin by covering core technologies, such as the use of sockets, and then proceed to HTML generation, traditional Delphi web development, and the use of IntraWeb. I'll then cover the XML and SOAP technologies.
Part I - Foundations
- Delphi 7 and Its IDE
- The Delphi Programming Language
- The Run-Time Library
- Core Library Classes
- Visual Controls
- Building the User Interface
- Working with Forms
Part II - Delphi Object-Oriented Architectures
- The Architecture of Delphi Applications
- Writing Delphi Components
- Libraries and Packages
- Modeling and OOP Programming (with ModelMaker)
- From COM to COM+
Part III - Delphi Database-Oriented Architectures
- Delphis Database Architecture
- Client/Server with dbExpress
- Working with ADO
- Multitier DataSnap Applications
- Writing Database Components
- Reporting with Rave
Part IV - Delphi, the Internet, and a .NET Preview
- Internet Programming: Sockets and Indy
- Web Programming with WebBroker and WebSnap
- Web Programming with IntraWeb
- Using XML Technologies
- Web Services and SOAP
- The Microsoft .NET Architecture from the Delphi Perspective
- Delphi for .NET Preview: The Language and the RTL
- Appendix A Extra Delphi Tools by the Author
- Appendix B Extra Delphi Tools from Other Sources
- Appendix C Free Companion Books on Delphi
EAN: 2147483647
Pages: 279
