Getting Started with Visio 2007
To start a new diagram using a template
|
1. |
On the File menu, point to New, and then click Getting Started. |
|
2. |
In the Template Categories list, click a category, and then in the Template area, double-click the template you want to open. |
To show the shapes on a stencil in the Shapes window
- Click the stencil's title bar.
To add a shape from a stencil to the drawing page
- Drag the shape from the stencil to the drawing page.
To see a shape's shortcut menu
- Right-click the shape.
To zoom in or out of the drawing page
- On the Standard toolbar, click the Zoom down arrow, and then click a zoom percentage.
To zoom out of the drawing page using a keyboard shortcut
- Hold down
 while you right-click once.
To zoom in to the drawing page using a keyboard shortcut
- Hold down while you left-click once.
To zoom in to a selected area on the drawing page using a keyboard shortcut
- Hold down while you drag a selection net around the area you want to zoom in to.
To pan the drawing page
- Hold down while you drag with the right mouse button.
To zoom out of the drawing page to view the whole page using a keyboard shortcut
- Press
 .
.
To insert a page in a drawing file
|
1. |
Right-click a page tab at the bottom of the drawing window, and then click Insert Page on the shortcut menu. |
|
2. |
In the Page Setup dialog box, click OK. |
To change the size of a drawing page
- On the File menu, click Page Setup.
To view a page in a drawing file
- Click a page tab at the bottom of the drawing window.
To rename a page
|
1. |
Double-click the page tab for the page you want to rename. Or, right-click the page tab and then click Rename Page. |
|
2. |
Type the new page name to replace the old one. |
To open or close the task pane
- On the View menu, click Task Pane.
To see a specific task pane
- Click the task pane title bar, and then click the name of the task pane.
To preview a drawing before you print it
- On the File menu, click Print Preview.
To close the Print Preview window
- On the Print Preview toolbar, click Close.
To print a drawing from the Print Preview window
- On the Print Preview toolbar, click Print.
To print the current drawing page
- On the Standard toolbar, click the Print Page button.
To print a diagram
|
1. |
On the File menu, click Print. |
|
2. |
Choose the options you want, and then click OK. |
To change the drawing page size to match the printer's settings
|
1. |
On the File menu, click Page Setup. |
|
2. |
Click the Page Size tab, select the Same as printer paper size option, and then click OK. |
To change the printed page settings to match your diagram
|
1. |
On the File menu, click Page Setup. |
|
2. |
Click the Print Setup tab, and then in the Printer paper area, select the option that matches the preview of the drawing page shown in the preview area of the dialog box, and then click OK. |
To save a drawing file for the first time
|
1. |
On the Standard toolbar, click the Save button. Or, on the File menu, click Save. |
|
2. |
In the File name box, type a name for the drawing file. |
|
3. |
Click Save. |
To enter properties about a drawing file
|
1. |
On the File menu, click Properties. |
|
2. |
Enter the information you want, and then click OK. |
To save a drawing as an image you can use on the Web
|
1. |
On the Standard toolbar, click the Save button. |
|
2. |
In the Save As dialog box, in the Save as type box, scroll the file list to see the available file formats, such as JPEG File Interchange Format (*.jpg). |
To open a Visio drawing file
- On the File menu, click Open, find the diagram you want to open, and then click OK.
To hide or show the rulers
- On the View menu, click Rulers.
To hide or show the grid on the drawing page
- On the View menu, click Grid.
To display the Pan & Zoom window
- On the View menu, click Pan & Zoom Window.
To zoom in on a portion of the drawing page using the Pan & Zoom window
- Drag to draw a selection rectangle around
To turn autohide on or off for a window
- On the title bar of the window, click the AutoHide button, and then move the pointer away from the window.
To show a window that's been automatically hidden
- Point to the window's title bar.
To open a stencil
- On the Standard toolbar, click the Shapes button, point to a category, and then click the stencil you want to open.
To see a stencil's menu
- On the stencil title bar, click the stencil icon in the upper left corner.
To change how shapes appear on a stencil
|
1. |
On the stencil title bar, click the stencil icon in the upper left corner. |
|
2. |
Point to View, and then click Icons and Names, Names Under Icons, Icons Only, Names Only, or Icons and Details. |
To close a stencil
- On the stencil title bar, click the stencil icon in the upper left corner, and then click Close.
To customize various aspects of the Visio environment
- On the Tools menu, click Options.
To see sample diagrams for several diagram types in Visio Professional 2007
|
1. |
On the File menu, point to New, and then click Getting Started. |
|
2. |
In the Template Categories list, click Samples. |
To find answers to your questions by using keywords
|
1. |
Type a keyword in the "Type a question for help" box on the Visio menu bar, and then press the |
|
2. |
In the list of topics that appears, click a topic. |
 key.
key.To browse the Visio Help topics
- On the Help menu, click Microsoft Office Visio Help to show the Visio Help window.
To find information on each option in a dialog box
- In a dialog box, click the Help button in the lower-left corner of the dialog box.
To find information on Microsoft Office Online
- On the Help menu, click Microsoft Office Online.
Adding Shapes to Diagrams
To select a shape
- Click the shape.
To deselect a shape
- Click a blank area of the drawing page or pasteboard, or press the
 key.
key.
To determine what a control handle does
- Pause the pointer over the control handle until its ScreenTip appears.
To add text to a shape
- Select the shape, and then type.
To correct a misspelled word
- Right-click the word, and then click the correct spelling on the shortcut menu.
To exit the text mode
- Click a blank area of the drawing page or pasteboard, or press the key.
To modify existing text
- On the Standard toolbar, click the Text Tool button, click the text block you want to modify, and then select only the text you want to modify.
To change the size of all the text in a shape or text-only shape
|
1. |
Select the shape or text-only shape. |
|
2. |
On the Formatting toolbar, click the Font Size down arrow, and then click a font size. |
To add a text-only shape to the drawing page
- On the Standard toolbar, click the Text Tool button, click in the location on the drawing page where you want the text, and then type.
To save changes to a drawing file
- On the Standard toolbar, click the Save button.
To resize a shape
- Select a shape, and then drag one of its selection handles.
To move a shape
- Drag the shape.
To select more than one shape at once
- Hold down the
 key while you click the shapes you want to select.
To move multiple shapes at one time
- Select the shapes you want to move, and then drag them to the new location.
To constrain the direction of shape movement horizontally or vertically
- Hold down the key while you drag one or more shapes.
To nudge a shape
- Select a shape, and then use the arrows on the keyboard to move the shape horizontally or vertically.
To rotate a shape
- Select the shape, and then drag its rotation handle in either direction.
To copy a shape and position the copy in one action
|
1. |
Hold down the |
|
2. |
Release the mouse button, and then release the |
 key while you drag a shape.
To flip a shape horizontally or vertically
- On the Shape menu, point to Rotate or Flip, and then click Flip Horizontal or Flip Vertical.
To subselect a shape in a group
- Select the group, and then click the shape within the group.
To add text to a shape in a group
- Select the group, click the shape within the group, and then type.
To change the color of a shape in a group
|
1. |
Select the group, and then click the shape within the group. |
|
2. |
On the Formatting toolbar, click the Fill Color down arrow, and then click a color. |
To find a shape for a diagram by using a keyword and then add it to the drawing page
|
1. |
In the Shapes window, in the Search For Shapes box, type the keyword, and then click the arrow to the right of the Search For Shapes box. |
|
2. |
From the new stencil that appears in the Shapes window, drag the shape onto the drawing page. |
To insert a picture created in a different program into a diagram
|
1. |
On the Insert menu, point to Picture, and then click From File. |
|
2. |
Find the picture you want to insert, and then click Insert. |
To change a picture's properties
- On the Picture toolbar, click the button for the property you want to change.
To insert clip art into a diagram
|
1. |
On the View menu, click Task Pane. |
|
2. |
Click the down arrow on the task pane title bar, and then click Clip Art. |
|
3. |
In the Search for box, type a keyword, and then click the Go button to the right of the Search for box. |
|
4. |
From the Search Results task pane, drag the clip art onto the drawing page. |
Formatting Shapes and Diagrams
To change a shape's fill color
|
1. |
Select the shape. |
|
2. |
On the Formatting toolbar, click the Fill Color down arrow. |
|
3. |
Click a color, and then click OK. |
To change a shape's thickness
|
1. |
Select the shape. |
|
2. |
On the Formatting toolbar, click the Line Weight down arrow. |
|
3. |
Click a weight, and then click OK. |
To copy one shape's formatting to another shape
|
1. |
Select the shape that has the formatting you want to copy. |
|
2. |
On the Standard toolbar, click the Format Painter button. |
|
3. |
Click the shape to which you want to copy the formatting. |
To copy one shape's formatting to multiple shapes
|
1. |
Select the shape that has the formatting you want to copy. |
|
2. |
On the Standard toolbar, double-click the Format Painter button. |
|
3. |
Click each shapeone at a timeto which you want to copy the formatting. |
|
4. |
When you are finished, press the |
To select multiple shapes that are close together
- With the Pointer Tool, drag a selection net around the shapes you want to select.
To change a shape's text color
|
1. |
Select the shape. |
|
2. |
On the Formatting toolbar, click the Text Color down arrow. |
|
3. |
Click a color, and then click OK. |
To add a border or title to a diagram
- From the Borders and Titles stencil, drag a border or title shape onto the drawing page.
To add a background to a diagram
- From the Backgrounds stencil, drag a background shape onto the drawing page.
To show the Theme Colors task pane
- On the Format menu, click Theme.
To allow or forbid themes for a shape
- Right-click a shape, point to Format, and then click Allow Themes to check or un-check the option.
To apply a color theme to a drawing
- In the Theme Colors task pane, click a color theme.
To show the Theme Effects task pane
- Click the task pane's title bar, and then click Theme Effects.
To apply an effect theme to a drawing
- In the Theme Effects task pane, click an effect theme.
To apply a color or effect theme to all the pages in a drawing file
- Right-click a theme, and then on the shortcut menu that appears, click Apply To All Pages.
To create a new effect theme
- At the bottom of the Theme Effects task pane, click New Theme Effects.
To create a new color theme
- At the bottom of the Theme Colors task pane, click New Theme Colors.
Connecting Shapes
To AutoConnect shapes by dragging a shape onto the drawing page
- Drag a shape onto another shape on the drawing page, and when blue arrows appear around the shape on the drawing page, position the shape over one of the arrows.
To AutoConnect shapes by clicking a shape on a stencil
|
1. |
Click a shape on a stencil, and then position the pointer over a shape on the drawing page. |
|
2. |
When blue arrows appear around the shape on the drawing page, click one of them. |
To AutoConnect neighboring shapes on the drawing page
|
1. |
Pause the pointer over a shape on the drawing page, and when blue arrows appear around the shape, pause the pointer over the blue arrow closest to the neighboring shape to which you want to connect. |
|
2. |
When the blue arrow turns dark blue, a red box appears around the neighboring shape to which you can connect, and a Connect to Neighboring Shape ScreenTip appears, click the blue arrow to connect the two shapes. |
To connect shapes as you drag them onto the drawing page using the Connector tool
- Click the Connector tool, and then drag shapes onto the drawing page. Each new shape is connected to the selected shape on the drawing page.
To connect shapes that are already on the drawing page using the Connector tool
- Position the pointer over a shape on the drawing page, and then drag to another shape to draw a connector between the two shapes. Or, position the pointer over a shape's connection point, and then drag to another shape's connection point to draw a connector between two shapes.
To connect shapes that are already on the drawing page using the Connect Shapes command
|
1. |
Hold down the |
|
2. |
On the Shape menu, click Connect Shapes. |
To connect shapes that are already on the drawing page using a shape from a stencil
- Drag a connector from a stencil on to the drawing page, position one endpoint on a connection point on one shape, and then position the other endpoint on the connection point on the other shape.
To number the shapes in a flowchart
- On the Tools menu, point to Add-Ons, point to Visio Extras, and then click Number Shapes.
To add text to a connector
- Select the connector, and then type.
To insert a shape between two shapes that are already connected in a flowchart
- Drag the new shape between the two shapes that are already connected.
To delete all the text from a connector
- Select the connector, press
 to open the text block, and then press
  to delete the text.
To delete a connector
- Select the connector, and then press .
To create a point-to-point connection
- With the Connector Tool, point to a connection point on the first shape, and then when a red border appears around the connection point, drag to a connection point on the second shape.
To move a segment of a connector
- Position the pointer over a midpoint on a segment of a connector, and then drag the midpoint.
To change the layout of a flowchart
|
1. |
On the Shape menu, click Configure Layout. |
|
2. |
In the Configure Layout dialog box, in the Placement area, click an option in the Style list. |
|
3. |
Click an option in the Direction list. |
|
4. |
Click OK. |
To center a drawing on the page
- On the Shape menu, click Center Drawing.
To distribute shapes evenly
|
1. |
Select three or more shapes. |
|
2. |
On the Shape menu, click Distribute Shapes. |
|
3. |
In the Distribute Shapes dialog box, click the option you want. |
|
4. |
Click OK. |
To align shapes
|
1. |
Select two or more shapes, making sure the first shape you select is the one you want the others to align with. |
|
2. |
On the Shape menu, click Align Shapes. |
|
3. |
In the Align Shapes dialog box, click the option you want. |
|
4. |
Click OK. |
To display the Action toolbar
- Right-click the toolbar area, and then click Action on the shortcut menu.
Creating Project Schedules
To create a timeline
|
1. |
On the File menu, point to New, point to Schedule, and then click Timeline. |
|
2. |
Drag a timeline shape from the Timeline Shapes stencil onto the drawing page. |
|
3. |
In the Configure Timeline dialog box, set the date range, scale, and format, and then click OK. |
|
4. |
From the Timeline Shapes stencil, drag milestone and interval shapes onto the timeline. |
To add an arrowhead to the right end of the timeline
- Right-click the timeline, and then click Show Finish Arrowhead.
To add interval markers to a timeline
|
1. |
From the Timeline Shapes stencil, drag an interval shape onto the timeline. |
|
2. |
In the Configure Interval dialog box, choose the interval start date, finish date, and date format, type the interval description, and then click OK. |
To add milestones to a timeline
|
1. |
From the Timeline Shapes stencil, drag a milestone shape onto the timeline. |
|
2. |
In the Configure Milestone dialog box, enter the milestone date and description, select a date format, and then click OK. |
To reconfigure the milestone
- Right-click the milestone, and then click Configure Milestone.
To change the milestone type
|
1. |
Right-click the milestone, and then click Set Milestone Type. |
|
2. |
In the Milestone Shape list, click an option, and then click OK. |
To quickly modify the milestone description
- Select the shape, press the key to open the shape's text block, and type a new description.
To add an expanded timeline to the drawing page
|
1. |
From the Timeline Shapes stencil, drag the Expanded timeline shape onto the drawing page. |
|
2. |
In the Configure Timeline dialog box, set the date range, scale, and format, and then click OK. |
To show the percentage complete for an interval marker
|
1. |
Right-click the interval marker, and click Set Percent Complete on the shortcut menu. |
|
2. |
In the Percent Complete box, type the percentage (without the percentage symbol), and then click OK. |
|
3. |
Right-click the interval marker again, and click Show Percent Complete on the shortcut menu. |
To export a timeline
|
1. |
Click the border of the timeline you want to export to select it. |
|
2. |
On the Timeline menu, click Export Timeline Data. |
|
3. |
Follow the instructions on the wizard pages to export the timeline. |
To import timeline data to create a Gantt chart
|
1. |
On the File menu, point to New, point to Schedule, and then click Gantt Chart. |
|
2. |
In the Gantt Chart Options dialog box, click Cancel. |
|
3. |
On the Gantt Chart menu, click Import. |
|
4. |
Follow the instructions on the wizard pages to import the timeline data and create the Gantt chart. |
To create a Gantt chart
|
1. |
On the File menu, point to New, point to Schedule, and then click Gantt Chart. |
|
2. |
On the Date tab, type a number in the Number of tasks box. |
|
3. |
Choose options for Time units, Duration options, and Timescale range, and then click OK. |
|
4. |
Enter task names, start dates, finish dates, and durations in the chart. |
|
5. |
Add tasks and milestones, and then link tasks. |
To create task dependencies
|
1. |
Select two or more tasks in the order of their dependency. |
|
2. |
On the Gantt Chart menu, click Link Tasks. |
To add a column for resource names to a Gantt chart
|
1. |
Right-click a column in the Gantt chart, and then click Insert Column. |
|
2. |
In the Column Type list, click Resource Names. |
|
3. |
Click OK. |
To add a new task to a Gantt chart
- Right-click a cell in the row below the task you want to insert, and then click New Task.
To modify duration information in a Gantt chart
|
1. |
Click the cell that contains the duration you want to change. |
|
2. |
Type the new duration using the following abbreviations: m for minutes, h for hours, d for days, and w for weeks. |
To transform a task into a milestone
- Select the Duration cell for the task, and then type 0.
To change the milestone type for all the milestones in the Gantt chart
|
1. |
On the Gantt Chart menu, click Options. |
|
2. |
On the Format tab, click a milestone in the Shape box, and then click OK. |
Creating Organization Charts
To generate an organization chart from data
|
1. |
On the File menu, point to New, point to Business, and then click Organization Chart Wizard. |
|
2. |
Follow the instructions on the wizard pages to import the organization data and create an organization chart from the data. |
To create an organization chart
|
1. |
On the File menu, point to New, point to Business, and then click Organization Chart. |
|
2. |
From the Organization Chart Shapes stencil, drag the Executive shape onto the drawing page, and then type the name and title of the executive in the shape. |
|
3. |
From the Organization Chart Shapes stencil, drag a Manager shape directly onto the Executive shape, and then type the name and title of the manager in the shape. Repeat this step until you've added all the managers. |
|
4. |
From the Organization Chart Shapes stencil, drag a Position shape onto a manager shape, and then type the name and title of the employee in the shape. Repeat this step until you've added all the employees. |
To add shapes and create the hierarchy for an organization chart
|
1. |
From the Organization Chart Shapes stencil, drag a shape onto another shape on the drawing page, and then type the name and title of the employee. |
|
2. |
Repeat the previous step until you've added all the employees you want. |
To enter names and titles in organization chart shapes
|
1. |
Select an organization chart shape. |
|
2. |
Type the person's name, press the |
|
3. |
Press the |
To open the Shape Data window
- On the View menu, click Shape Data Window.
To see the shape data for a shape in the Shape Data window
|
1. |
On the View menu, click Shape Data Window to open it. |
|
2. |
Select a shape. |
To change a the shape data for a shape or add new data using the Shape Data window
|
1. |
On the View menu, click Shape Data Window to open it. |
|
2. |
Select a shape. |
|
3. |
In the Shape Data window, click the box for the shape data you want to change, and then type to replace or add new data. |
|
4. |
Press the |
To change the information shown in organization chart shapes
|
1. |
On the Organization Chart menu, click Options. |
|
2. |
Click the Fields tab. |
|
3. |
Choose the options you want to display in the various text blocks in organization chart shapes, and then click OK. |
To format the information shown in organization chart shapes
|
1. |
On the Organization Chart menu, click Options. |
|
2. |
Click the Text tab. |
|
3. |
Choose the text formatting options for the various text fields in organization chart shapes, and then click OK. |
To change the layout of organization chart shapes
|
1. |
Select a top-level shape, such as a manager. |
|
2. |
On the Organization Chart toolbar, click a layout option. |
To move a department to a new drawing page and keep it synchronized with the original page
|
1. |
Right-click a manager shape, and then click Create Synchronized Copy on the shortcut menu. |
|
2. |
In the Create Synchronized Copy dialog box, choose the page you want to move the shapes to, and then click OK. |
To add a hyperlink from a shape to another page in the same drawing file
|
1. |
Select the shape, and then on the Insert menu, click Hyperlinks. |
|
2. |
Click Browse next to the Sub-address box. |
|
3. |
In the Page list, click a page, and then click OK. |
|
4. |
In the Description box, type a name for the hyperlink, and then click OK. |
To use a hyperlink to jump from a shape to another drawing page in the same drawing file
- Right-click the shape that includes the hyperlink, and then click the page name on the shape's shortcut menu.
Laying Out Office Spaces
To create an office layout
|
1. |
On the File menu, point to New, point to Maps and Floor Plans, and then click Office Layout. |
|
2. |
From the Walls, Doors and Windows stencil, drag room or wall shapes onto the drawing page to create the office structure. |
|
3. |
From the Walls, Doors and Windows stencil, drag door and window shapes onto wall shapes on the drawing page. |
|
4. |
Add furniture and office equipment by dragging shapes from the stencils onto the drawing page. |
To change the drawing scale
|
1. |
On the File menu, click Page Setup. |
|
2. |
On the Drawing Scale tab, click options in the Pre-defined scale lists, and then click OK. |
To create walls from Space shapes
|
1. |
From the Walls, Doors and Windows stencil, drag Space shapes onto the drawing page. |
|
2. |
With the Space shapes selected, on the Plan menu, click Convert to Walls. |
|
3. |
Select the options you want, and then click OK. |
To add a door to an office layout
- From the Walls, Doors and Windows stencil, drag a Door shape onto a wall shape on the drawing page.
To change the size of a door
|
1. |
Right-click the door shape, and then click Properties. |
|
2. |
In the Door Width list, click a size, and then click OK. |
To reverse the direction in which a door opens
- Right-click the door shape, and then click Reverse In/Out Opening.
To change the direction of the door swing
- Right-click the door shape, and then click Reverse Left/Right Opening.
To add a window to an office layout
- From the Walls, Doors and Windows stencil, drag a Window shape onto a wall shape on the drawing page.
To determine which layers a shape is assigned to
- Select the shape, and then on the Format menu, click Layer.
To lock the shapes on a layer
|
1. |
On the View menu, click Layer Properties. |
|
2. |
Click the box in the Lock column for the layers you want to lock, and then click OK. |
To hide the shapes on a layer
|
1. |
On the View menu, click Layer Properties. |
|
2. |
Click the box in the Visible column for the layers you want to hide, and then click OK. |
To change the color of shapes on a layer
|
1. |
On the View menu, click Layer Properties. |
|
2. |
Click the box in the Color column for a layer. |
|
3. |
In the Layer Color list, click a color, and then click OK. |
To create a new layer
|
1. |
On the Format menu, click Layer. |
|
2. |
In the Layer dialog box, click New. |
|
3. |
In the New Layer dialog box, type the name of the new layer, and then click OK. |
Creating Network Diagrams
To create a network diagram
|
1. |
On the File menu, point to New, point to Network, and then click Basic Network Diagram. |
|
2. |
From the Network and Peripherals stencil, drag a Ring network or Ethernet shape onto the drawing page. |
|
3. |
Drag computer, printer, and other shapes from the stencils onto the drawing page. |
|
4. |
Drag the control handles on the Ring network or Ethernet shape to the network equipment shapes to connect them. |
To connect network equipment to an Ethernet shape
- Drag a control handle from the Ethernet shape to a network equipment shape.
To display the document stencil
- On the Standard toolbar, click the Shapes button, and then click Show Document Stencil.
To edit a master shape on the document stencil
- In the Document Stencil, right-click the master shape, point to Edit Master, and then click Edit Master Shape.
To create a shape data field for a shape on the document stencil
|
1. |
On the View menu, click Shape Data Window. |
|
2. |
On the File menu, point to Shapes, and then click Show Document Stencil. |
|
3. |
Double-click the shape on the document stencil to open the shape editing window. |
|
4. |
Select the shape in the shape editing window. |
|
5. |
Right-click the Shape Data window, and then click Define Shape Data. |
|
6. |
Click New, type a name in the Label box, and then click OK. |
|
7. |
In the Define Shape Data dialog box, click OK. |
|
8. |
In the shape editing window, click the Close Window button. When Visio prompts you to update all instances, click Yes. |
To create a shape data field for a shape
|
1. |
On the View menu, click Shape Data Window. |
|
2. |
Select the shape. |
|
3. |
Right-click the Shape Data window, and then click Define Shape Data. |
|
4. |
Click New, type a name in the Label box, and then click OK. |
|
5. |
In the Define Shape Data dialog box, click OK. |
To run a report
|
1. |
On the Data menu, click Reports. |
|
2. |
In the Report list, click a report, and then click Run. |
|
3. |
Select the format you want, and then click OK. |
To create a new report definition
|
1. |
On the Data menu, click Reports. |
|
2. |
Click New. |
|
3. |
Follow the instructions on the wizard pages to create the report definition. |
|
4. |
In the Reports dialog box, click OK. |
|
Chapter at a Glance 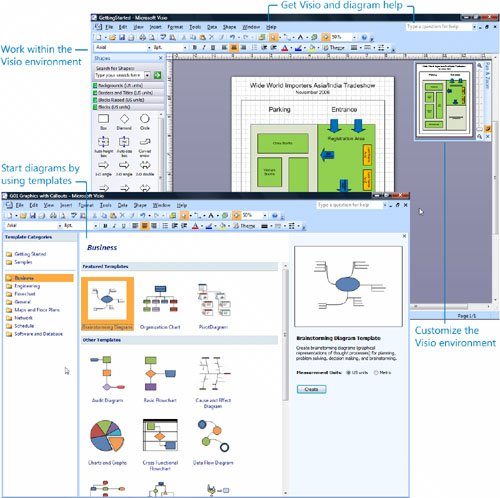
Have you ever tried to do any of the following tasks only to find yourself frustrated with the outcome?
All of these situations are ideal opportunities to use Microsoft Office Visio 2007the business drawing and diagramming program that helps you visually communicate processes, systems, projects, and resources. Visually is the key word. When you can't effectively convey your message verballywith text, tables, or numbers aloneyou need a diagram. With Visio, you can show your audience what you mean by using easy-to-understand diagrams such as organization charts, flowcharts, and project timelines. Whether you need to analyze a new business process, visualize an office space, explore business data, track important data trends, or simply create a map to a company picnic, you can create professional-looking diagrams quickly and easily using Visioand no artistic talent is required. 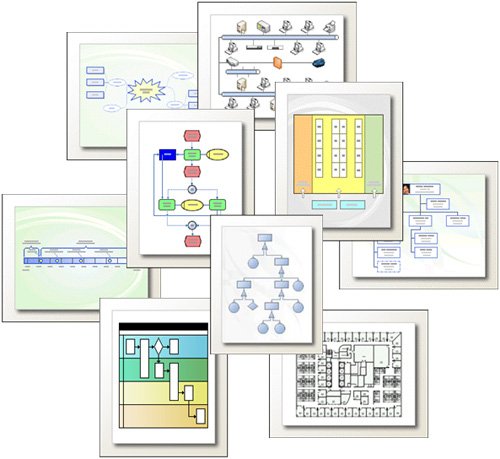
With advanced data connectivity and visualization functionality in Visio Professional 2007, you can even take your diagrams to another level: integrate them with data to track key trends, identify issues, and flag exceptionsall in one diagram that's easy to refresh and share with others across the entire organization. Explore data in hierarchical form using the new PivotDiagram template, identify server issues through data-connected network diagrams, or track resource data in project timelines. Visualize any process, system, project, and resourcein addition to the data behind itby connecting your diagrams to data and dynamically updating them as the data changes. This book helps you learn how to use Visio so that you can communicate visually with Visio diagrams. This chapter will first introduce you to Visio drawing and diagram types, and then show you how to start a Visio diagram by using a template. You will learn how to work within and customize the Visio drawing environment. Last, you will practice using Visio online Help so that you can easily find the answers to questions that might arise while you create your Visio diagrams. Do you need a quick refresher on the topics in this chapter? See the Quick Reference entries on pages xxvxliii.
|
||||||||||||


Quick Reference
Getting Started with Visio 2007
- Getting Started with Visio 2007
- Starting Diagrams by Using Templates
- Working Within the Visio Environment
- Customizing the Visio Environment
- Getting Visio and Diagram Help
- Key Points
Adding Shapes to Diagrams
- Adding Shapes to Diagrams
- Working with 1-D and 2-D Shapes
- Adding Text to Shapes and the Drawing Page
- Moving, Sizing, Rotating, and Copying Shapes
- Working with Groups
- Finding Shapes for Diagrams
- Inserting Pictures into Diagrams
- Key Points
Formatting Shapes and Diagrams
- Formatting Shapes and Diagrams
- Formatting Individual Shapes
- Adding Decorative Elements to Diagrams
- Applying Themes to Entire Diagrams
- Key Points
Connecting Shapes
- Connecting Shapes
- Connecting Shapes in Flowcharts
- Modifying Shape Connections
- Changing the Layout of Connected Shapes
- Key Points
Creating Project Schedules
- Creating Project Schedules
- Creating Timelines to View Projects at a Glance
- Exporting Timelines to Create Gantt Charts
- Tracking Project Details with Gantt Charts
- Key Points
Creating Organization Charts
- Creating Organization Charts
- Importing Data to Create Organization Charts
- Storing and Displaying Employee Information in Organization Charts
- Customizing the Layout of Organization Charts
- Key Points
Laying Out Office Spaces
- Laying Out Office Spaces
- Creating Scaled Office Spaces
- Adding Door, Window, and Furniture Shapes to Office Layouts
- Organizing Shapes in Office Layouts by Using Layers
- Key Points
Creating Network Diagrams
- Creating Network Diagrams
- Connecting Shapes in Network Diagrams
- Storing Information with Network Shapes
- Creating Network Reports
- Key Points
Glossary
About the Authors
Choose the Right Book for You
EAN: 2147483647
Pages: 81
