Creating Timelines to View Projects at a Glance
When you're planning a project, timelines help you visualize the big picture and identify the project's scope. They come in handy when you want to present high-level project information to those who need to view this information at a glance. You can begin creating your timelines during brainstorming sessions and modify them as your project plans develop.
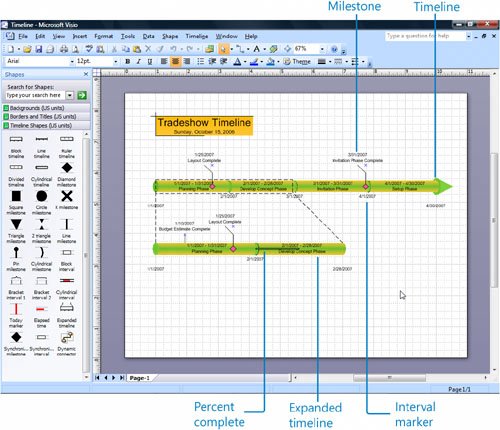
A timeline is a graphic that represents a specific period of time and the events that occur during that period. Timelines are particularly good at showing an overview of a projectproject status, history of events, and what's to come. They also usually include milestones and interval markers.
Your project-schedule diagrams can include one or more timelines on a drawing page, and the timelines can be synchronized. For example, you can use an expanded timeline to represent a segment of the primary timeline, and then work with the expanded timeline individually to show more detail. You can add milestones or intervals to the expanded timeline just as you would to the primary timeline. The items you add to the expanded timeline don't appear on the primary timeline. However, any shape you add to the primary timeline also appears on the expanded timeline and is synchronized with the shape on the primary timeline. Think of the primary timeline as the complete high-level view of events, and the expanded timeline as a more detailed glimpse into a particular portion of that time period. You can use this synchronized timeline method to display various levels of information for one projectall on one pagein easy-to-understand form.
Milestones represent significant events or dates in a schedule, such as the date the building phase of a project is complete. They can highlight dates when you want to evaluate the progress of your project and make necessary decisions or adjustments. Interval markers specify a length of time. Use them to represent the beginning and end of a process or phase. For example, you could use an interval marker to represent the time period of a building phase in a project. You can even show the percentage of the interval that's complete as a line on the interval marker.
Create timelines with the Timeline template by adding shapes that represent milestones and interval markers to a timeline. After you add shapes to the timeline, you can reposition the shapes by dragging them. Visio updates a shape's date according to its position on the timeline. You can also right-click a shape and reconfigure it by clicking the appropriate command on the shape's shortcut menu. Visio repositions the shape on the timeline according to the shape's date.
In this exercise, you create a primary timeline and an expanded timeline. You add interval markers and milestones to both timelines, and then add a title and background to the diagram.
|
1. |
Start Visio. In the Template Categories list, click Schedule. |
||||||||||||
|
2. |
Under All Templates, double-click Timeline. 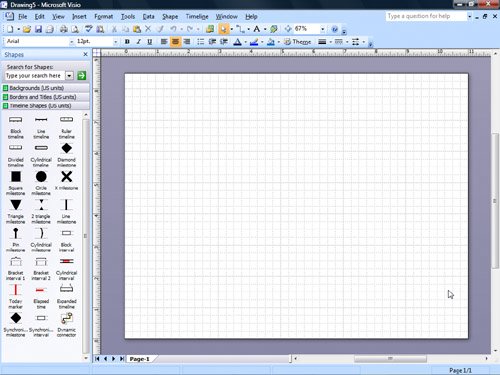
Tip If you already have project data in a Microsoft Project, Microsoft Excel, or text file format, you can import it into Visio by using the Import Timeline Wizard. After you open the Timeline template, drag a timeline onto the drawing page and configure it. Then on the Timeline menu, click Import Timeline Data. Follow the steps in the wizard to import the project data. |
||||||||||||
|
3. |
From the Timeline Shapes stencil, drag a Cylindrical timeline shape onto the drawing page.
|
||||||||||||
|
4. |
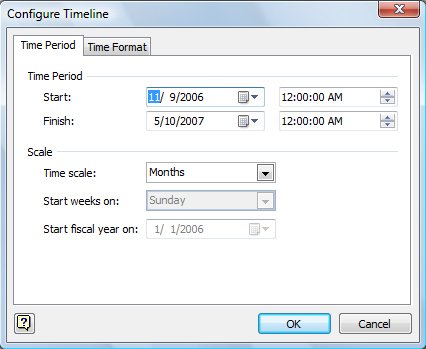
In the Start box, click the down arrow to display a monthly calendar. In the calendar, click the left or right arrow to display the month of January, and then select the start date for the timeline by clicking 1. 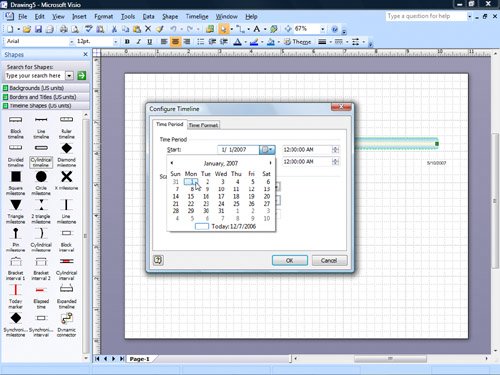
|
||||||||||||
|
5. |
In the Finish box, click the down arrow to display a monthly calendar. In the calendar, click the left or right arrow to display the month of April, select the finish date for the timeline by clicking 30, and then click OK. 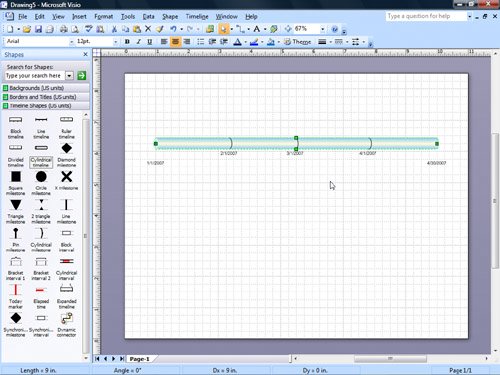
Tip To reconfigure the timeline, right-click it, and then click Configure Timeline on the shortcut menu. Notice the shortcut menu also includes commands for changing the timeline type and date and time formats. |
||||||||||||
|
6. |
On the Format menu, click Theme. |
||||||||||||
|
7. |
In the Apply theme colors list, scroll the theme color list until you see the green Metro theme, and then click it. 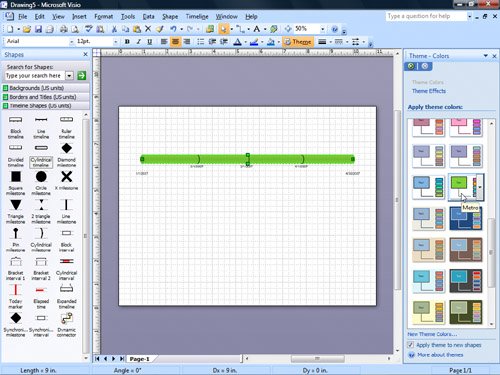
Tip When you pause the pointer over a theme preview, Visio displays its name. |
||||||||||||
|
8. |
To add an arrowhead to the right end of the timeline, right-click the timeline, and then click Show Finish Arrowhead. Tip To change the orientation of a timeline, select the timeline, and then on the Shape menu, point to Rotate or Flip, and click the appropriate command. |
||||||||||||
|
9. |
From the Timeline Shapes stencil, drag a Cylindrical interval shape onto the left area of the timeline.
|
||||||||||||
|
10. |
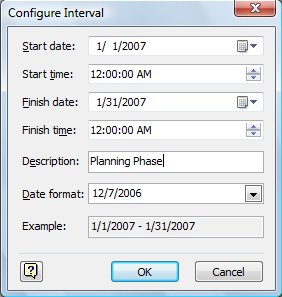
In the Start date box, click the down arrow to display a monthly calendar. In the calendar, click the left or right arrow to display the month of January, and select the start date for the interval by clicking 1. |
||||||||||||
|
11. |
In the Finish date box, click the down arrow to display a monthly calendar. In the calendar, click the left or right arrow to display the month of January, and select the finish date for the interval by clicking 31. |
||||||||||||
|
12. |
In the Description box, select the placeholder text, and replace it by typing Planning Phase.
|
||||||||||||
|
13. |
Click OK. 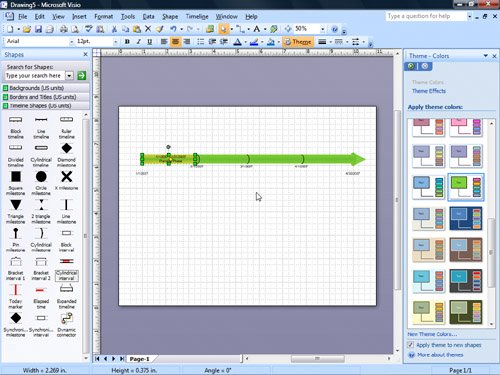
Tip To reconfigure the interval, right-click it, and click Configure Interval on the shortcut menu. To quickly modify the interval description, select the shape, press the |
||||||||||||
|
14. |
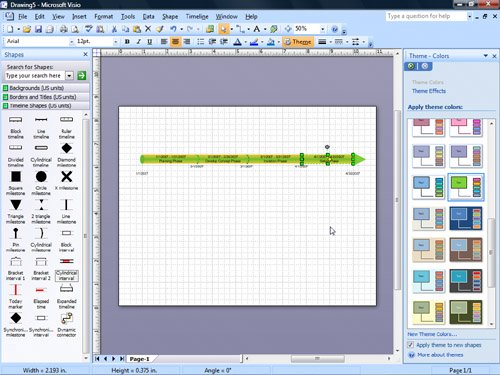
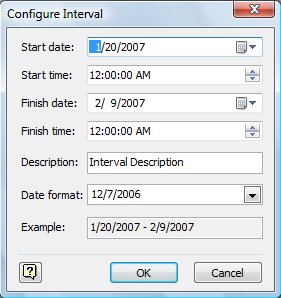
From the Timeline Shapes stencil, drag three more Cylindrical interval shapes onto the timeline and configure them with the information shown in the following table.
|
||||||||||||
|
15. |
From the Timeline Shapes stencil, drag a Diamond milestone shape anywhere on the timeline.
|
||||||||||||
|
16. |
In the Milestone date box, click the down arrow to display a monthly calendar. In the calendar, click the left or right arrow to display the month of March, and select the milestone date by clicking 31. |
||||||||||||
|
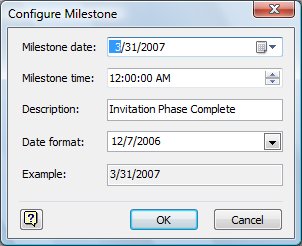
17. |
In the Description box, select the placeholder text, and replace it by typing Invitation Phase Complete.
|
||||||||||||
|
18. |
Click OK. 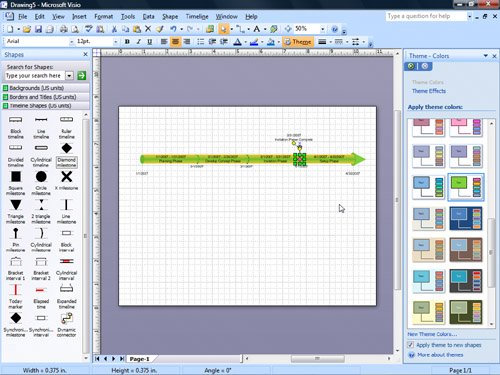
Tip To reconfigure the milestone, right-click it, and click Configure Milestone on the shortcut menu. Notice the shortcut menu also includes commands for changing the milestone type. To quickly modify the milestone description, select the shape, press the |
||||||||||||
|
19. |
From the Timeline Shapes stencil, drag an Expanded timeline shape onto the drawing page and position it below and left-aligned with the primary timeline. |
||||||||||||
|
20. |
In the Start box, click the down arrow to display a monthly calendar. In the calendar, click the left or right arrow to display the month of January, and select the start date for the timeline by clicking 1. |
||||||||||||
|
21. |
In the Finish box, click the down arrow to display a monthly calendar. In the calendar, click the left or right arrow to display the month of February, and select the finish date for the timeline by clicking 28. |
||||||||||||
|
22. |
Click OK. 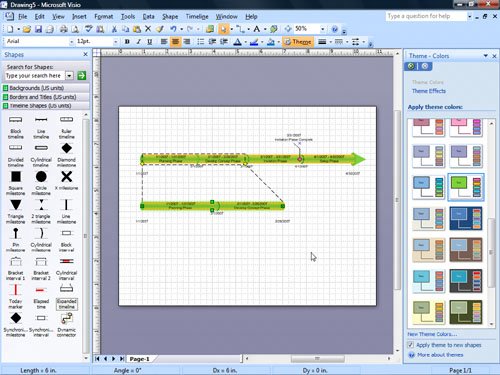
|
||||||||||||
|
23. |
From the Timeline Shapes stencil, drag a Pin milestone shape onto the expanded timeline. |
||||||||||||
|
24. |
In the Milestone date box, click the down arrow to display a monthly calendar. In the calendar, click the left or right arrow to display the month of January, and select the milestone date by clicking 10. |
||||||||||||
|
25. |
In the Description box, select the placeholder text, and replace it by typing Budget Estimate Complete. |
||||||||||||
|
26. |
Click OK. 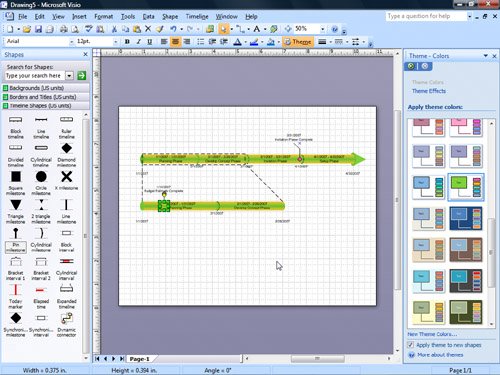
|
||||||||||||
|
27. |
From the Timeline Shapes stencil, drag a Diamond milestone shape onto the primary timeline. |
||||||||||||
|
28. |
In the Milestone date box, click the down arrow to display a monthly calendar. In the calendar, click the left or right arrow to display the month of January, and select the milestone date by clicking 20. |
||||||||||||
|
29. |
In the Description box, select the placeholder text, and replace it by typing Layout Complete. |
||||||||||||
|
30. |
Click OK. 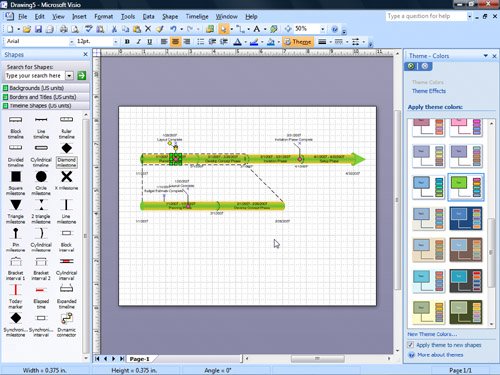
|
||||||||||||
|
31. |
Right-click the Layout Complete milestone on the primary timeline, and click Configure Milestone on the shortcut menu. |
||||||||||||
|
32. |
In the Milestone date box, click the down arrow to display a monthly calendar. In the calendar, select the milestone date by clicking 25, and then click OK. 
|
||||||||||||
|
33. |
Right-click the Develop Concept Phase interval marker on the expanded timeline, and click Set Percent Complete on the shortcut menu. |
||||||||||||
|
34. |
In the Percent Complete box, type 50, and then click OK. |
||||||||||||
|
35. |
Right-click the Develop Concept Phase interval marker on the expanded timeline, and click Show Percent Complete on the shortcut menu. 
|
||||||||||||
|
36. |
To add a title to the diagram, click the Borders and Titles stencil, drag the Title block contemp. shape onto the drawing page, and position it in the upper-left corner of the page. 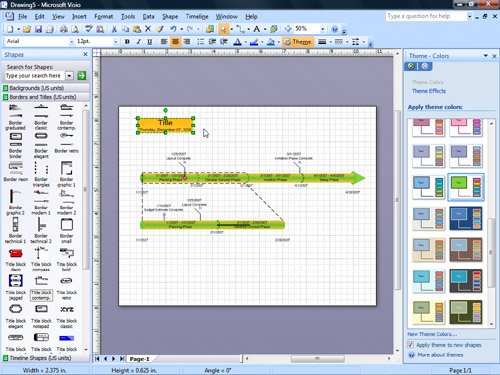
|
||||||||||||
|
37. |
With the Title block contemp. shape selected, press the |
||||||||||||
|
38. |
Highlight the word Title, and type Tradeshow Timeline. |
||||||||||||
|
39. |
Click the pasteboard to close the text block and deselect the title shape. |
||||||||||||
|
40. |
Click the title shape, and drag it to align it with the left edge of the timeline. 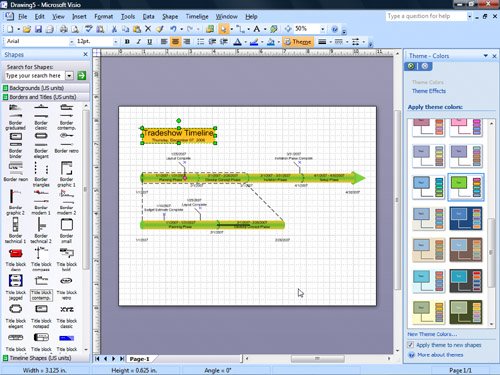
|
||||||||||||
|
41. |
On the File menu, click Save As to open the Save As dialog box. |
||||||||||||
|
42. |
In the File name box, type Timeline, and then click the Save button to save the diagram. |
 key to open the shape's text block, and type a new description. Notice the shortcut menu also includes commands for changing the interval type and showing the percentage of the interval that's complete.
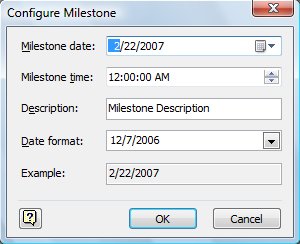
CLOSE the Timeline file.
Tip
For more information about creating timelines, type Timeline in the Type A Question For Help box in the upper-right corner of the Visio window.
Quick Reference
Getting Started with Visio 2007
- Getting Started with Visio 2007
- Starting Diagrams by Using Templates
- Working Within the Visio Environment
- Customizing the Visio Environment
- Getting Visio and Diagram Help
- Key Points
Adding Shapes to Diagrams
- Adding Shapes to Diagrams
- Working with 1-D and 2-D Shapes
- Adding Text to Shapes and the Drawing Page
- Moving, Sizing, Rotating, and Copying Shapes
- Working with Groups
- Finding Shapes for Diagrams
- Inserting Pictures into Diagrams
- Key Points
Formatting Shapes and Diagrams
- Formatting Shapes and Diagrams
- Formatting Individual Shapes
- Adding Decorative Elements to Diagrams
- Applying Themes to Entire Diagrams
- Key Points
Connecting Shapes
- Connecting Shapes
- Connecting Shapes in Flowcharts
- Modifying Shape Connections
- Changing the Layout of Connected Shapes
- Key Points
Creating Project Schedules
- Creating Project Schedules
- Creating Timelines to View Projects at a Glance
- Exporting Timelines to Create Gantt Charts
- Tracking Project Details with Gantt Charts
- Key Points
Creating Organization Charts
- Creating Organization Charts
- Importing Data to Create Organization Charts
- Storing and Displaying Employee Information in Organization Charts
- Customizing the Layout of Organization Charts
- Key Points
Laying Out Office Spaces
- Laying Out Office Spaces
- Creating Scaled Office Spaces
- Adding Door, Window, and Furniture Shapes to Office Layouts
- Organizing Shapes in Office Layouts by Using Layers
- Key Points
Creating Network Diagrams
- Creating Network Diagrams
- Connecting Shapes in Network Diagrams
- Storing Information with Network Shapes
- Creating Network Reports
- Key Points
Glossary
About the Authors
Choose the Right Book for You
EAN: 2147483647
Pages: 81
- Article 225 Outside Branch Circuits and Feeders
- Article 312 Cabinets, Cutout Boxes, and Meter Socket Enclosures
- Article 700 Emergency Systems
- Example No. D1(b) One-Family Dwelling
- Example No. D2(c) Optional Calculation for One-Family Dwelling with Heat Pump(Single-Phase, 240/120-Volt Service) (See 220.82)
