Tuning Query Performance
How queries perform directly affects the system's users. In this section, we will discuss five query-related techniques:
- Query read mode
- Bitmap index
- Statistics for cost-based optimizer
- Partition
- Parallel query option
We do not have enough space to discuss techniques that involve the configuration of hardware and operating system. Refer to the documentation from SAP and hardware vendors to find out more about these strategies.
13.3.1 Query Read Mode
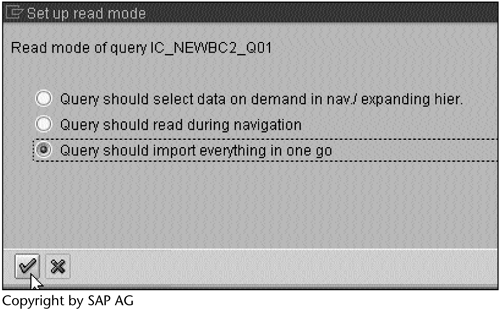
Each query has one of the following three read modes (see Screen 13.25):
- Query should import everything in one go.
In this read mode, when we run the query, the fact table data needed for all possible navigational steps are read into the main memory area of the OLAP processor. Therefore, subsequent navigational steps do not require any additional database reads.
This read mode takes a long time to present the initial query result.
- Query should read during navigation.
In this read mode, when we run the query, the fact table data needed only for the current navigational step are read into the main memory area of the OLAP processor. As a consequence, later navigation steps may need additional database reads. The data for identical navigational states are buffered in the OLAP processor.
If the query involves a hierarchy, the data for the entire hierarchy are read into the main memory area of the OLAP processor.
This read mode is recommended for queries with many free characteristics.
- Query should select data on demand in nav./expanding hier.
In this read mode, when we run the query, if a hierarchy is involved, the data needed only for the current node, such as the EAST region in Screen 5.34, are read into the main memory area of the OLAP processor. As a consequence, additional database reads are needed when expanding a lower-level node.
This read mode is very helpful for a query involving large hierarchies with many nodes. Aggregates should be created at a middle level of the hierarchies, and the start level of the query should be smaller than or the same as this aggregate level.
The procedure used to set the read mode for a query follows.
Work Instructions
Step 1. Run transaction RSRT, select a query from the lookup, and then click  .
.
SCREEN 13.24
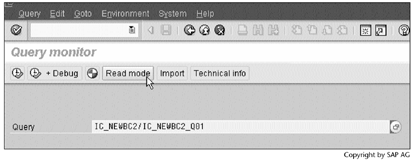
Step 2. Select a read mode for this query, and then click  to save the setting.
SCREEN 13.25
Result
A read mode has been set for the query.
Note
To set a read mode for all queries, select All queries read mode from the Environment menu item from Screen 13.24.
To set a default read mode for future queries, run transaction RDMD.
13.3.2 Bitmap Index
Bitmap indices can dramatically improve query performance when table columns contain few distinct values. The ratio of the number of distinct values to the number of total rows in a table is called its cardinality. A column is a good candidate for a bitmap index when its cardinality is less than 0.01. Otherwise, you should consider using a B-tree index. For this reason, line item dimensions use B-tree indices, whereas other dimensions use bitmap indices.
Table 13.4 gives an example of a bitmap index – in this case, for the IO_SREG column in Table 7.1. It consists of four distinct bitmaps: 1000 for EAST, 0100 for MIDWEST, 0010 for WEST, and 0001 for blank.
| Bitmap Index | ||||
|---|---|---|---|---|
| Region | EAST | MIDWEST | WEST | blank |
| EAST | 1 | 0 | 0 | 0 |
| EAST | 1 | 0 | 0 | 0 |
| EAST | 1 | 0 | 0 | 0 |
| EAST | 1 | 0 | 0 | 0 |
| MIDWEST | 0 | 1 | 0 | 0 |
| MIDWEST | 0 | 1 | 0 | 0 |
| MIDWEST | 0 | 1 | 0 | 0 |
| MIDWEST | 0 | 1 | 0 | 0 |
| MIDWEST | 0 | 1 | 0 | 0 |
| MIDWEST | 0 | 1 | 0 | 0 |
| MIDWEST | 0 | 1 | 0 | 0 |
| MIDWEST | 0 | 1 | 0 | 0 |
| MIDWEST | 0 | 1 | 0 | 0 |
| MIDWEST | 0 | 1 | 0 | 0 |
| WEST | 0 | 0 | 1 | 0 |
| WEST | 0 | 0 | 1 | 0 |
| WEST | 0 | 0 | 1 | 0 |
| WEST | 0 | 0 | 1 | 0 |
| WEST | 0 | 0 | 1 | 0 |
| WEST | 0 | 0 | 1 | 0 |
| 0 | 0 | 0 | 1 | |
| 0 | 0 | 0 | 1 | |
| 0 | 0 | 0 | 1 | |
| 0 | 0 | 0 | 1 | |
When we run a query to display the sales revenue in the EAST and MIDWEST regions, the database will select and summarize sales revenue of all rows that contain the value 1 in the Result column of Table 13.5.
| OR | Result | |
|---|---|---|
| EAST | MIDWEST | EAST OR MIDWEST |
| 1 | 0 | 1 |
| 1 | 0 | 1 |
| 1 | 0 | 1 |
| 1 | 0 | 1 |
| 0 | 1 | 1 |
| 0 | 1 | 1 |
| 0 | 1 | 1 |
| 0 | 1 | 1 |
| 0 | 1 | 1 |
| 0 | 1 | 1 |
| 0 | 1 | 1 |
| 0 | 1 | 1 |
| 0 | 1 | 1 |
| 0 | 1 | 1 |
| 0 | 0 | 0 |
| 0 | 0 | 0 |
| 0 | 0 | 0 |
| 0 | 0 | 0 |
| 0 | 0 | 0 |
| 0 | 0 | 0 |
| 0 | 0 | 0 |
| 0 | 0 | 0 |
| 0 | 0 | 0 |
| 0 | 0 | 0 |
From this example, we make the following observations:
- Logical AND and OR conditions in the WHERE clause of a query can be quickly resolved by performing the corresponding Boolean operations directly on the bitmaps.
- Bitmap indices are small compared with B-tree indices, which reduces the I/O volume.
The procedure to check bitmap indices in BW follows.
Work Instructions
Step 1. Run transaction SE11, display the /BIC/IC_NEWBC2 table definition, and then click  .
.
SCREEN 13.26
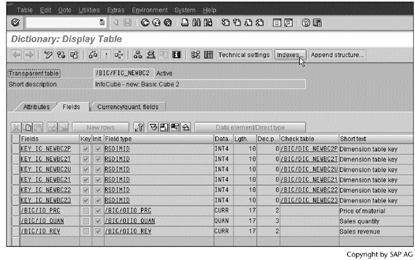
Step 2. The indices for this table are listed. Select the first one, and then click  .
.
SCREEN 13.27
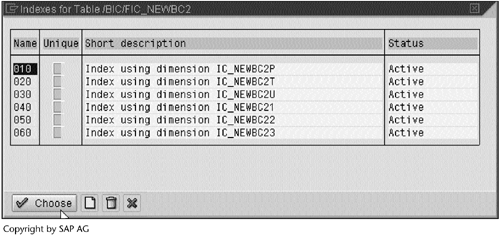
Result
Information about this index appears in Screen 13.28.
SCREEN 13.28
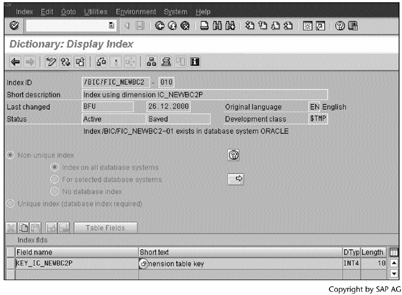
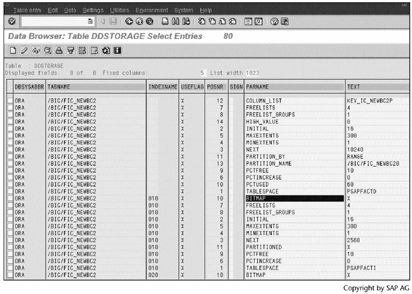
To check the index type, display the contents of the table DDSTORAGE. In Screen 13.29, we see the above index is a bitmap index.
SCREEN 13.29
Note
The same information can be obtained from Screen 13.35 under the folder indexes.
In BW, we cannot change the index type.
13.3.3 Statistics for the Cost-Based Optimizer
The cost-based optimizer decides the most appropriate query execution plan based on available statistical information. For this reason, it is very important to have up-to-date statistical information.
In Section 12.2.2, "Indices and Statistics," we discussed ways to automate the process so as to refresh the statistical information for each new data load. In Screen 12.24 in that section, at the bottom of the DB statistics block, we need to specify a percentage that indicates how much of the InfoCube data will be used to calculate the statistics. The default value is 10.
In addition to this method, BW provides a program called SAP_ANALYZE_ALL_INFOCUBES that gathers statistical information for all tables related to InfoCubes, including master data and aggregates. When running this program, we need to give a percentage, which specifies how much of the InfoCube data will be used to calculate the statistics.
Both methods use an ABAP statement like the following:
IF percentage <= 20%
 ANALYZE TABLE /BIC/FIC_NEWBC2
 ESTIMATE STATISTICS
 SAMPLE 10 PERCENT
 FOR TABLE
 FOR ALL INDEXED COLUMNS
 FOR ALL INDEXES
ELSE
 ANALYZE TABLE /BIC/FIC_NEWBC2
 COMPUTE STATISTICS
 FOR TABLE
 FOR ALL INDEXED COLUMNS
 FOR ALL INDEXES
With this statement, both methods will produce the same statistical information. If the input percentage is less or equal to 20, BW will use 10 percent of the InfoCube data to estimate the statistics. Otherwise, BW will compute the exact statistics.
The biggest drawback of using ANALYZE in both methods is that the statistics will be calculated sequentially. In such a case, the Oracle PL/SQL package DBMS_STATS represents a better choice. Whenever possible, DBMS_STATS calls a parallel query to gather statistics; otherwise, it calls a sequential query or uses the ANALYZE statement. Index statistics are not gathered in parallel.
Refer to the Oracle document "Designing and Tuning for Performance" to obtain more information on database statistics.
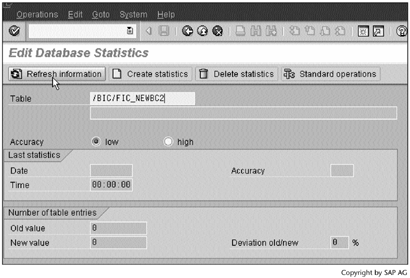
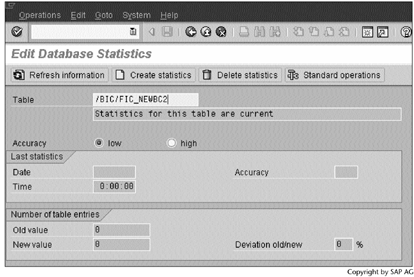
The following procedure checks the status of a table's statistical information.
Work Instructions
Step 1. Run transaction DB20, enter the table name, and then click  .
.
SCREEN 13.30
Result
Screen 13.31 displays the status.
SCREEN 13.31
13.3.4 Partition
A partition is a piece of physical storage for database tables and indices. If the needed data reside in one or a few partitions, then only those partitions will be selected and examined for a SQL statement, thereby significantly reducing I/O volume. This benefit, which substantially improves query performance, is called partition pruning. For a better result, it is recommended that you spread each partition over several disk devices.
Next, let's look at a partition example in BW. We already know how to check the table contents by running transaction SE11. SE11 also tells us how the table contents are stored in the database. The relevant procedure follows.
Work Instructions
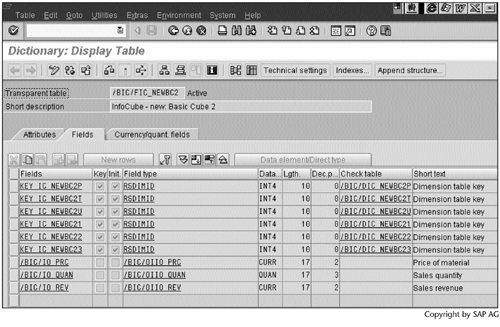
Step 1. Screen 13.32 shows the first SE11 screen for the /BIC/FIC_NEWBC2 table.
SCREEN 13.32
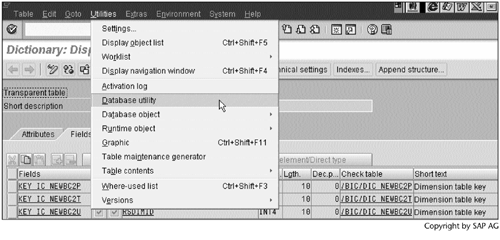
Step 2. Select Database utility from the Utilities menu item.
SCREEN 13.33
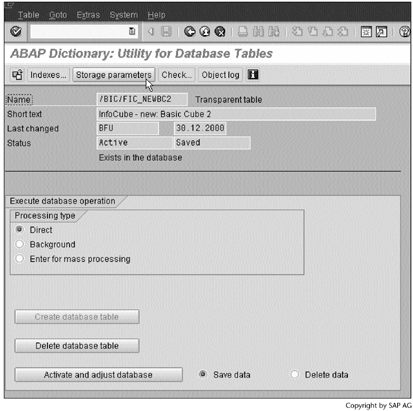
Step 3. Click  .
.
SCREEN 13.34
Result
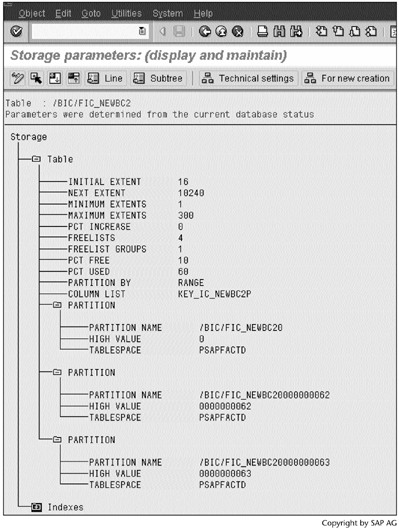
Screen 13.35 indicates that the contents of /BIC/FIC_NEWBC2 are stored in three partitions. The argument used in partitioning the table is column KEY_IC_NEWBC2P. Because the first partition has a HIGH VALUE 0, only the second and third partitions hold data, and each contains the data from one load request.
SCREEN 13.35
With E fact tables, we can partition each table by time. The procedure follows.
Work Instructions
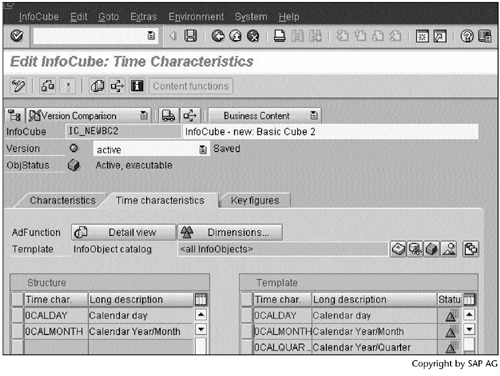
Step 1. After compressing InfoCube IC_NEWBC2, we open its definition.
SCREEN 13.36
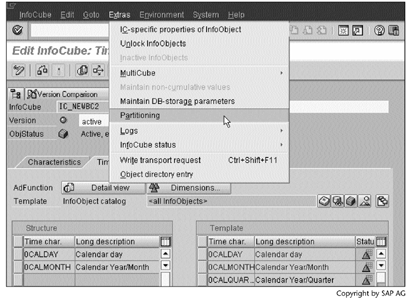
Step 2. Select Partitioning from the Extras menu item.
SCREEN 13.37
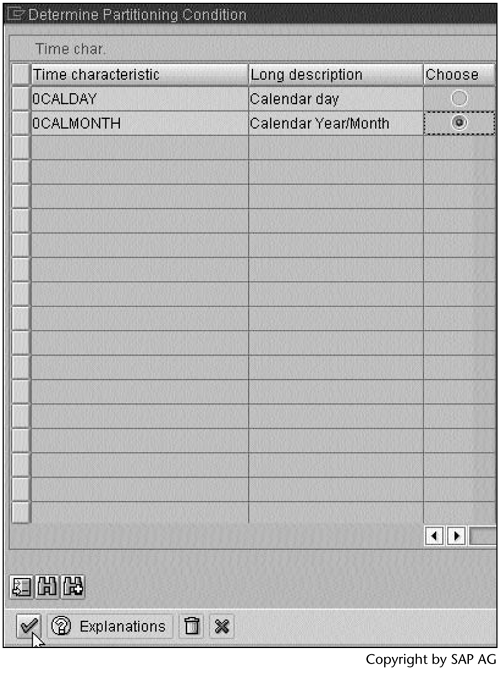
Step 3. Partition the table by calendar month, and then click  to continue.
SCREEN 13.38
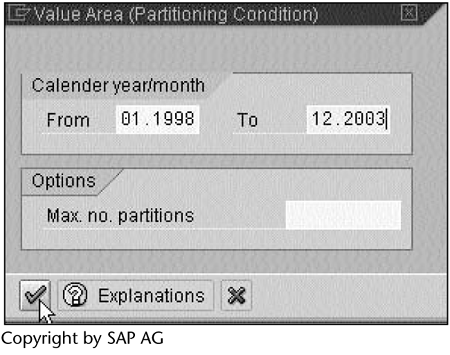
Step 4. Enter a time range in which the data will be partitioned by month, and then click  to execute the partition.
SCREEN 13.39
Result
The E fact table has been partitioned by month.
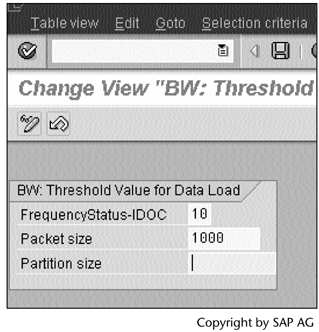
Partitioning not only improves query performance, but also enhances load performance. For this reason, BW allows us to partition PSA tables using a special transaction RSCUSTV6. After running this transaction, we obtain Screen 13.40, in which we specify the number of records after which a new partition will be created. By default, this value is 1,000,000 records.
SCREEN 13.40
13.3.5 Parallel Query Option (PQO)
Parallel processing can dramatically improve query performance when multiple processes work together simultaneously to execute a single SQL statement. The number of parallel processes assigned to the execution is called the degree of parallelism (DOP). The Oracle database determines DOP by following three steps:
- It checks for hints or the PARALLEL clause specified in the SQL statement itself.
- It looks at the table or index definition.
- It checks for the default DOP.
Note
DOP cannot be specified within BW yet. You must use database tools to perform this task.
The Oracle initialization parameter PARALLEL_MIN_SERVERS specifies the number of parallel processes that an instance will have after start-up. A parallel query can obtain additional processes as specified, or they can be set by default. Whichever method is used, the total cannot exceed the value of PARALLEL_MAX_SERVERS. Table 13.6 lists other initialization parameters and their BW and R/3 default values.
| Initialization Parameter | Description |
|---|---|
|
OPTIMIZER_PERCENT_PARALLEL BW default value: 100 |
Specifies how much the optimizer attempts to process a query in parallel. |
| R/3 default value: 0 | The default values in BW and R/3 tell the difference. |
|
PARALLEL_MIN_SERVERS BW default value: 0 |
Specifies the number of parallel processes that an instance will have after start-up. |
| R/3 default value: 0 | |
|
PARALLEL_MAX_SERVERS BW default value: 5 |
Specifies the maximum number of parallel processes at any time. |
| R/3 default value: 5 |
The value 5 may not be large enough for BW, especially for multi-cube queries. As noted in Section 8.2, a multi-cube query is split into multiple subqueries, one for each underlying basic cube. When enough database processes are available, every subquery can be processed in parallel, which means that we can achieve two levels of parallelism. If PARALLEL_AUTOMATIC_TUNING is set to TRUE as recommended by Oracle, PARALLEL_MAX_SERVERS will be set to CPU*10. |
|
PARALLEL_MIN_PERCENT BW default value: 0 |
Specifies the desired minimum percentage of requested parallel processes. |
| R/3 default value: 0 |
For example, if we specify 50 for this parameter, then at least 50% of the parallel processes specified for a query must be available for the parallel execution to start. If the value is set to 0, then a query will be processed in parallel as long as at least two processes are available. |
|
PARALLEL_ADAPTIVE_MULTI_USER BW default value: FALSE R/3 default value: FALSE |
If the value of this parameter is TRUE, Oracle will reduce DOP as the load on the system increases. In BW, because we have only one Oracle user (SAPR3), SAP sets this value to FALSE. |
|
PARALLEL_AUTOMATIC_TUNING BW default value: FALSE |
Oracle recommends a value of TRUE for this parameter |
| R/3 default value: FALSE | When PARALLEL_AUTOMATIC_TUNING is set to TRUE, the database will automatically set all PQO-related specifications, such as DOP, the adaptive multi-user feature, and memory sizing, based on the number of CPUs and the value of PARALLEL_THREADS_PER_CPU. |
|
PARALLEL_THREADS_PER_CPU BW default value: 2 |
Specifies the number of parallel execution processes or threads that a CPU can handle during parallel processing. |
| R/3 default value: 2 | The default value is platform dependent (usually 2) and is adequate in most cases. We should decrease the value of this parameter if the machine appears to be overloaded |
PQO is a database feature. Increasing the CPU power in the application server machines in the SAP Basis 3-tier architecture will not improve database parallel processing, although it may improve OLAP performance.
Do not use PQO on a single-CPU machine.
A server that has already exhausted its CPU or I/O resources will not benefit from PQO.
To achieve optimal performance, all parallel processes should have equal workloads. Skewing occurs when some parallel processes perform significantly more work than the other processes.
PQO works best on partitions that are spread or striped across many disk devices.
Part I. Guided Tours
Business Scenario and SAP BW
- Business Scenario and SAP BW
- Sales Analysis A Business Scenario
- Basic Concept of Data Warehousing
- BW An SAP Data Warehousing Solution
- Summary
Creating an InfoCube
- Creating an InfoCube
- Creating an InfoArea
- Creating InfoObject Catalogs
- Creating InfoObjects Characteristics
- Creating InfoObjects Key Figures
- Creating an InfoCube
- Summary
Loading Data into the InfoCube
- Loading Data into the InfoCube
- Creating a Source System
- Creating an Application Component
- Creating an InfoSource for Characteristic Data
- Creating InfoPackages to Load Characteristic Data
- Checking Loaded Characteristic Data
- Entering the Master Data, Text, and Hierarchy Manually
- Creating an InfoSource for Transaction Data
- Creating Update Rules for the InfoCube
- Create an InfoPackage to Load Transaction Data
- Summary
Checking Data Quality
- Checking Data Quality
- Checking InfoCube Contents
- Using BW Monitor
- Using the Persistent Staging Area (PSA)
- Summary
Creating Queries and Workbooks
- Creating Queries and Workbooks
- Creating a Query Using BEx Analyzer
- Organizing Workbooks Using BEx Browser
- Using a Variable to Access a Hierarchy Node Directly
- Summary
Managing User Authorization
- Managing User Authorization
- Creating an Authorization Profile Using Profile Generator
- Creating an Authorization Object to Control User Access to the InfoCube Data
- Integrating Profile Generator and BEx Browser
- Summary
Part II. Advanced Topics
InfoCube Design
- InfoCube Design
- BW Star Schema
- InfoCube Design Alternative I Time-Dependent Navigational Attributes
- InfoCube Design Alternative II-Dimension Characteristics
- InfoCube Design Alternative III Time-Dependent Entire Hierarchies
- Other InfoCube Design Techniques
- Summary
Aggregates and Multi-Cubes
Operational Data Store (ODS)
- Operational Data Store (ODS)
- Creating an ODS Object
- Preparing to Load Data into the ODS Object, Then into an InfoCube
- Loading Data into the ODS Object
- Loading Data into the InfoCube
- Using 0RECORDMODE for Delta Load
- Summary
Business Content
- Business Content
- Creating an R/3 Source System
- Transferring R/3 Global Settings
- Replicating R/3 DataSources
- Installing Business Content Objects and Loading R/3 Data
- Summary
Generic R/3 Data Extraction
- Generic R/3 Data Extraction
- Creating Views in R/3
- Creating DataSources in R/3 and Replicating Them to BW
- Creating a Characteristic in BW
- Loading Data from R/3 into BW
- Summary
Data Maintenance
Performance Tuning
- Performance Tuning
- BW Statistics
- System Administration Assistant
- Tuning Query Performance
- Tuning Load Performance
- Summary
Object Transport
Appendix A. BW Implementation Methodology
Object Transport
Appendix B. SAP Basis Overview
Object Transport
- Object Transport
- Section B.1. SAP Basis 3-Tier Architecture
- Section B.2. Dispatcher, Work Processes, and Services
- Section B.3. Memory Management
Appendix C. Glossary
Appendix D. Bibliography
EAN: N/A
Pages: 106
