Hack 37. View Your GPS Tracklogs in Google Maps


Plotting your GPS tracklogs on Google Maps allows others to see where you've been.
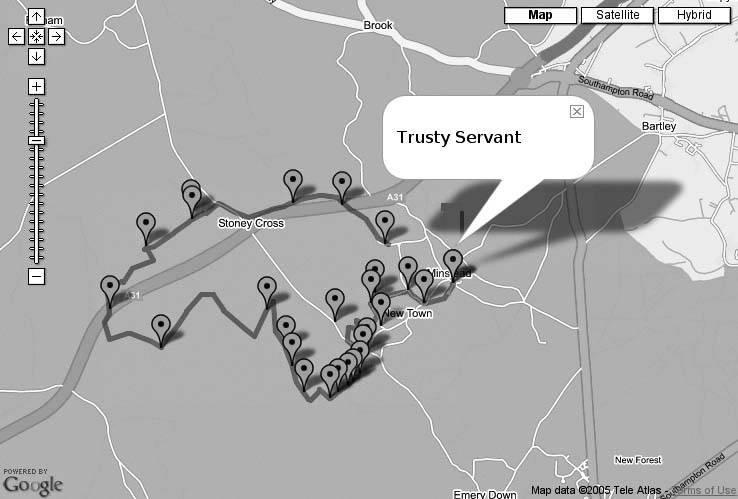
Sharing tracklogs and waypoints from your GPS receiver became a lot easier with the invention of the GPX format, which is an open XML standard that encodes your GPS wanderings to a file readable by many applications. The best waypoints are pubsso why not plot them on Google Maps, as in Figure 4-22?
Figure 4-22. Some waypoints of London pubs, shown in Google Maps
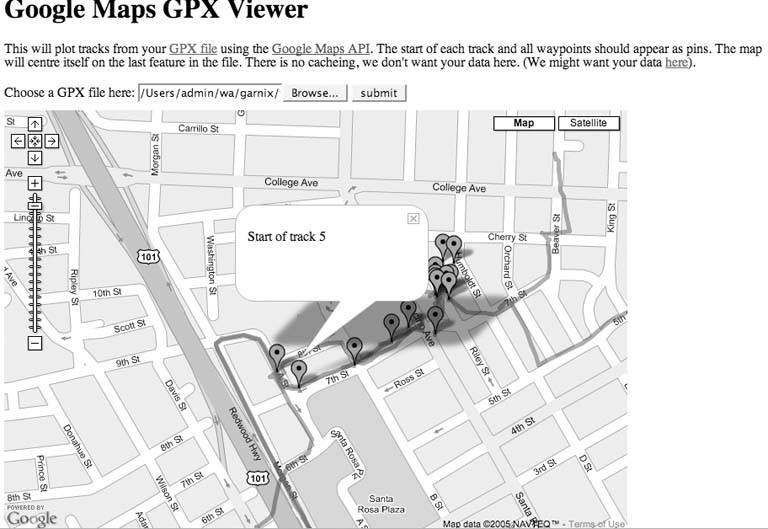
You can go to http://www.tom-carden.co.uk/googlegpx/ and upload your own GPX format file. Any waypoints appear as marker pins, and the start and end of tracks will be marked with pins, as shown in Figure 4-23.
Figure 4-23. A bit of a "derive" captured on the GPX viewer
4.10.1. Processing GPX Tracks to Reduce Complexity
There are several ways to process a GPX file into something Google Maps will understand, and we demonstrate two methods here. Using server-side processing, you upload the file from your browser and process it on your server (in this case using Ruby) and return a script that displays the data. Alternatively, you can put the GPX onto your own server and use some JavaScript to open it, process it on the client side, and pass it to Google Maps. The usual caveats for passing information around in a browser applythere are restrictions on what scripts are allowed to accessbut old friends like the iframe element and new friends like XMLHttpRequest can help us here.
No matter what method you use to process the GPX data, a GPX file will typically contain thousands of pointsfar too many for Google Maps to handle. Why is this? When you display polylines in Google Maps, your vectors are rendered into an image file on Google's servers. The more points, the more time it takes to generate the images. Except this isn't the whole storyGoogle only does this if you aren't using Internet Explorer. IE has a built-in vector language called VML, which renders the vectors very quickly in the browser.
Being fans of Firefox and Mozilla, for us it wasn't good enough to rely on IE. Therefore we thought up a way to selectively choose which points to display so we didn't have too many, yet had enough to show the route without slowing Google down. A seemingly obvious solution would be to simply drop every fifth point to reduce the number of points by 20%but the problem is that one of those ignored points might be the crucial part of a turn or otherwise cause distortions of the route.
Consider another scheme in which points are intelligently dropped on straight lines but not on complex bends. In this scenario, successive points in a straight line add little information to a route and may be forgotten. Points that turn direction quickly would then be kept as they are more important than those that only reinforce a straight line. The key here is determining the amount of change in direction in order to pick those points that should be displayed.
You could simply choose an angle and choose successive points based on whether the path they mapped out deviated more than that angle, and it's a good choice. The problem, however, is that a GPX file may have 1,000 or 10,000 points within it, and these must be mapped down to a sufficiently small number of points to actually plot in both cases because Google Maps can't plot too many. And so we developed an adaptive algorithm that gets a good number of points to display.
Before describing the algorithm, we should be honest and point out that this hack doesn't choose points based on angle, but something a little more crude that is effectively equivalent. Instead of angle, it is the difference vector between successive line segments. What does that mean? Perhaps the diagram shown in Figure 4-24 will help.
Figure 4-24. One method for simplifying tracklogs for display
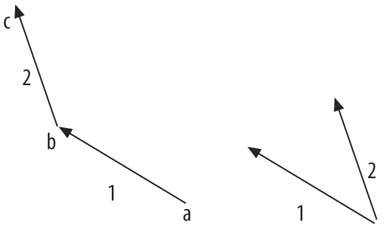
Consider three trackpoints recorded by your GPS unit, where you travel from a to b to the bottom of c. Take the vector 2 between b and c, so that it starts at a and you can compare the vector 1 between a and b to it. Notice the dashed line between them. This dashed line is the difference between the vectors. It's like the angle between them but both quicker to compute and sufficient, because we only need a rough guess to figure out the change in direction.
There is one final fact we must admit, which is that these vectors are laid out in linear latitude and longitude. So when you're in London one degree in latitude is a different absolute length (say, in meters) than one degree in longitude. You could equalize these but for our purposes it doesn't matter that much.
Back to that adaptive algorithm: we choose a small number as a threshold for the length of that dashed line. Then, for every successive pair of line segments in a GPX track we see if the dashed line is bigger than our threshold. If it is bigger, then we include the point; otherwise, we forget about it. By going through the entire GPX file, we may decide to forget 100 points but have 4,000 left. This is far too many for Google to plot. We therefore make our small number a bit bigger and try again, this time dropping more points. We repeat this cycle until we have less than 200 points and then use those points to plot in our track.
This algorithm has been implemented with both a server-side Ruby backend and JavaScript client parsing.
4.10.2. Converting GPX to JavaScript Calls Using Ruby
Here is the Ruby script to place server side, if that's the way you want to plot your GPX files. We recommend using Apache and mod_ruby to run it, and much documentation is available for both.
	#!/usr/bin/ruby

	# make sure we can speak CGI and XML:
	require 'cgi'
	require 'rexml/document'
	include REXML

	cgi = CGI.new

	print cgi.header("type"=>"text/html")

	stringfile = cgi['gpxfile']

	doc = Document.new stringfile.read

	# Put the header of the HTML file:

	puts '
uploaded successfully as far as we can tell
'
Once that script is in a suitable location, you need an HTML page with a little JavaScript to hook it up to.
4.10.3. Supporting HTML and JavaScript for GPX Viewing
We start with the most basic Google Maps instance, modified to support VML and Internet Explorer.
Google Maps GPX Viewer
The Ruby code described above expects to receive a GPX file from an HTML multipart form. That form should look something like this:
Choose a GPX file here:
You can see that this form is being submitted to a frame called sekrit. That's pretty straightforward to add to the HTML too:
And once those items are in your HTML file, all that remains is to add the following JavaScript after the addMap( ) function.
	// whenever a waypoint element is encountered (used by Ruby and JS parsers)
	function addpin(lat,lon,text) {
	 if (lat && lon) {
	 var p = new GPoint(lon,lat);
	 var marker = new GMarker(p);
	 if (text) {
	 // supplied text is wrapped in a
tag but can contain other html var html = "
" + text + "
"; GEvent.addListener(marker, "click", function( ) { marker.openInfoWindowHtml(html); }); } map.addOverlay(marker); map.centerAndZoom(p,4); } } // whenever a trkseg element is encountered (only used by Ruby parser) function gpxtrack(track) { if (track) { if (track.length >= 4) { var points = []; for (i = 0; i < track.length; i+=2) { points[points.length] = new GPoint(track[i+1],track[i]); } map.addOverlay(new GPolyline(points)); map.centerAndZoom(points[0],4); } } }
4.10.4. Client-Side Implementation
Instead of parsing the GPX on the server side, and returning some JavaScript to an iframe, which calls functions in its parent, we can actually use JavaScript to do the whole jobfetch the GPX file and parse it, too. The one problem with this approach is that JavaScript is only allowed to access files hosted on the same domain as the web page it runs in. To get around this, we implemented a PHP proxy that bounces remote GPX files off our server to let JavaScript have it's way with them.
To see this in action, add the following to the JavaScript after the gpxtrack( ) function above.
	// this is called on submit from an html form
	function fetchfile( ) {

	 // disable the form (there's probably a nicer way to do this)
	 document.getElementById("submitbutton").disabled = true;
	 // find the URL from the form (you might want to check that it's a valid
 URL)
	 var url = document.getElementById('gpxfile').value;

	 // create an XMLHttpRequest object, using Google's utility which
	 // abstracts away the browser differences
	 var request = GXmlHttp.create( );

	 // fetch the URL via a proxy script on your server
	 // (otherwise you can only fetch URLs from the same domain
	 // as the javascript is server from)
	 request.open("GET", 'proxy.php?url='+URLencode(url), true);

	 // tell the request what to do if the file is successfully received
	 request.onreadystatechange = function( ) {
	 if (request.readyState == 4) {
	 var xmlDoc = GXml.parse(request.responseText);
	 if (xmlDoc) {

	 var lastPoint; // for centring the map on the last thing of interest

	 var trks = xmlDoc.documentElement.getElementsByTagName("trk");
	 for (var i = 0; i < trks.length; i++) {

	 var trksegs = trks[i].getElementsByTagName("trkseg");
	 for (var j = 0; j < trksegs.length; j++) {

	 var trkpts = trksegs[j].getElementsByTagName("trkpt");
	 var points; // array to contain GPoints
	 var count = 201;
	 var diff = 0.000000001;

	 while (count > 200) {

	 // empty the points array
	 points = [];

	 // we always add the first point
	 var first = true;

	 // characteristics of the last GPoint added to the points array
	 var oldlon = 0.0;
	 var oldlat = 0.0;
	 var oldvx = 0.0;
	 var oldvy = 0.0;

	 var lat;
	 var lon;
	 for (var k = 0; k < trkpts.length; k++) {
	 lat = parseFloat(trkpts[k].getAttribute("lat"))
	 lon = parseFloat(trkpts[k].getAttribute("lon"))
	 if (first == true) {
	 points[points.length] = new GPoint( lon, lat );
	 first = false;
	 count = 1;
	 }
	 else {
	 vx = oldlon - lon;
	 vy = oldlat - lat;
	 dx = oldvx - vx;
	 dy = oldvy - vy;
	 if ( (dx*dx)+(dy*dy) > diff ) {
	 count += 1;
	 points[points.length] = new GPoint( lon, lat );
	 oldvx = vx;
	 oldvy = vy;
	 oldlat = lat;
	 oldlon = lon;
	 }
	 }
	 } // for

	 // if we have >200 pts, we'll try again using a bigger threshold
	 diff *= 5.0

	 } // while

	 map.addOverlay(new GPolyline(points));
	 lastPoint = points[0];
	 } // for j (each trkseg)

	 } // for i (each trk)

	 var wpts = xmlDoc.documentElement.getElementsByTagName("wpt");
	 for (var i = 0; i < wpts.length; i++) {
	 var text = "Waypoint info:
"
	 for (var wpt = wpts[i].firstChild; wpt; wpt = wpt.nextSibling) {
	 // different browsers handle xml attributes differently
	 // this should present waypoint attributes as key:value pairs
	 if (wpt.text) {
	 text += wpt.nodeName + ": " + wpt.text + "
";
	 }
	 else if (wpt.nodeType != 3) {
	 text += wpt.nodeName + ": " + wpt.firstChild.nodeValue + "
";
	 }
	 }
	 addpin( parseFloat(wpts[i].getAttribute("lat")),
	 parseFloat(wpts[i].getAttribute("lon")),
	 text );
	 }

	 map.centerAndZoom(lastPoint,4);

	 }
	 else {
	 alert("xmldoc seems to be null: " + xmlDoc);
	 }
	 }
	 }
	 request.send(null);
	 document.getElementById("submitbutton").disabled = false;
	}

	// this is ugly, and possibly there's a better way to do
	// it with some "proper" javascript. I found it on the web…
	function URLencode(sStr) {
	 return escape(sStr).replace(/+/g, '%2B')
	 .replace(/"/g,'%22').replace(/'/g, '%27');
	}
You can remove the iframe since we're using XMLHttpRequest this time, and change the HTML form to the following:
Type the (valid) URL of a (valid) GPX file here:
The PHP proxy we used in proxy.php looked like this:
And that's it!
4.10.5. Other Possibilities
There are a lot more things you can do with this. A few of the most obvious include:
- Fix the waypoint metadata JavaScript parser to work in Safari.
- Implement the waypoint metadata parsing in Ruby.
- In Ruby, save the resulting file on your server, so the maps are linkable.
- With JavaScript or Ruby, accept a URL in a query string, and then fetch it via HTTP so that the maps are linkable.
- For the Ruby version, submit the file using XMLHttpRequest and return a bit of JavaScript to eval, instead of futzing around with iframe.
4.10.6. See Also
- How to use Google Maps' XSLT voodoo to process the GPX file: http://cse-mjmcl.cse.bris.ac.uk/blog/2005/07/26/1122414882406.html
- How to modify the pin icon/contents: http://maps.kylemulka.com/gpxviewer.php
- A standalone VB version: http://www.planetsourcecode.com/vb/scripts/ShowCode.asp?txtCodeId=61857&lngWId=1
Tom Carden & Steve Coast
You Are Here: Introducing Google Maps
- Hacks 19: Introduction
- Hack 1. Get Around http://maps.google.com
- Hack 2. Find Yourself (and Others) on Google Maps
- Hack 3. Navigate the World in Your Web Browser
- Hack 4. Get the Birds-Eye View
- Hack 5. Driven to a Better User Interface
- Hack 6. Share Google Maps
- Hack 7. Inside Google Maps URLs
- Hack 8. Generate Links to Google Maps in a Spreadsheet
- Hack 9. Use del.icio.us to Keep Up with Google Maps
Introducing the Google Maps API
- Hacks 1016: Introduction
- Hack 10. Add a Google Map to Your Web Site
- Hack 11. Where Did the User Click?
- Hack 12. How Far Is That? Go Beyond Driving Directions
- Hack 13. Create a Route with a Click (or Two)
- Hack 14. Create Custom Map Markers
- Hack 15. Map a Slideshow of Your Travels
- Hack 16. How Big Is the World?
Mashing Up Google Maps
- Hacks 1728: Introduction
- Hack 17. Map the News
- Hack 18. Examine Patterns of Criminal Activity
- Hack 19. Map Local Weather Conditions
- Hack 20. Track Official Storm Reporting
- Hack 21. Track the International Space Station
- Hack 22. Witness the Effects of a Nuclear Explosion
- Hack 23. Find a Place to Live
- Hack 24. Search for Events by Location
- Hack 25. Track Your UPS Packages
- Hack 26. Follow Your Packets Across the Internet
- Hack 27. Add Google Maps to Any Web Site
- Hack 28. How Big Is That, Exactly?
On the Road with Google Maps
- Hacks 2941: Introduction
- Hack 29. Find the Best Gasoline Prices
- Hack 30. Stay Out of Traffic Jams
- Hack 31. Navigate Public Transportation
- Hack 32. Locate a Phone Number
- Hack 33. Why Your Cell Phone Doesnt Work There
- Hack 34. Publish Your Own Hiking Trail Maps
- Hack 35. Load Driving Directions into Your GPS
- Hack 36. Get Driving Directions for More Than Two Locations
- Hack 37. View Your GPS Tracklogs in Google Maps
- Hack 38. Map Your Wardriving Expeditions
- Hack 39. Track Your Every Move with Google Earth
- Hack 40. The Ghost in Google Ride Finder
- Hack 41. How Google Maps Got Me Out of a Traffic Ticket
Google Maps in Words and Pictures
- Hacks 4250: Introduction
- Hack 42. Get More out of What You Read
- Hack 43. Dont Believe Everything You Read on a Map
- Hack 44. You Got Your A9 Local in My Google Maps!
- Hack 45. Share Pictures with Your Community
- Hack 46. Browse Photography by Shooting Location
- Hack 47. Geotag Your Own Photos on Flickr
- Hack 48. Tell Your Communitys Story
- Hack 49. Generate Geocoded RSS from Any Google Map
- Hack 50. Geoblog with Google Maps in Thingster
API Tips and Tricks
- Hacks 5161: Introduction
- Hack 51. Make a Fullscreen Map the Right Way
- Hack 52. Put a Map and HTML into Your Info Windows
- Hack 53. Add Flash Applets to Your Google Maps
- Hack 54. Add a Nicer Info Window to Your Map with TLabel
- Hack 55. Put Photographs on Your Google Maps
- Hack 56. Pin Your Own Maps to Google Maps with TPhoto
- Hack 57. Do a Local Zoom with GxMagnifier
- Hack 58. Find the Right Zoom Level
- Hack 59. Show Lots of StuffQuickly
- Hack 60. Make Things Happen When the Map Moves
- Hack 61. Use the Right Developers Key Automatically
Extreme Google Maps Hacks
- Hacks 6270: Introduction
- Hack 62. Find the Latitude and Longitude of a Street Address
- Hack 63. Read and Write Markers from a MySQL Database
- Hack 64. Build Custom Icons on the Fly
- Hack 65. Add More Imagery with a WMS Interface
- Hack 66. Add Your Own Custom Map
- Hack 67. Serve Custom Map Imagery
- Hack 68. Automatically Cut and Name Custom Map Tiles
- Hack 69. Cluster Markers at High Zoom Levels
- Hack 70. Will the Kids Barf? (and Other Cool Ways to Use Google Maps)
EAN: 2147483647
Pages: 131
