Hack 65. Add More Imagery with a WMS Interface


What's a pretty face like you doing on the geospatial web?
The Google Maps service is cool, the user interface is wonderful, the API is a joy, and the maps are pretty, but there is more to the world of mapping than what fits on one company's massive server farm.
7.5.1. The Hack
The Open Geospatial Consortium (OGC) has defined a number of interoperability standards for web mapping applications. The simplest to understand is the Web Mapping Service (WMS) specification. In Google Maps terms, you would ask a WMS server for a tile that contains something like a Google Map or Satellite image. The key is that the WMS is not limited to the data that Google Maps maintains. There are WMS servers with things from Landsat imagery to topographic (elevation) data to habitat data. WMS requests are normally made by programs, but you can assemble a request by hand.
If you put this URL into your browser:
	http://wms.jpl.nasa.gov/wms.cgi?request=GetMap&layers
	 =global_mosaic_base&srs=EPSG:4326&bbox=-87.90,24.38,-76.65,30.01
	 &FORMAT=image/png&width=600&height=400&styles=pseudo
you will get the image of Florida shown in Figure 7-6.
Figure 7-6. Florida as shown by a WMS request
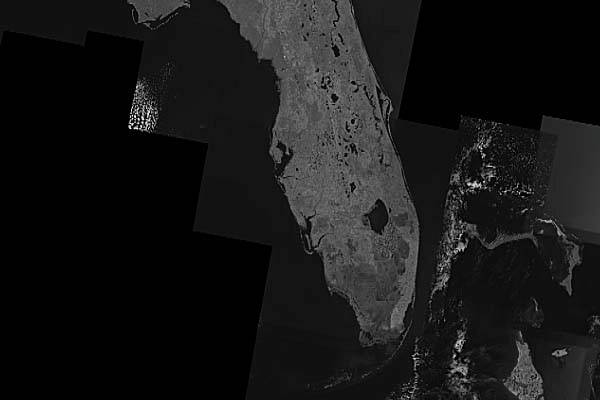
This looks a lot like a Google Maps tile. Even without understanding the format of a WMS request, you can look at that URL and get some information. For example, it has a bbox (or bounding box) that covers the area from 87.9 W to 76.65 W and 24.38 N to 30.01 N, which happens to be most of Florida.
You can make a request to a WMS server for a map that covers a certain area. But what is a map? WMS returns a raster (an image) for the selected area and for selected features. WMS Servers report what their capabilities are, what sorts of information they contain, and WMS clients can then select the layers they want to show.
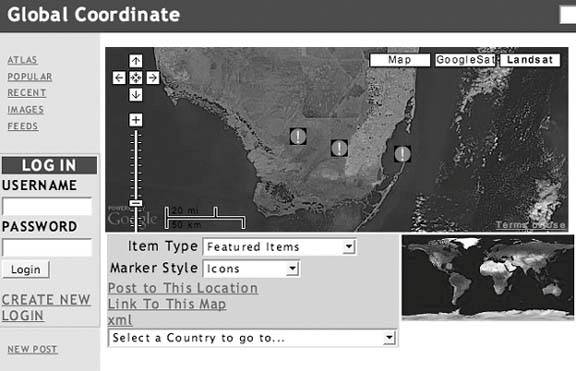
David Knight has written a JavaScript extension library that you can insert into your own Google Maps page to let you browse through tiles from a WMS server using the Google Maps user interface. For an example of this, visit the Global Coordinate page at http://globalcoordinate.com/. Figure 7-7 shows Landsat imagery of South Florida within a Google Maps interface. The Global Coordinate page also demonstrates near real-time updating of the map from RSS feeds.
Figure 7-7. Florida from a WMS Server
7.5.2. The Code
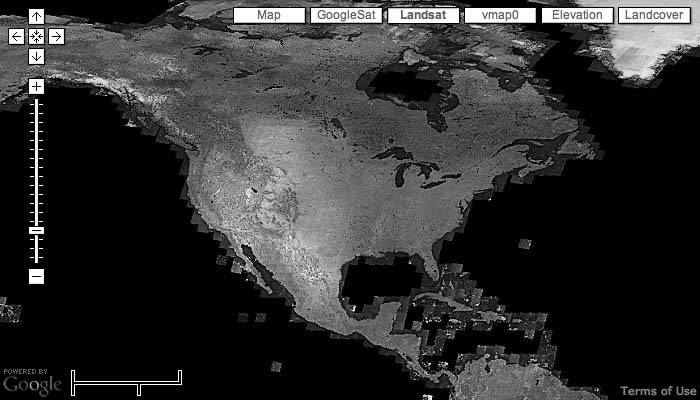
We've created a simple example of a WMS-enabled Google Map at http://mappinghacks.com/projects/gmaps/wms.html. Sure you have the standard map and satellite views, but it includes a little extra kick in the data layer department. It also includes Landsat and VMAP0 data for the whole world and elevation and landcover layers for the United States. It will produce a display like Figure 7-8.
Assuming you have created the Hello World map [Hack #10], you can add these WMS layers with this code:
This includes David's library. You can look at it by pointing your browser to this URL: http://www.globalcoordinate.com/jscript/WMSTiles.js.
Using the WMS tiles library is fairly straightforward. In the following JavaScript example, the mapSpecs variable holds an array of objects that is used to load parameters needed for the WMS fetch and display.
Figure 7-8. WMS layers on a Google Map
	var mapSpecs = [];
	createMapSpecs();

	_SATELLITE_TYPE.getLinkText = function() {
	 return "GoogleSat";
	}

	mapSpecs.push(_GOOGLE_MAP_TYPE);
	mapSpecs.push(_SATELLITE_TYPE);
First, we create a new WMS map specification and then push it onto mapSpecs. To create a layer, pass the base WMS URL and the name that you want displayed on your map. There are four layers here: Landsat, VMAP0, National Elevation Dataset (NED), and National Landcover Dataset. These four layers come from three different servers. The Geospatial web is alive, and with a few lines of code you can add more, different, and sometimes better layers to your Google Maps applications!
	wmsSpec =new _WMSMapSpec ("http://wms.jpl.nasa.gov/wms.cgi?request
	 =GetMap&layers=global_mosaic_base&srs=EPSG:4326","Landsat");
	mapSpecs.push(wmsSpec);

	wmsSpec =new _WMSMapSpec ("http://geocoder.us/surfer/wms.cgi?service
	 =wms&version=1.1.1&request=GetMap&layers=vmap0&srs
	 =EPSG:4326", "vmap0");
	mapSpecs.push(wmsSpec);

	wmsSpec =new _WMSMapSpec
	 ("http://gisdata.usgs.net/servlet/com.esri.wms.Esrimap?servicename
	 =USGS_WMS_NED&request=GetMap&layers=US_NED_Shaded_Relief&srs
	 =EPSG:4326","Elevation NED");
	mapSpecs.push(wmsSpec);

	wmsSpec =new _WMSMapSpec
	 ("http://gisdata.usgs.net/servlet/com.esri.wms.Esrimap?servicename
	 =USGS_WMS_NLCD&request=GetMap&layers=US_NLCD&srs=EPSG:4326","Landcover");
	mapSpecs.push(wmsSpec);
Next, we pass the array of mapSpecs to the GMap constructor and set normal attributes with the API calls.
	var map = new GMap(document.getElementById("map"),mapSpecs);

	map.setMapType( _SATELLITE_TYPE );
	map.addControl(new GLargeMapControl());
	map.addControl(new GScaleControl());
This puts the map layer choices on the map. Without this, the only way to select between Map, Satellite, Landsat, VMAP0, NED, and Landcover would be with custom navigationsay a button that triggers JavaScript to set the appropriate map type. (Map "type" is Google-speak for "raster layer".)
	map.addControl(new GMapTypeControl());
	map.centerAndZoom(new GPoint(-120, 38), 4);
7.5.3. The Virtues of Additional Map Layers
Different layers make more sense for different uses, and at different zoom levels. The San Francisco Bay area looks sort of patchy in the Google Satellite image in Figure 7-9.
Figure 7-9. Google Satellite image of the Bay Areapretty choppy
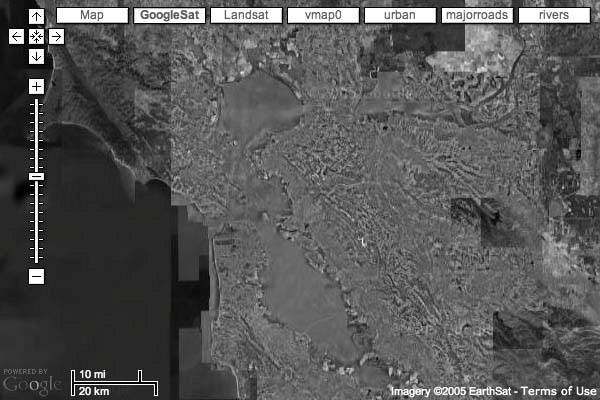
In Figure 7-10, the Landsat imagery is smoother and more informative at this scale.
Figure 7-10. The Landsat image looks nice at this scale

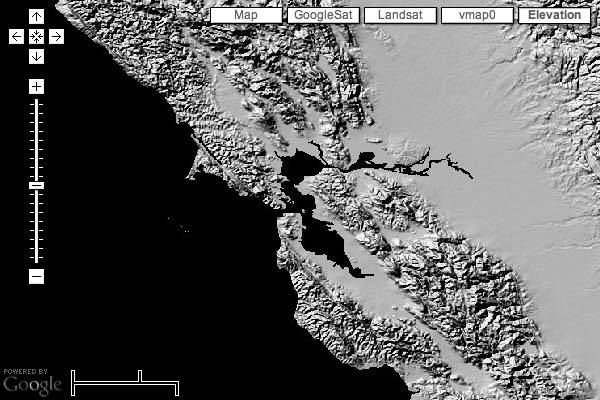
The National Elevation Dataset covering the Bay Area, shown in Figure 7-11 is just beautiful.
Figure 7-11. The National Elevation Dataset for the Bay Area
At a larger level, the NED and Landcover images are useful in understanding the natural history of the United States, as shown in Figures 7-12 and 7-13, respectively.
Figure 7-12. U.S. Landcover

Figure 7-13. U.S. National Elevation Dataset

7.5.4. Finding and Using Other WMS Servers
We can find WMS servers that have a lot of different data! And all those WMS servers are kind enough to tell us what information they have available. Ionic Software provides the AskTheSpider service at http://askthespider.com/ to serve as a central search engine for the Geospatial Web. Each result from AskTheSpider includes the links to the GetCapabilities page for each server. You can also search for "WMS Servers" on Google and be provided with a lot of choices.
To see which layers a WMS server has available, issue a GetCapabilities request. This is an HTTP GET call to a URL, probably a script, on the WMS server. For example, ask the WMS server at the Jet Propulsion Laboratory (JPL) what it can deliver. Load http://wms.jpl.nasa.gov/wms.cgi?request=GetCapabilities into your browser, and an XML file is returned. Depending on your browser, the capabilities will be displayed, or you may be given the opportunity to save the page to your local drive. Technically, a proper capabilities request needs the service and version parameters; for example:
	http://wms.jpl.nasa.gov/wms.cgi?request=GetCapabilities&service
	 =WMS&version=1.0.0
However, many WMS servers are forgiving about this.
The capabilities document from the JPL WMS server is a 1,696-line XML document that includes lots of detail to specify what is available. The capabilities document will contain one or more Layer elements. Here is part of one of the shorter Layer sections from the JPL capability document:
	 us_colordemDigital Elevation Map of the United States, DTED dataset, 3
	second resolution, hue mapped

	 The DTED Level 3 US elevation, mapped to a color image using the
	full spectrum.
	 This result is not achievable by using SLD, so it is presented as a
	different layer.


	 20000
Even with no more documentation on WMS, you can guess that this is the Digital Elevation Map of the United States, and you know that it has data for latitudes from 23 N to 50 N, and 127 W to 66 Wi.e., the continental United States.
The original long request that generated an image of Florida starts to make more sense when you look at the full XML GetCapabilities document. Every element in the URL is defined by the Capabilities document.
	http://wms.jpl.nasa.gov/wms.cgi?request=GetMap&layers
	 =global_mosaic_base&srs=EPSG:4326&bbox=
	 -87.90,24.38,76.65,30.01&FORMAT=image/png&width=600&height=400&styles=pseudo
The base URL is defined in the OnlineResource element. The available layers are in the Layer elements. The spatial reference system, or SRS, corresponds to the exact cartographic projection of the layer and is often defined by European Petroleum Survey Group, or EPSG, codes (there is a long story behind this). These codes are sometimes referred to as spatial reference identifiers, or SRIDs. An SRID defines the specific assumptions that are being made about the shape of the earth, how you mark location, and where zero is. In this case, EPSG 4326 refers to the latitude/longitude geographic coordinate system, referenced to the WGS-84 standard ellipsoid and datum.
If you have the PROJ.4 cartographic projections library (http://proj.maptools.org), you can examine the list of EPSG codes stored in /usr/share/proj/epsg. If you have PostGIS (http://postgis.refractions.net/) installed you can see what SRID 4326 means by looking in the spatial_ref_sys system table. If you don't have PostGISor don't want to botheryou can mostly assume that everything uses EPSG code 4326. This isn't always true, but it is true often enough to be a useful simplifying assumption.
	=
	> select * from spatial_ref_sys where srid=4326;

	GEOGCS["GCS_WGS_1984",DATUM["D_WGS_1984",SPHEROID["WGS_1984",6378137,298.
	257223563]],PRIMEM["Greenwich",0],UNIT["Degree",0.017453292519943295]] |
	+proj=longlat +ellps=WGS84 +datum=WGS84
The bounding box used in the bbox parameter defines the minimum and maximum latitude and longitude that will be included in the returned map. The format parameter is the image format to use (PNG, JPG, PNG, PDF), the height and width are the number of pixels in the returned image, and the styles parameter is defined in the Layers section and means whatever that particular server says that it means.
With this knowledge, we can make almost any WMS server a source for imagery that will appear in a Google Maps interface on our own maps. We need to figure out the base URL to generate maps from a particular WMS server. Here is the GetCapabilities line for the JPL WMS server compared with the _WMSMapSpec that is needed by David's JavaScript:
	http://wms.jpl.nasa.gov/wms.cgi?request=GetCapabilities
	http://wms.jpl.nasa.gov/wms.cgi?request=GetMap&layers=global_mosaic_
	base&srs=EPSG:4326
To get a map you replace GetCapabilities with GetMap. Then you must specify the name of one or more layers. These are from the Name element within the Layers section of the document returned by the GetCapabilities request. You also need to specify the Spatial Reference System, which is in the SRS element within the Layer element.
7.5.5. See Also
- Open Geospatial Consortium's Directory of Services at http://www.ogcnetwork.org/. Includes links to the WMS Cookbook at http://www.opengeospatial.org/resources/?page=cookbooks, as well as other documents, links to sample applications, and support mailing lists.
- Another WMS Cookbook maintained by Allan Doyle, the Kevin Bacon of the Open Geospatial world: http://www.intl-interfaces.com/cookbook/WMS/.
You Are Here: Introducing Google Maps
- Hacks 19: Introduction
- Hack 1. Get Around http://maps.google.com
- Hack 2. Find Yourself (and Others) on Google Maps
- Hack 3. Navigate the World in Your Web Browser
- Hack 4. Get the Birds-Eye View
- Hack 5. Driven to a Better User Interface
- Hack 6. Share Google Maps
- Hack 7. Inside Google Maps URLs
- Hack 8. Generate Links to Google Maps in a Spreadsheet
- Hack 9. Use del.icio.us to Keep Up with Google Maps
Introducing the Google Maps API
- Hacks 1016: Introduction
- Hack 10. Add a Google Map to Your Web Site
- Hack 11. Where Did the User Click?
- Hack 12. How Far Is That? Go Beyond Driving Directions
- Hack 13. Create a Route with a Click (or Two)
- Hack 14. Create Custom Map Markers
- Hack 15. Map a Slideshow of Your Travels
- Hack 16. How Big Is the World?
Mashing Up Google Maps
- Hacks 1728: Introduction
- Hack 17. Map the News
- Hack 18. Examine Patterns of Criminal Activity
- Hack 19. Map Local Weather Conditions
- Hack 20. Track Official Storm Reporting
- Hack 21. Track the International Space Station
- Hack 22. Witness the Effects of a Nuclear Explosion
- Hack 23. Find a Place to Live
- Hack 24. Search for Events by Location
- Hack 25. Track Your UPS Packages
- Hack 26. Follow Your Packets Across the Internet
- Hack 27. Add Google Maps to Any Web Site
- Hack 28. How Big Is That, Exactly?
On the Road with Google Maps
- Hacks 2941: Introduction
- Hack 29. Find the Best Gasoline Prices
- Hack 30. Stay Out of Traffic Jams
- Hack 31. Navigate Public Transportation
- Hack 32. Locate a Phone Number
- Hack 33. Why Your Cell Phone Doesnt Work There
- Hack 34. Publish Your Own Hiking Trail Maps
- Hack 35. Load Driving Directions into Your GPS
- Hack 36. Get Driving Directions for More Than Two Locations
- Hack 37. View Your GPS Tracklogs in Google Maps
- Hack 38. Map Your Wardriving Expeditions
- Hack 39. Track Your Every Move with Google Earth
- Hack 40. The Ghost in Google Ride Finder
- Hack 41. How Google Maps Got Me Out of a Traffic Ticket
Google Maps in Words and Pictures
- Hacks 4250: Introduction
- Hack 42. Get More out of What You Read
- Hack 43. Dont Believe Everything You Read on a Map
- Hack 44. You Got Your A9 Local in My Google Maps!
- Hack 45. Share Pictures with Your Community
- Hack 46. Browse Photography by Shooting Location
- Hack 47. Geotag Your Own Photos on Flickr
- Hack 48. Tell Your Communitys Story
- Hack 49. Generate Geocoded RSS from Any Google Map
- Hack 50. Geoblog with Google Maps in Thingster
API Tips and Tricks
- Hacks 5161: Introduction
- Hack 51. Make a Fullscreen Map the Right Way
- Hack 52. Put a Map and HTML into Your Info Windows
- Hack 53. Add Flash Applets to Your Google Maps
- Hack 54. Add a Nicer Info Window to Your Map with TLabel
- Hack 55. Put Photographs on Your Google Maps
- Hack 56. Pin Your Own Maps to Google Maps with TPhoto
- Hack 57. Do a Local Zoom with GxMagnifier
- Hack 58. Find the Right Zoom Level
- Hack 59. Show Lots of StuffQuickly
- Hack 60. Make Things Happen When the Map Moves
- Hack 61. Use the Right Developers Key Automatically
Extreme Google Maps Hacks
- Hacks 6270: Introduction
- Hack 62. Find the Latitude and Longitude of a Street Address
- Hack 63. Read and Write Markers from a MySQL Database
- Hack 64. Build Custom Icons on the Fly
- Hack 65. Add More Imagery with a WMS Interface
- Hack 66. Add Your Own Custom Map
- Hack 67. Serve Custom Map Imagery
- Hack 68. Automatically Cut and Name Custom Map Tiles
- Hack 69. Cluster Markers at High Zoom Levels
- Hack 70. Will the Kids Barf? (and Other Cool Ways to Use Google Maps)
EAN: 2147483647
Pages: 131
