Hack 22. Witness the Effects of a Nuclear Explosion


Sometimes a map can reveal truths we'd rather not know.
For over 50 years, the human race has lived under the shadow of the threat of nuclear war. Eric A. Meyer's HYDESim (High-Yield Detonation Effects Simulator) web site, which uses Google Maps in a somewhat novel way to illustrate the blast effects of a nuclear detonation. You can see the results for yourself at http://meyerweb.com/eric/tools/gmap/hydesim.html. Figure 3-12 shows the default view, which illustrates the effect of a 150 kiloton explosion at ground level in downtown Manhattan.
Figure 3-12. Depiction of the blast wave of a 150-kT nuclear explosion in downtown Manhattan
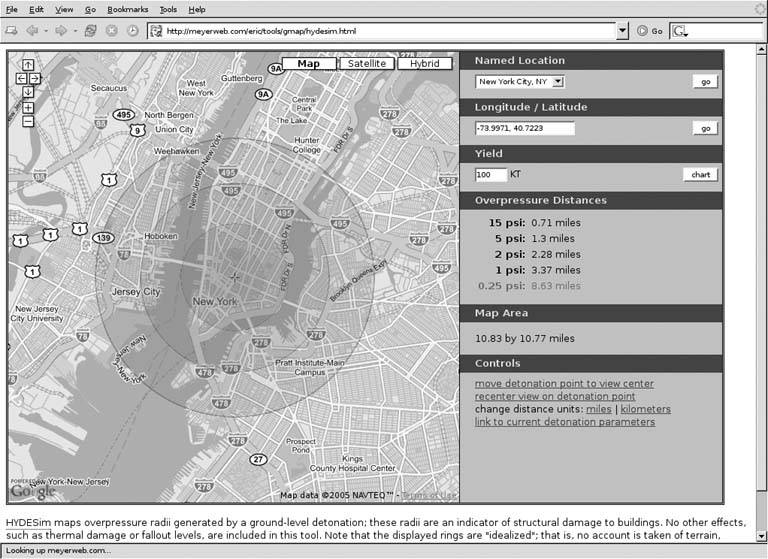
The blast effect of a nuclear explosion is usually reckoned in terms of overpressure, which is a measure of how much force is exerted on people and buildings at a given distance away from ground zero. On the map, this is shown as four concentric rings of decreasing intensity, which spread outward from the hypothetical explosion site, representing overpressures of 15 psi, 5 psi, 2psi, and 1 psi, respectively. The display on the left shows the blast radius for .25 psi overpressure as well, although this ring is not shown on the map.
What exactly do these figures mean, though? The descriptions shown in Table 3-1 are taken from section 5 of the Nuclear Weapons FAQ at http://nuclearweaponarchive.org/Nwfaq/Nfaq5.html.
|
Overpressure |
Structural effects |
Human injuries |
|---|---|---|
|
1 psi |
Window glass shatters. |
Light injuries from fragments occur. |
|
3 psi |
Residential structures collapse. |
Serious injuries are common, fatalities may occur. |
|
5 psi |
Most buildings collapse. |
Injuries are universal, fatalities are widespread. |
|
10 psi |
Reinforced concrete buildings are severely damaged or demolished. |
Most people are killed. |
|
20 psi |
Heavily built concrete buildings are severely damaged or demolished. |
Fatalities approach 100%. |
Although the results are simplified, they sure don't look prettyat that location and yield, such a nuclear explosion would literally wreck all of downtown Manhattan. What's worse, this map doesn't take the effects of heat or radiation into account. (On the other hand, this map doesn't take the attenuating effects of terrain and weather into account, either.) Although the destructive effects of nuclear weapons are hardly news to anyone, it is still kind of morbidly interesting to be able to see them on a map. Additionally, the site allows you to see the effects on certain other U.S. cities listed in the drop-down box at the upper right, and, if you happen to know the latitude and longitude of a place that particularly interests you, you can enter them into the coordinates box below that.
|

Finally, you can adjust the yield of the hypothetical explosion, which is measured in kilotons of TNT. By experimenting, we can see that a 1 megaton nuclear explosion over the Brooklyn Bridge would destroy most of Manhattan, Queens, and Brooklyn. Fortunately, these high-yield nukes have been phased out of most of the world's military stockpiles. On the other hand, we can see that even a relatively "small" detonation on the order of 5 kilotons could wreak utter mayhem in significant parts of the city.
3.7.1. The Code
From a technical standpoint, what makes this hack interesting is this bit of JavaScript code, which you can find for yourself by viewing the source of the aforementioned web page:
	var base = new GIcon();
	base.image = "radii.png";
	base.shadow = 't.png';
	base.shadowSize = new GSize(1, 1);

	var GZ = new GIcon(base);
	GZ.image = "crosshair.png";
	GZ.iconSize = new GSize(13, 13);
	GZ.iconAnchor = new GPoint(6, 6);
	GZ.infoWindowAnchor = new GPoint(6, 6);

	var p15 = new GIcon(base);
	p15.iconSize = new GSize(det.radius.p15*2/mpp, det.radius.p15*2/mpp);
	p15.iconAnchor = new GPoint(det.radius.p15/mpp, det.radius.p15/mpp);
	p15.infoWindowAnchor = new GPoint(det.radius.p15/mpp,
	 det.radius.p15/mpp);

	var p5 = new GIcon(base);
	p5.iconSize = new GSize(det.radius.p5*2/mpp, det.radius.p5*2/mpp);
	p5.iconAnchor = new GPoint(det.radius.p5/mpp, det.radius.p5/mpp);
	p5.infoWindowAnchor = new GPoint(det.radius.p5/mpp, det.radius.p5/mpp);
This code, which you'll find in the buildOverlays( ) function, uses the standard GIcon marker object from the Google Maps API to render the blast radius rings using the same semi-transparent radii.png image. Each one is sized separately, according to the blast radii calculated from the detonation yield in the Detonation( ) constructor (not shown here), and the mpp variable, which stores the map scale at the current zoom level. Additionally, a crosshair icon is created to represent ground zero itself.
The upshot is that when the map is loaded, or whenever the detonation location is moved, the individual blast radius markers are stacked on top of one another at the same location on the map. The semi-transparent circles then give the visual impression of blast intensity decreasing, as it moves away from ground zero. The result, which perfectly conveys the desired information, is a very clever use of the Google Maps marker icons, which are usually used to represent grocery stores or yard sales! The same technique could be used to represent any kind of data via Google Maps that involves concentric radii of decreasing intensity. One immediately thinks of volcanic explosions or earthquake damage as candidates for this kind of interface, but there are probably less destructive topics that could be illustrated the same way.
Certainly, the prospect of nuclear war, or even of an isolated nuclear explosion in a populated area, is a terrifying one. So far, humanity has managed to show considerable restraint in its application of nuclear weapons, but an estimated 20,000 nuclear warheads still exist in the world's military arsenals. Ridding ourselves of this menace remains one of the most important outstanding issues in international politics. Hopefully, access to the kind of information offered by the HYDESim site will bring home to people how tragic the possibilities are, and just how imperative it is that the menace never becomes a reality.
3.7.2. See Also
- The Nuclear Weapons FAQ (http://nuclearweaponarchive.org/Nwfaq/Nfaq0.html) answers a lot of common questions about nuclear weapons.
- The Atomic Archive's New York example (http://www.atomicarchive.com/Example/Example1.shtml) illustrates a situation much like the one shown in Figure 3-12, only in much more detail.
- Wikipedia's List of Nuclear Accidents at http://en.wikipedia.org/wiki/List_of_nuclear_accidents makes for an interesting read and illustrates just how close we've come over the years to serious accidental nuclear explosions.
You Are Here: Introducing Google Maps
- Hacks 19: Introduction
- Hack 1. Get Around http://maps.google.com
- Hack 2. Find Yourself (and Others) on Google Maps
- Hack 3. Navigate the World in Your Web Browser
- Hack 4. Get the Birds-Eye View
- Hack 5. Driven to a Better User Interface
- Hack 6. Share Google Maps
- Hack 7. Inside Google Maps URLs
- Hack 8. Generate Links to Google Maps in a Spreadsheet
- Hack 9. Use del.icio.us to Keep Up with Google Maps
Introducing the Google Maps API
- Hacks 1016: Introduction
- Hack 10. Add a Google Map to Your Web Site
- Hack 11. Where Did the User Click?
- Hack 12. How Far Is That? Go Beyond Driving Directions
- Hack 13. Create a Route with a Click (or Two)
- Hack 14. Create Custom Map Markers
- Hack 15. Map a Slideshow of Your Travels
- Hack 16. How Big Is the World?
Mashing Up Google Maps
- Hacks 1728: Introduction
- Hack 17. Map the News
- Hack 18. Examine Patterns of Criminal Activity
- Hack 19. Map Local Weather Conditions
- Hack 20. Track Official Storm Reporting
- Hack 21. Track the International Space Station
- Hack 22. Witness the Effects of a Nuclear Explosion
- Hack 23. Find a Place to Live
- Hack 24. Search for Events by Location
- Hack 25. Track Your UPS Packages
- Hack 26. Follow Your Packets Across the Internet
- Hack 27. Add Google Maps to Any Web Site
- Hack 28. How Big Is That, Exactly?
On the Road with Google Maps
- Hacks 2941: Introduction
- Hack 29. Find the Best Gasoline Prices
- Hack 30. Stay Out of Traffic Jams
- Hack 31. Navigate Public Transportation
- Hack 32. Locate a Phone Number
- Hack 33. Why Your Cell Phone Doesnt Work There
- Hack 34. Publish Your Own Hiking Trail Maps
- Hack 35. Load Driving Directions into Your GPS
- Hack 36. Get Driving Directions for More Than Two Locations
- Hack 37. View Your GPS Tracklogs in Google Maps
- Hack 38. Map Your Wardriving Expeditions
- Hack 39. Track Your Every Move with Google Earth
- Hack 40. The Ghost in Google Ride Finder
- Hack 41. How Google Maps Got Me Out of a Traffic Ticket
Google Maps in Words and Pictures
- Hacks 4250: Introduction
- Hack 42. Get More out of What You Read
- Hack 43. Dont Believe Everything You Read on a Map
- Hack 44. You Got Your A9 Local in My Google Maps!
- Hack 45. Share Pictures with Your Community
- Hack 46. Browse Photography by Shooting Location
- Hack 47. Geotag Your Own Photos on Flickr
- Hack 48. Tell Your Communitys Story
- Hack 49. Generate Geocoded RSS from Any Google Map
- Hack 50. Geoblog with Google Maps in Thingster
API Tips and Tricks
- Hacks 5161: Introduction
- Hack 51. Make a Fullscreen Map the Right Way
- Hack 52. Put a Map and HTML into Your Info Windows
- Hack 53. Add Flash Applets to Your Google Maps
- Hack 54. Add a Nicer Info Window to Your Map with TLabel
- Hack 55. Put Photographs on Your Google Maps
- Hack 56. Pin Your Own Maps to Google Maps with TPhoto
- Hack 57. Do a Local Zoom with GxMagnifier
- Hack 58. Find the Right Zoom Level
- Hack 59. Show Lots of StuffQuickly
- Hack 60. Make Things Happen When the Map Moves
- Hack 61. Use the Right Developers Key Automatically
Extreme Google Maps Hacks
- Hacks 6270: Introduction
- Hack 62. Find the Latitude and Longitude of a Street Address
- Hack 63. Read and Write Markers from a MySQL Database
- Hack 64. Build Custom Icons on the Fly
- Hack 65. Add More Imagery with a WMS Interface
- Hack 66. Add Your Own Custom Map
- Hack 67. Serve Custom Map Imagery
- Hack 68. Automatically Cut and Name Custom Map Tiles
- Hack 69. Cluster Markers at High Zoom Levels
- Hack 70. Will the Kids Barf? (and Other Cool Ways to Use Google Maps)
EAN: 2147483647
Pages: 131
