Project Value: The Source of all Quantitative Measures
Project Value The Source of all Quantitative Measures
Project value is a consequence of successful application of resources to an agreed scope, taking measured risks to balance expectations with capability.
John C. Goodpasture
Successful Projects
Successful projects return value to the business. Successful projects are relatively easy to identify; we usually know them when we see them. They are the projects that improve processes or product, reduce costs and operational inefficiencies, make contributions to the technical and functional competence of the organization, or add capacity and capability to serve customers and markets with greater satisfaction. They are projects that make good on the promises of the project charter, deliver the intended scope, and deliver that scope within a time frame commensurate with business objectives. The value cycle of successful projects is presented in Figure 1-1.
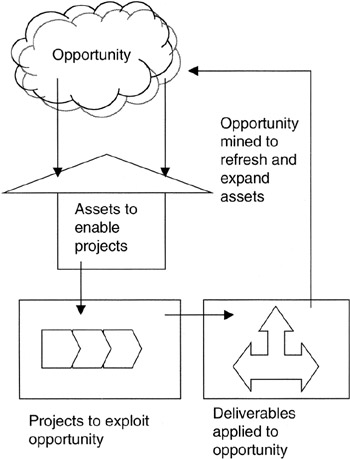
Figure 1-1: The Project Cycle of Value.
Mindful of the fact that projects, all projects, are one-time temporary endeavors [1] burdened with uncertainties, and not blessed with the error-reducing opportunities of repetitive ongoing operations, the project manager faces many risks arising from internal stresses and external uncontrollables. The project manager's mission is then to accomplish the assigned scope with the available resources, taking measured risks to do so.
More often than not, successful projects "make the numbers." In the project's value equation, the resource commitment is to be more than paid back by the project benefits. That said, it might be the case that the numbers to make are spread over the life cycle of the project from concept through implementation, deployment, operations, and retirement. Figure 1-2 illustrates the life phases of a project.
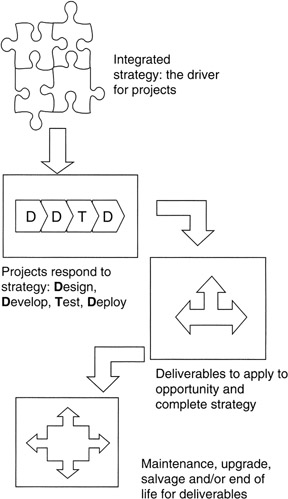
Figure 1-2: The Project Life Cycle.
The numbers may not be all financial; indeed, quantitative measures of resource consumption, customer satisfaction scores, market share, supplier value, and other business measures may be every bit as influential in judging project success. What would be your judgment of New Coke or the Edsel automobile or the Apple Newton? Very likely, the concept and development project efforts were sufficiently successful by conventional measures to warrant production, but over the product life cycle these were not very successful projects, largely due to customer dissatisfaction with feature and function, and perhaps inadequate product differentiation with competitors.
Valuable projects are "instruments of strategy." [2] Project value is made traceable to opportunity by means of flow down from opportunity to goals deployed through strategic plans, as illustrated in Figure 1-3. We see in Figure 1-3 that opportunity is at the head of project value. Opportunity is the untapped market value that must be processed into business results. Tapping into opportunity provides the fuel to achieve goals. Goals are a state of being, quantitative and measurable, a destination to be achieved with strategy. Strategy is actionable steps toward the goal state. Strategy is a plan. To implement a planning step, a project may be needed. Therein lies project value: a means to an end to execute strategy and achieve goals. Once completed, a concept of operations employing the deliverables becomes day-to-day organizational activity.
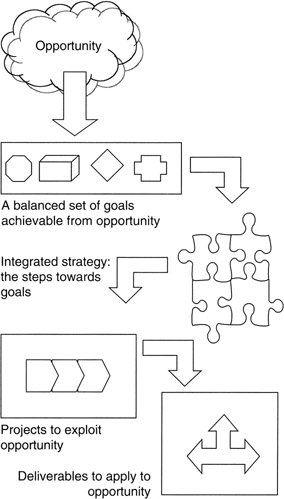
Figure 1-3: Value Flow Down.
Really valuable projects enhance core competencies; indeed, for many companies, project management and the ability to execute projects as envisioned is a core competency. As defined by Gary Hamel and C.K. Parahalad in their 1990 Harvard Business Review article, "The Core Competence of the Corporation," [3] and subsequently expanded in their 1994 book, Competing for the Future, [4] core competencies are integrated bundles of skills, often cross-departmental, that provide business with "gateways to future opportunities." To be a core competency in Hamel and Parahalad's view, an integrated skill set must meet three tests. First, it must be employed to make a material contribution to customer value in the products and services offered by the business. Certainly, the skill set required to pull off mission-enabling projects would meet this test. Second, a core competency must be competitively unique and add to the differentiation in the market between the firm and its competitors and substitutes. For example, within the defense industry, program management of complicated cost-reimbursable contracts is considered a core competency. The ability to manage huge complexity in a semi-regulated environment — with all of the unique accounting and contracting processes, procedures, and rules that are associated with the defense industrial community — separates defense firms from their commercial counterparts. Even within the defense community, integrated program management skills set apart firms into opportunity spaces by their ability to manage scope. Finally, a core competency enables extensions of the business into new products and services. If not for this, many companies might remain the best buggy whip manufacturers of all time.
[1]A Guide to the Project Management Body of Knowledge (PMBOK Guide) — 2000 Edition, Project Management Institute, Newtown Square, PA, p. 204.
[2]Goodpasture, John C., Managing Projects for Value, Management Concepts, Vienna, VA, 2001.
[3]Hamel, Gary and Parahalad, C.K., The core competence of the corporation, Harvard Business Review, pp. 79–90, May–June 1990.
[4]Hamel, Gary and Parahalad, C.K., Competing for the Future, Harvard Business School Press, Boston, MA, 1994, chap. 9.
Business Value is the Motivator for Projects
The fact is, the "business of business is to increase shareholder wealth." This sentiment paraphrases the thinking of many executives going back all the way to Adam Smith in the 18th century. In his well-known book, The Wealth of Nations, published in 1776, business leader Smith wrote: "Every individual endeavors to employ his capital so that its produce may be of greatest value. He generally neither intends to promote the public interest, nor knows how much he is promoting it. He intends only his own security, his own gain." By all current measures, Mr. Smith was very self-centered and not community oriented. Nevertheless, it is as true today as it was more than two centuries ago that many businesses put financial performance at the top of the value chain.
Insofar as projects return more in financial resources than they absorb, we could then conclude that those projects are valuable to the business. It only remains to set up the mechanisms to make effective financial measures. We will take up financial measures in later chapters when we discuss capital budgeting and cost management. We will examine the concepts of sorting projects on the basis of their risk-adjusted returns calculated as either their net present value or their economic value add. Coupling scope with financial returns leads us to the concept of earned value. Earned value is indispensable for evaluating the true value of a project to the business.
Over time, several models have evolved to describe other sources of business value that are effective tools for project managers. Project managers are often called on to contribute to the selection of projects, to interpret the voice of the customer when setting scope, to evaluate the discretionary investments in upgrades and enhancements throughout the life cycle, and to assist with the rollout and deployment of the project deliverables to the end users and customers. Familiarity with the sources of value to executives, suppliers, users, and customers only enhances the value of project management per se. These value models convey understanding of the hot buttons of those constituents.
The Balanced Scorecard
One model in current and widespread use is the balanced scorecard. The balanced scorecard is an idea invented by Robert S. Kaplan and David P. Norton. Writing first in the Harvard Business Review in an article entitled "The Balanced Scorecard — Measures That Drive Performance," [5] Kaplan and Norton described four scoring areas for business value. One, of course, is financial performance. Financial performance is often a history of performance over the reporting period. Though historical data provide a basis to calculate trends, in effect indexes for forecasting future results, by and large the focus of financial performance is on what was accomplished and the plans for the period ahead. Almost all projects and all project managers must respond to financial performance.
Three other balanced scorecard scoring areas also fit well into the business of chartering, scoping, and selecting projects. These scoring areas are the customer perspective of how well we are seen by those that depend on us for products and services, and exercise free will to spend their money with our business or not; the internal business perspective, often referred to as the operational effectiveness perspective; and the innovation and learning perspective that addresses not only how our business is modernizing its products and services but also how the stakeholders in the business, primarily the employees, are developing themselves as well.
For each of these scoring areas, it is typical to set goals (a state to be achieved) and develop strategy (actionable steps to achieve goals). The scoring areas themselves represent the opportunity space. As we saw in Figure 1-3, goal setting and strategy development in specific opportunity areas lead naturally to the identification of projects as a means to strategy. Specific performance measures are established for each scoring area so that goal achievement is measurable and reportable.
Typically, project performance measures are benefits and key performance indicators (KPIs). KPIs need not be, and most are not, financial measures. In this book, we make the distinction between benefits, returns, and a KPI. Benefits will be used in the narrow sense of dollar flows that offset financial investment in projects. Returns, typically expressed in ratios of financial measures, such as return on investment, and benefits, typically measured in dollars, are sometimes used interchangeably though it is obvious that benefits and returns are calculated differently. KPIs, on the other hand, are measures of operational performance, such as production errors per million, key staff turnover rate, credit memos per dollar of revenue, customer wait time in call centers, and such.
The Treacy Wiersema Model
Michael Treacy and Fred Wiersema described a model of business value in their study, "Customer Intimacy and Other Value Disciplines," [6] published in the Harvard Business Review, and expanded further in their book, The Discipline of Market Leaders. [7] Closely aligned with the balanced scorecard, the Treacy-Wiersema model has three focus areas. The first is customer intimacy, in which the concept of relationship management as a business value is foremost. Customer intimacy is characterized by a harmonious alignment of business values in a chain that interconnects the customer and the business. Product, service, and support are more or less tailored to an individual customer. Many projects, especially in the evolving "e-business" of integrated business systems, are aimed squarely at customer intimacy. The objective of these e-business projects is to provide complementary cross-user functionality and shared workload across the channel, presumably doing the task at the most effective end of the channel at the least or most effective cost. A subtler objective is to raise barriers to exit of the relationship and thereby close out competitors. It is almost axiomatic that the cost of sales to retain and nurture an existing customer is far less than the cost of marketing, selling, and closing a new customer.
The second focus area of the Treacy-Wiersema model is product excellence or superiority. The objective is to be differentiated from competitors and create an "ah-hah!" demand. Obviously, such demand can usually command a price premium. There must be a dedication to innovation, upgrade, and new ideas. Risk taking, at least in product and service development and delivery, is the norm. Naturally, this is a target-rich area for project managers, and the performance measures are typically market share, customer satisfaction, revenues, and profits.
The third area is operational excellence. Internal processes, methods, and procedures are made as "frictionless" as possible. Repetition is exploited to reduce errors and minimize variance to the mean outcome. This area is taken quite broadly and would in most businesses encompass some of the innovation and learning goals from the balanced scorecard. A good example of operational excellence exists in the back-office billing and administration systems. As an example, health-care administrator companies strive to be operationally excellent, providing uniformly the same service to each and all customers.
Treacy and Wiersema make the point that it is difficult, if not out and out inconsistent, to excel in all three areas. Product excellence and operational efficiency may conflict culturally and financially. Customer intimacy may also conflict with operational efficiency. You would not expect customer intimacy from your health-care administrator; you want a frictionless, repeatable experience with a call center if you need help. Operational efficiency could be the mantra of the low-cost commodity provider, and many customers would be quite happy with that. Of course, for commodity providers there are few barriers to exit, and customers vote with their feet and their pocketbook.
The Kano Model
The Kano model is more narrowly focused than the former two models discussed. Named for Dr. Noriaki Kano and widely described in the literature, [8], [9] the model is aimed at capturing the voice of the customer for requirements for products and service. Originally conceived in the 1970s as a quality tool for obtaining a good match of customer need and product feature and function, project managers can apply this tool not only for grading requirements but also for evaluating budget allocations and priorities, and for assessing qualitative risks. In this regard, Kano models are quite useful for project managers who must make dollar decisions about where discretionary funds can be best leveraged for business value.
Kano really only addresses two of the focus areas already described: customer perspective and product excellence. The Kano model pretty much ignores operational effectiveness, except as operational effectiveness is reflected in product or service quality that influences customer satisfaction. Of the three models, the Kano model is very tactical and applies readily to projects.
The Kano model is most often represented as a graph, with two axes as shown in Figure 1-4. The vertical axis is the customer satisfaction scale, reaching from very satisfied, to indifferent in the center, to very dissatisfied. Although a numeric scale is not often used, project managers seeking more quantification could apply a scale. [10]
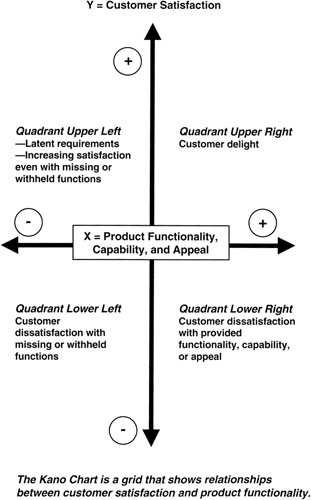
Figure 1-4: Kano Graph.
The horizontal axis is product or service functionality or performance. To the right is desired or available functionality or performance, with stronger desire or need represented by a farther distance outward from the center. To the left is missing functionality or poor performance. Again, the same ideas of numeric scaling could be applied to this axis. In the center is a neutral area in which functionality is unevaluated, but also this is where the center of the customer satisfaction axis crosses.
Of course, the axes are laid out on a graph to cross at the center and provide an orthogonal space in four quadrants suitable for plotting. In this space, a set of curves is plotted. Let us consider the first quadrant in the upper left of the plotting space. We see this illustrated on the Kano graph. In this quadrant, customer satisfaction is increasing, but there is little expectation for functionality. In this space are latent, or unspoken, requirements — missing functionality but also unknown or unappreciated by the customer. In the upper left quadrant there is little or no impact on customer satisfaction. From the project management perspective, this space means that no investment need go into filling the missing functions since they have little impact. However, there is opportunity insofar as a function or feature might be "promoted" from the upper left quadrant to the upper right quadrant.
The upper right quadrant is the "ah-hah!" space where the customer recognizes increasing, available, or known functionality as real value add. Kano calls this the customer delight quadrant. In the upper right quadrant are functions and features that the customer did not know were wanted until the functions were revealed. This is the quadrant of "home runs" and new-to-the-world product risks. Spending is discretionary in the upper right quadrant. For the project manager, requirements plotted in the upper right quadrant carry above-average risk, increasingly so as the plot moves farther from the center origin. The impacts on cost management and schedule are more probable, making their risks rise to the top of the list of risks to be watched.
Moving to the lower half of the plotting space, we next consider the lower right quadrant shown on the Kano graph. This is an area of distress. The customer is not satisfied in spite of function, feature, or service that is provided. The project manager is compelled to address these requirements, dedicating resources to their fix. Resource allocation to this quadrant competes with the resources that might or should go into the upper right quadrant. The project manager, along with other team members, particularly whomever holds the best relationship with the customer, must make the call about resource contention between the upper and lower right spaces.
Finally we come to the lower left quadrant. This quadrant is the flip side of its cousin above. If functionality is missing or poorly provided, the customer is unhappy, perhaps very unhappy. This quadrant consumes resources for the needed fix, competing with the other two (upper and lower right) as shown on the Kano graph.
There is actually a fifth space, really only a line: the horizontal axis. Along this axis, function and feature may be provided, as on the right side, or not provided at all, as on the left side, but the customer cares not one way or the other. This is the line of total indifference on the part of the customer. In fact, we plot the first of our curves along this axis and label it the "I" curve for indifference.
What may lie along this axis? Actually, quite a lot usually goes here. Project managers put all the regulatory requirements, whether internal or external, on this axis. What about risk? Well, some of these requirements may carry quite a lot of risk but add nothing to customer satisfaction, at least as perceived by the customer. Certainly the project manager should take no more risk than necessary and challenge any new additions to the "I" requirements.
There are three other curves that are more interesting. [11] The first is the "L" curve, or the linear line that extends from the lower left to the upper right through the center. This is the "more is better" line. For features represented on this line, providing "more" simply increases customer satisfaction. A good example is computer memory: more is better, always! Correspondingly, a lack of memory will upset the customer, and the more missing the worse will be the effect. From the point of view of meeting the competition, it is almost mandatory to fund these requirements, at least to some degree, to stay in the race. Commensurate risks must be taken, or else product obsolescence will doom all future sales.
A third curve is the "M" curve, which stands for "must be there." The "M" curve is shown in Figure 1-5. Running along the horizontal axis on the right side, and dipping into the lower left quadrant, the "M" curve is appropriate where the presence of a function raises little reaction with the customer, but if the function is missing, then there is customer dissatisfaction. With requirements of this type, the project manager should take no risks and invest only that which is necessary to maintain the function without adding to it. Now, there is opportunity to "promote" from "M" to "I". Did Apple make this move when it dropped the floppy disk drive in its desktop computers?
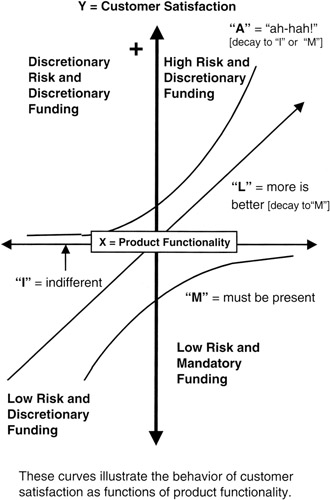
Figure 1-5: Kano Curves.
Perhaps of most interest is the "A" curve, which stands for the "ah-hah!" reaction. It is the mirror image of the "M" curved flipped around so that it runs along the horizontal axis on the left side and then rises into the upper right quadrant. Requirements along the "A" line do not upset the customer if missing but engender a very favorable reaction if present. If acted on, "A"s are the requirements of greatest risk, perhaps new to the world. "A"s require the most attention in terms of funding, risk management, and performance measurement.
Table 1-1 provides a summary of a potential product analyzed with the Kano model. Here we see a list of requirements that are characterized by their funding need, risk potential, and fit to the Kano plot space.
|
Requirement |
Funding |
Risk |
|---|---|---|
|
Packaging and eye appeal |
Discretionary investment targeted for high returns |
Take all necessary risks to assure success |
|
Faster CPU and larger memory |
Constant refreshment required; reserve funds to meet needs |
Take prudent risks to maintain market acceptance |
|
FCC compliance |
Mandatory funding to meet minimum requirements |
Take no risks not essential to meeting compliance specification |
|
Floppy disk drive |
If market demands, fund lowest cost supplier |
Take no risks; mature device |
|
CD-RW drive |
Initially, discretionary investment targeted for high returns |
CD-RW decays to M quickly; minimize risk to balance rewards |
[5]Kaplan, Robert S. and Norton, David P., The balanced scorecard — measures that drive performance, Harvard Business Review, pp. 71–79, January–February 1992.
[6]Treacy, Michael and Wiersema, Fred, Customer intimacy and other value disciplines, Harvard Business Review, pp. 84–93, January–February 1993.
[7]Treacy, Michael and Wiersema, Fred, The Discipline of Market Leaders: Choose Your Customers, Narrow Your Focus, Dominate Your Market, Perseus Books, Cambridge, MA, 1996.
[8]Kano, Noriaki, Attractive quality and must-be quality, Journal of the Japanese Society for Quality Control, pp. 39–48, April 1984.
[9]Shiba, Shoji, Graham, Alan, and Walden, David, A New American TQM: Four Practical Revolutions in Management, Productivity Press, Portland, OR, 1993, pp. 221–224.
[10]The scales applied to the Kano model need not be linear. Indeed, a logarithmic scale going from the center origin toward the outer reaches of satisfaction, both positive and negative, could be quite helpful if there is great range to be plotted. Or, the logarithmic scale could be applied to product functionality, left and right. Applying a scale to one or the other of the axes creates a "log-linear" plotting space. Of course, project managers familiar with logarithmic scales will know that a straight line plotted on a log scale will be a curve.
[11]In the original Kano model, which grew out of work in the 1970s for the camera company Konica, there were in fact only three curves. The "I" curve along the axis was not included. Kano named his three curves a little differently than as presented here. Kano's names were: "excitement" for the curve this book calls the "ah-hah!" reaction, "performance" for "more is better," and "threshold" for "must have." Many references in the literature use the original names. Dr. Kano's research objective was to model "attractive quality" and distinguish that from "must-be" quality. "Must-be" quality was seen as a minimum or threshold to customer satisfaction. Below this threshold, customers would object; at the threshold, customers would not notice or would not make a competitive buying decision one way or the other.
A Framework for Value, Risk, and Capability The Project Balance Sheet
Over a number of years of working with project teams and executive sponsors, this author has conceived and evolved the concept of the project balance sheet. [12], [13] The project balance sheet is a conceptual and quantitative model suitable for relating business value with project capability and risk. To this point, we have discussed three well-known models of business value and customer expectation. Now it remains to couple these models to projects. Coupling to projects also provides a means to relate the numerical expressions of business value with the numerical measures of project capability and performance.
We begin with this premise: project sponsors and business executives who charter projects and invest in their success have an expectation of results, more often than not results that exceed the project investment, and for these investment gains, they are willing to accept some risk. These expected results support directly the goals and strategies that back up the value models we have discussed.
Project managers, on the other hand, accept the charter as their marching orders, developing a scope statement and an estimate of resources that corresponds. Now it often comes to pass that the project manager discovers that the available investment comes up short of the resources estimated, given that the full scope is embraced. Negotiations begin, but in the final analysis there usually remains a gap between capability and capacity on the project side and the value imperatives on the business side. What to do? The answer is: take a risk. How much risk? Only as much risk as is necessary to balance business needs and values on the one side with project abilities and needs on the other side. Who takes this risk? The project manager; the project manager is the ultimate risk manager. [14]
Financial Accounting
An understanding of balance sheet math is needed in order to proceed. For project managers not familiar with the balance sheet idea from the domain of financial accounting, here is a quick overview. First, the balance sheet is nothing more than a graphical or tabular way to show a numerical relationship: y = a + b. However, this relationship is not functional since all three of the variables are independent and, because of the equality sign, a relationship exists among the three that makes them interdependent as well. Thus, a change in one requires a change in another to maintain equality among the three. This equality is called "balance" in the accounting world, and the process by which if one variable changes then another must change in a compensating way to maintain balance is called "double entry accounting."
Second, accountants would understand the equation this way: assets ("y") = liabilities ("a") + equities ("b"). That is their "accounting equation." If assets increase, then so must either or both liabilities and equity increase in order to maintain balance. In fact, any change in the variables must be compensated by a change in one or two of the other two variables.
There is an important business concept to go along with the math: assets are property of the company put in the custody of the company managers to employ when they execute the business model. Assets are among the resources to be used by project managers to execute on projects. Assets are paid for by liabilities (loans from outsiders) and capital, also called equity. Equity is the property of the owners and liabilities are the properties of the creditors of the company. Thus, some stakeholders in the project arise naturally from the accounting equation: the financiers of the assets! As noted, these are the suppliers (accounts payable liabilities), creditors (long-term and short-term notes), and owners or stockholders (equity owners).
An asset cannot be acquired — that is, its asset dollar value increased — without considering how its acquisition cost is to be paid (increase in liability or capital, or sale of another asset). An asset cannot be sold — that is, its dollar value decreased — without accounting for the proceeds. Typical assets, liabilities, and equity accounts are shown in Table 1-2. A balance sheet for a small company is shown in Table 1-3.
|
Assets |
Liabilities and Capital Employed |
||||||||
|---|---|---|---|---|---|---|---|---|---|
|
Current Assets |
Current Liabilities |
||||||||
|
Cash on hand |
$10,000 |
Vendor payables |
$3,000 |
||||||
|
Receivables |
$40,000 |
Short-term notes |
$35,000 |
||||||
|
Finished inventory |
$15,500 |
||||||||
|
Work in process |
$5,500 |
||||||||
|
Long-Term Assets |
Long-Term Liabilities |
||||||||
|
Buildings |
$550,000 |
Mortgages |
$200,000 |
||||||
|
Software and equipment |
$250,000 |
||||||||
|
Supplier loan |
$35,000 |
||||||||
|
Equities or Capital Employed |
|||||||||
|
Capital paid in |
$400,000 |
||||||||
|
Retained earnings |
$170,000 |
||||||||
|
Stock ($1 par) |
$98,000 |
||||||||
|
Total Assets |
Total Liabilities and Equities |
||||||||
|
$906,000 |
$906,000 |
||||||||
|
|
||||||||
|
Assets |
Liabilities and Capital Employed |
||||||
|---|---|---|---|---|---|---|---|
|
Current Assets |
Current Liabilities |
||||||
|
Cash in checking and savings accounts |
Monies owed to suppliers |
||||||
|
Monies owned by customers (receivables) |
Short-term bonds or other short-term debt |
||||||
|
Inventory that can be sold immediately |
|||||||
|
Long-Term Assets |
Long-Term Liabilities |
||||||
|
Overdue receivables |
Mortgages |
||||||
|
Loans to suppliers |
Long-term bonds |
||||||
|
Investments in notes, real estate, other companies |
Overdue payables |
||||||
|
Plant and equipment |
Equity |
||||||
|
Software (large value) |
Cash paid in by investors for stock |
||||||
|
Retained earnings from operations and investments |
|||||||
|
|
Debits and Credits
Accountants have their own curious methods for referring to changes on each side of the balance sheet. Traditionally, assets are shown on the left and liabilities and capital are on the right. Dollar increases on the left side are called debits. Increases on the right side are called credits. Debits and credits are only allowed to be positive numbers; that is, one does think of recording a negative debit. Debiting an asset always means increasing its dollar value. To reduce an asset's dollar value, it is credited. No particular connotation of good or bad should be assigned to the words debit and credit; they are simply synonyms for dollar increases left and right.
There may be a question at this point. If negative numbers are not used on the balance sheet, how do we keep track of things that have balances that go up and down? Enter the "T" chart. We set up a "T" chart for a specific asset, like cash, defining both a right and left side on the cash "T" chart. (Refer to Figure 1-6 for an illustration.) We can then record all credits on the right side of the "T" chart and then net them with the starting balance and subsequent debits on the left side. Then, when it is time to compute a new balance sheet, we record the new net amount on the left side of the balance sheet for cash. "T" charts are not mini-balance sheets. They do not convey an equation. Their left and right sides do not need to balance. They are simply a recording mechanism, in chart form, for individual transactions, debits and credits.
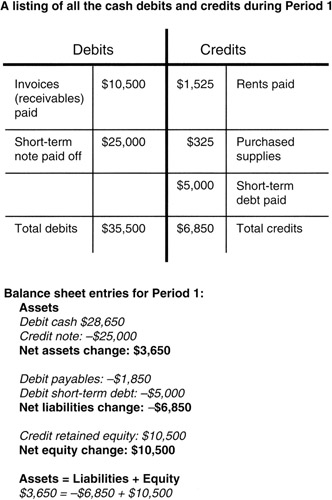
Figure 1-6: "T" Chart for Cash.
However, if cash has been credited, we also need a second change, a debit, on the balance sheet to maintain the balance. If cash is to be credited, then a liability must be debited (decreased) or another asset is debited (increased). For example, we could use the cash to buy an asset and all would be in balance. Again refer to Figure 1-6 to see how this is done.
Project managers in some companies are asked to review the monthly "trial balance." The trial balance is a listing of all the debits and credits recorded in a period. Naturally, they should balance. Of course, a debit or credit could have been made to a wrong account and the trial balance still balance. That is where the project manager can add value: by determining that all the project debits and credits have been applied to the proper accounts.
Here is an important point: balance sheets do not record flows, that is, a change in dollars over a period. They show only the balance in accounts on a specific date, like apples in a barrel. To see a flow, two balance sheets — one at period beginning and one at period ending — need to be compared.
How about your ATM or "debit" card that you carry around? Is it correctly named? Yes it is; let us see why. The money in your checking account is a short-term liability on the bank's balance sheet. It is money owned by outsiders (you) and thus it conforms to the definition of a liability. It finances or pays for an asset of equal amount, the bank's cash on hand. Everything is in balance. Suppose you want to take some of your money out of the bank. This will decrease the bank's liability to you. Recall that transactions to liabilities are credits (increases), so in order to decrease a liability we record a debit to the liability. To wit: a decrease of a liability is a debit to the liability; thus the "debit card." Now, of course, we still need the second transaction to the balance sheet to maintain the balance. If the liability is to be debited, then an asset must be credited (decreased), like the bank's cash on hand, or another liability is credited (increased), like a short-term note, to obtain the money to pay you.
Now that we understand a little bit about how accountants do their math, let us get back to project management.
The Project Balance Sheet
We now consider the insights about the business learned from the accounting balance sheet that will provide a quantitative framework for the project manager. First we direct our attention to the three elements that are necessary to form a balance sheet. To charter the project, business sponsors assign resources and state the required project returns needed for the business. Project returns are both functional and financial. Any one of the business value models we have discussed could be used to form the sponsor's view of the project. Sponsor-invested resources correspond roughly to the capital or equity investments on the accountant's balance sheet. As many companies are measured by the returns earned on the capital employed, so it is with projects. We will discuss in subsequent chapters that a project metric in wide use is the concept of economic value add (EVA). In effect, EVA demands positive returns on capital employed.
Second, the project manager is entrusted with resources owned by the business to carry out the project. These resources correspond roughly to the company-owned assets of the accountant's balance sheet. Like company managers who are often measured on their ability to create a return on the assets entrusted to them, so it is with project managers. Project managers are always judged on their ability to employ successfully the sponsor's resources to achieve the project objectives.
Third, there is the gap between the investment made available and the resources required. On the accountant's balance sheet, this gap between investment and resources is filled with loans from outsiders: suppliers and creditors. On the project balance sheet, the gap is filled with risk! Risk is taken, or assumed, to fill the gap between expectations and capabilities, between sponsor investment and project estimates of resources. Figure 1-7 illustrates the tool we have been discussing.
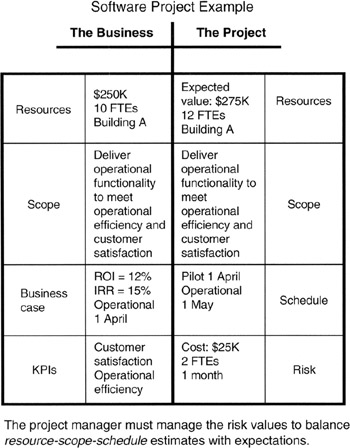
Figure 1-7: The Project Balance Sheet.
We now have the elements for the "project equation," a direct analog to the accounting equation: "Value delivered from resources invested = project capability and capacity plus risks taken." [15]
For project managers, their mission is now defined: "The project manager's mission is to manage project capability and capacity to deliver expected value, taking measured risks to do so." [16] [17]
Project Balance Sheet Details
The project balance sheet seeks to make a quantitative and qualitative connection between the business and the project. On the left side, the business side, is the sponsor's view of the project. The sponsor's view is conceptual and value oriented, nearly void of facts, or at least void of the facts as the project manager would understand them. Often the sponsor has no specific understanding of project management, of cost and schedule estimating for research and development, or of statistical analysis of risk, and does not seek to acquire an understanding. In system engineering parlance, the project sponsor sees the project as a "black box." However, the sponsor knows what the business requires and knows how much investment can be made toward the requirements.
The project manager has the facts about the project, even if they are only rough estimates. The project manager knows and understands the scope, even if the scope has "known unknowns" that require more investigation and definition. [18] We have already made the point that risk balances the facts with the concepts. However, a bridge is needed to couple unambiguously the sponsor's understanding and the project manager's understanding of the same project. That bridge between project manager and business manager is a common understanding of scope. Even with language and experience barriers, scope is the translator. The test for the project manager is then to ensure that there is good understanding of scope and then to convey the risks in business terms. This done, the project charter can be signed with expectation of good results to come.
Now what about debits and credits? Where do they come into the project balance sheet? Like the accounting equation, the project equation is not a functional equation of the form y = f(x) + c that specifies y to be functionally dependent on x. Indeed, the left and right sides are pretty much independent, just like in the financial domain. By independent, we mean that the estimates of cost and schedule done by the project manager are based on the facts developed by the project team for the work specified in the work breakdown structure (WBS). Those project team estimates are not, or should not be, dependent on the business value estimate developed by the project sponsor. However, once the charter is set, a change in one of the three elements (business value on the left side, risk or project capability on the right side) requires that another of the three elements must correspondingly change to maintain balance.
If, for instance, we continue to say debits are increases to the left and credits are increases to the right, then a debit of scope by the sponsor (that is, an increase in scope) must have a corresponding credit on the right or else balance is violated. By way of another example, if the situation were that the project manager had to credit the capability, [19] and no debit was available from the sponsor, then the required debit must go to risk in order to restore balance.
But is balance really all that important? Yes. The interpretation of imbalance is that there is not a meeting of the minds regarding the value demanded (left side) and the likelihood of successful delivery (right side). Consequently, the project may not be sustained, sponsor confidence in results may be challenged, and the project team may not be supported adequately during execution.
Integrating the Project Balance Sheet and Business Value Models
Now let us integrate the concepts discussed in this chapter to complete the framework on which we hang quantitative analysis to be discussed in the remainder of this book. The business models drive the left side of the project balance sheet. The model results, working through the value flow-down process, frame opportunity (new products, new markets and customers, operational and organizational needs) and quantify goals. Goals, deployed through strategy, lead to identified projects. It remains to select among the identified projects those that are affordable, most beneficial, or of highest priority to the business. We will discuss decision making in quantitative terms in Chapter 4. Suffice it to say there is a means to make these selections and charter the project. The generally accepted definition of the project charter is "a document issued by senior management that formally authorizes the existence of a project..." [20] More about the charter can be found in the literature, primarily A Guide to the Project Management Body of Knowledge. [21] With charter in hand, the project sponsor conveys the project requirements and investment allocation to the project manager. Doing so completes the chain from business executive to project sponsor, thence to project manager through the connectivity of the project charter and the left-to-right-side bridging effect of scope on the project balance sheet, as illustrated in Figure 1-8.
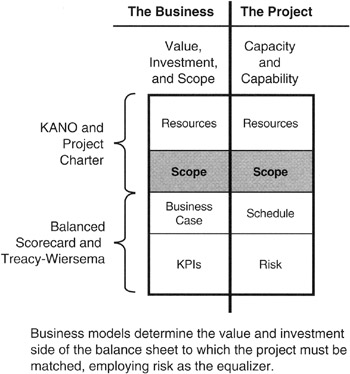
Figure 1-8: Business Models and Project Balance Sheet.
We now have a consistent and traceable path to and from the source of business value for numbers from the right side of the project balance sheet representing capability and risk. A traceable path is needed, after all, because projects draw their value only from the business.
On the right side of the balance sheet we have two elements: (1) project capability and capacity and (2) risk. A well-accepted method to express capability and capacity is with the so-called "iron triangle" of scope, time, and cost. Since there is interdependency among these three, it is traditionally to set the one of highest priority, optimize the second highest priority element, and the third becomes what is necessary to close the triangle. This author prefers the "project four-angle" of scope, schedule, resources, and quality as shown in Figure 1-9. The set-and-optimize process is about the same as in the iron triangle, except that two elements could be involved in the setting or optimizing.
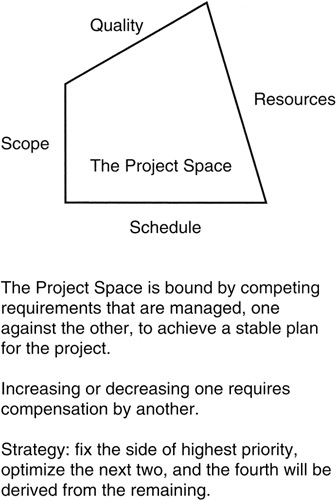
Figure 1-9: The Project Four-Angle.
We will see in Chapter 3 that the best quantification tool for scope is the WBS. Time and cost can be estimated for the scope on the WBS somewhat independently, but ultimately they are tied together through the concept of value. Earned value is the preferred numerical analysis tool, and that will be discussed in Chapter 6. There are numerous ways to evaluate quality. One we will address in Chapter 8 is Six Sigma.
Finally, there is risk. Risk in quantitative terms is expressed in the same units as the related item in the project capability and capacity. The risk component of the right side of the balance sheet holds the variance to the mean that must be managed in order not to endanger the business investment.
Figure 1-10 illustrates the points discussed.
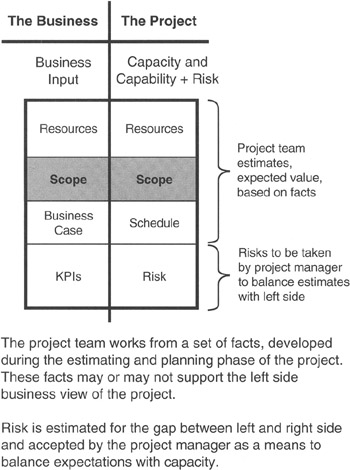
Figure 1-10: Right Side Project Balance Sheet.
[12]Goodpasture, John C. and Hulett, David T., A balance sheet for projects: a guide to risk-based value, PM Network, May (Part 1) and June (Part 2) 2000.
[13]Goodpasture, John C., Managing Projects for Value, Management Concepts, Vienna, VA, 2001, chap. 3.
[14]The author is indebted to Lou Lavendol, Senior Systems Engineer at Harris Corporation, Melbourne, Florida, for his insightful discourse with the author regarding risk taking and business value in the context of proposing on defense industry programs. In those discussions in the early 1990s, the tension was between marketing (sales) that represented the voice of the customer and system engineering that represented the project. Often, there was a gap between marketing and engineering, a gap that could only be filled by someone taking a risk.
[15]Goodpasture, John C., Managing Projects for Value, Management Concepts, Vienna, VA, 2001, chap. 3., p. 46.
[16]Goodpasture, John C., Managing Projects for Value, Management Concepts, Vienna, VA, 2001, chap. 3., p. 46.
[17]The author has paraphrased slightly the project equation and the project manager's mission from the text given in the reference (also the author's work).
[18]"Known unknowns" is a concept from risk management. The idea is simply that in framing the scope, there may be many unknowns, but the fact that there are undefined elements of scope is itself known.
[19]Recall that we are using the word "capability" to stand in for the set (scope, cost, time, and quality). To credit capability means that either cost or time has increased, scope has expanded without corresponding relief from the project sponsor, or there is a greater demand on quality. A greater demand on quality usually means tighter tolerances, less scrap and rework, fewer functional or performance errors in the production deliverable, or perhaps lesser life cycle investment forecast for service and maintenance after delivery.
[20]A Guide to the Project Management Body of Knowledge (PMBOK Guide) — 2000 Edition, Project Management Institute, Newtown Square, PA, p. 204.
[21]A Guide to the Project Management Body of Knowledge (PMBOK Guide) — 2000 Edition, Project Management Institute, Newtown Square, PA, p. 54.
Summary of Important Points
Table 1-4 provides the highlights of this chapter.
|
Point of Discussion |
Summary of Ideas Presented |
|---|---|
|
Successful projects |
|
|
Business value motivates projects |
|
|
Balanced scorecard |
|
|
Treacy-Wiersema model |
|
|
Kano model |
|
|
Accounting balance sheet |
|
|
Project balance sheet |
|
References
1. A Guide to the Project Management Body of Knowledge (PMBOK Guide) — 2000 Edition, Project Management Institute, Newtown Square, PA, p. 204.
2. Goodpasture, John C., Managing Projects for Value, Management Concepts, Vienna, VA, 2001.
3. Hamel, Gary and Parahalad, C.K., The core competence of the corporation, Harvard Business Review, pp. 79–90, May–June 1990.
4. Hamel, Gary and Parahalad, C.K., Competing for the Future, Harvard Business School Press, Boston, MA, 1994, chap. 9.
5. Kaplan, Robert S. and Norton, David P., The balanced scorecard — measures that drive performance, Harvard Business Review, pp. 71–79, January–February 1992.
6. Treacy, Michael and Wiersema, Fred, Customer intimacy and other value disciplines, Harvard Business Review, pp. 84–93, January–February 1993.
7. Treacy, Michael and Wiersema, Fred, The Discipline of Market Leaders: Choose Your Customers, Narrow Your Focus, Dominate Your Market, Perseus Books, Cambridge, MA, 1996.
8. Kano, Noriaki, Attractive quality and must-be quality, Journal of the Japanese Society for Quality Control, pp. 39–48, April 1984.
9. Shiba, Shoji, Graham, Alan, and Walden, David, A New American TQM: Four Practical Revolutions in Management, Productivity Press, Portland, OR, 1993, pp. 221–224.
10. Goodpasture, John C. and Hulett, David T., A balance sheet for projects: a guide to risk-based value, PM Network, May (Part 1) and June (Part 2) 2000.
11. Goodpasture, John C., Managing Projects for Value, Management Concepts, Vienna, VA, 2001, chap. 3.
12. Goodpasture, John C., Managing Projects for Value, Management Concepts, Vienna, VA, 2001, chap. 3., p. 46.
13. A Guide to the Project Management Body of Knowledge (PMBOK Guide) — 2000 Edition, Project Management Institute, Newtown Square, PA, p. 204.
14. A Guide to the Project Management Body of Knowledge (PMBOK Guide) — 2000 Edition, Project Management Institute, Newtown Square, PA, p. 54.
Preface
- Project Value: The Source of all Quantitative Measures
- Introduction to Probability and Statistics for Projects
- Organizing and Estimating the Work
- Making Quantitative Decisions
- Risk-Adjusted Financial Management
- Expense Accounting and Earned Value
- Quantitative Time Management
- Special Topics in Quantitative Management
- Quantitative Methods in Project Contracts
EAN: 2147483647
Pages: 97
- Chapter III Two Models of Online Patronage: Why Do Consumers Shop on the Internet?
- Chapter V Consumer Complaint Behavior in the Online Environment
- Chapter VII Objective and Perceived Complexity and Their Impacts on Internet Communication
- Chapter X Converting Browsers to Buyers: Key Considerations in Designing Business-to-Consumer Web Sites
- Chapter XIV Product Catalog and Shopping Cart Effective Design
