Literature Review
In the 1960s and earlier, when software development was simply "code and test" and software projects were characterized by cost overruns and schedule delays, the only defect removal step was testing. In the 1970s, formal reviews and inspections were recognized as important to productivity and product quality, and thus were adopted by development projects. As a result, the value of defect removal as an element of he development process strengthened . In his classic article on design and code inspections, Fagan (1976) touches on the concept of defect removal effectiveness. He defined error detection efficiency as:
![]()
In an example of a COBOL application program Fagan cites, the total error detection efficiency for both design and code inspection was 82%. Such a degree of efficiency seemed outstanding. Specifically, the project found 38 defects per KNCSS (thousand noncommentary source statements) via design and code inspections, and 8 defects per KNCSS via unit testing and preparation for acceptance testing. No defects were found during acceptance testing or in actual usage in a six-month period. From this example we know that defects found in the field (actual usage of the software) were included in the denominator of Fagan's calculation of defect removal efficiency.
Intriguingly, the concept of defect removal effectiveness and its measurements were seldom discussed in the literature, as its importance would merit, until the mid-1980s (Jones, 1986). Not surprisingly, Jones's definition, stated here, is very similar to Fagan's:
![]()
In Jones's definition, defects found in the field are included in the denominator of the formula.
IBM's Federal Systems Division in Houston, Texas, developed mission-specific space shuttle flight software for the National Aeronautics and Space Administration (NASA) and was well known for its high product quality. The space shuttle is "fly-by-wire"; all the astronaut's commands are sent from flight-deck controls to the computers, which then send out electronic commands to execute a given function. There are five computers onboard the shuttle. The Primary Avionics Software System (onboard software) is responsible for vehicle guidance, navigation, flight control, and numerous systems management and monitoring functions, and also provides the interface from the vehicle to crew and ground communications systems. The onboard software contains about 500,000 lines of source code. In addition, there are about 1.7 million lines of code for the ground software systems used to develop and configure the onboard system for shuttle missions (Kolkhorst and Macina, 1988).
IBM Houston won many quality awards from NASA and from the IBM Corporation for its outstanding quality in the space shuttle flight systems. For example, it received the first NASA Excellence Award for Quality and Productivity in 1987 (Ryan, 1987), and in 1989 it won the first Best Software Laboratory Award from the IBM Corporation. Its shuttle onboard software (PASS) achieved defect-free quality since 1985, and the defect rate for the support systems was reduced to an extraordinarily low level. IBM Houston took several key approaches to improve its quality, one of which is the focus on rigorous and formal inspections. Indeed, in addition to design and code inspections, the IBM Houston software development process contained the phase of formal requirements analysis and inspection. The requirements, which are specified in precise terms and formulas, are much like the low-level design documents in commercial software. The rationale for the heavy focus on the front end of the process, of course, is to remove defects as early as possible in the software life cycle. Indeed, one of the four metrics IBM used to manage quality is the early detection percentage, which is actually inspection defect removal effectiveness. From Ryan (1987) and Kolkhorst and Macina (1988):
![]()
where total number of errors is the sum of major inspection errors and valid discrepancy reports (discrepancy report is the mechanism for tracking test defects).
According to IBM Houston's definitions, a major inspection error is any error found in a design or code inspection that would have resulted in a valid discrepancy report (DR) if the error had been incorporated into the software. Philosophical differences, errors in comments or documentation, and software maintenance issues are inspection errors that may be classified as minor and do not enter into this count. Valid DRs document that the code fails to meet the letter, intent, or operational purpose of the requirements. These DRs require a code fix, documented waiver , or user note to the customer. From the preceding formula it appears that the denominator does not include defects from the field, when the software is being used by customers. In this case, however, it is more a conceptual than a practical difference because the number of field defects for the shuttle software systems is so small.
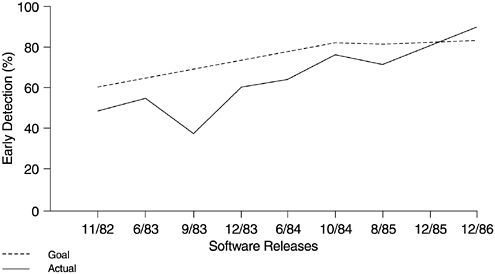
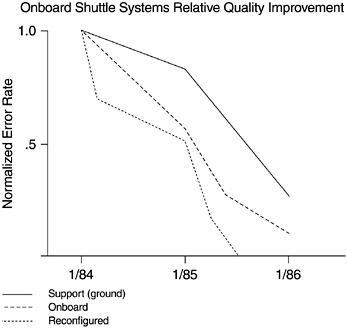
IBM Houston's data also substantiated a strong correlation between inspection defect removal effectiveness and product quality (Kolkhorst and Macina, 1988). For software releases from November 1982 to December 1986, the early detection percentages increased from about 50% to more than 85%. Correspondingly, the product defect rates decreased monotonically from 1984 to 1986 by about 70%. Figures 6.1 and 6.2 show the details.
Figure 6.1. Early Detection of Software Errors
From "Developing Error-Free Software," by IEEE AES Magazine : 25 “31. Copyright 1988 IEEE. Reprinted with permission.

Figure 6.2. Relative Improvement of Software Types
From "Developing Error-Free Software," by IEEE AES Magazine : 25 “31. Copyright 1988 IEEE. Reprinted with permission.

The effectiveness measure by Dunn (1987) differs little from Fagan's and from Jones's second definition. Dunn's definition is:
![]()
where
E = Effectiveness of activity (development phase)
N = Number of faults (defects) found by activity (phase)
S = Number of faults (defects) found by subsequent activities (phases)
According to Dunn (1987), this metric can be tuned by selecting only defects present at the time of the activity and susceptible to detection by the activity.
Daskalantonakis (1992) describes the metrics used at Motorola for software development. Chapter 4 gives a brief summary of those metrics. Two of the metrics are in fact for defect removal effectiveness: total defect containment effectiveness (TDCE) and phase containment effectiveness (PCE i ). For immediate reference, we restate the two metrics:
![]()
![]()
where phase i errors are problems found during that development phase in which they were introduced, and phase i defects are problems found later than the development phase in which they were introduced.
The definitions and metrics of defect removal effectiveness just discussed differ little from one to another. However, there are subtle differences that may cause confusion. Such differences are negligible if the calculation is for the overall effectiveness of the development process, or there is only one phase of inspection. However, if there are separate phases of activities and inspections before code integration and testing, which is usually the case in large-scale development, the differences could be significant. The reason is that when the inspection of an early phase (e.g., high-level design inspection) took place, the defects from later phases of activities (e.g., coding defects) could not have been injected into the product yet. Therefore, "defects present at removal operation" may be very different from (less than) "defects found plus defect found later" or " N + S ." In this regard Dunn's (1987) view on the fine tuning of the metric is to the point. Also, Motorola's PCE i could be quite different from others. In the next section we take a closer look at this metric.
What Is Software Quality?
Software Development Process Models
- Software Development Process Models
- The Waterfall Development Model
- The Prototyping Approach
- The Spiral Model
- The Iterative Development Process Model
- The Object-Oriented Development Process
- The Cleanroom Methodology
- The Defect Prevention Process
- Process Maturity Framework and Quality Standards
Fundamentals of Measurement Theory
- Fundamentals of Measurement Theory
- Definition, Operational Definition, and Measurement
- Level of Measurement
- Some Basic Measures
- Reliability and Validity
- Measurement Errors
- Be Careful with Correlation
- Criteria for Causality
Software Quality Metrics Overview
- Software Quality Metrics Overview
- Product Quality Metrics
- In-Process Quality Metrics
- Metrics for Software Maintenance
- Examples of Metrics Programs
- Collecting Software Engineering Data
Applying the Seven Basic Quality Tools in Software Development
- Applying the Seven Basic Quality Tools in Software Development
- Ishikawas Seven Basic Tools
- Checklist
- Pareto Diagram
- Histogram
- Run Charts
- Scatter Diagram
- Control Chart
- Cause-and-Effect Diagram
- Relations Diagram
Defect Removal Effectiveness
- Defect Removal Effectiveness
- Literature Review
- A Closer Look at Defect Removal Effectiveness
- Defect Removal Effectiveness and Quality Planning
- Cost Effectiveness of Phase Defect Removal
- Defect Removal Effectiveness and Process Maturity Level
The Rayleigh Model
- The Rayleigh Model
- Reliability Models
- The Rayleigh Model
- Basic Assumptions
- Implementation
- Reliability and Predictive Validity
Exponential Distribution and Reliability Growth Models
- Exponential Distribution and Reliability Growth Models
- The Exponential Model
- Reliability Growth Models
- Model Assumptions
- Criteria for Model Evaluation
- Modeling Process
- Test Compression Factor
- Estimating the Distribution of Total Defects over Time
Quality Management Models
- Quality Management Models
- The Rayleigh Model Framework
- Code Integration Pattern
- The PTR Submodel
- The PTR Arrival and Backlog Projection Model
- Reliability Growth Models
- Criteria for Model Evaluation
- In-Process Metrics and Reports
- Orthogonal Defect Classification
In-Process Metrics for Software Testing
- In-Process Metrics for Software Testing
- In-Process Metrics for Software Testing
- In-Process Metrics and Quality Management
- Possible Metrics for Acceptance Testing to Evaluate Vendor-Developed Software
- How Do You Know Your Product Is Good Enough to Ship?
Complexity Metrics and Models
- Complexity Metrics and Models
- Lines of Code
- Halsteads Software Science
- Cyclomatic Complexity
- Syntactic Constructs
- Structure Metrics
- An Example of Module Design Metrics in Practice
Metrics and Lessons Learned for Object-Oriented Projects
- Metrics and Lessons Learned for Object-Oriented Projects
- Object-Oriented Concepts and Constructs
- Design and Complexity Metrics
- Productivity Metrics
- Quality and Quality Management Metrics
- Lessons Learned from OO Projects
Availability Metrics
- Availability Metrics
- 1 Definition and Measurements of System Availability
- Reliability, Availability, and Defect Rate
- Collecting Customer Outage Data for Quality Improvement
Measuring and Analyzing Customer Satisfaction
- Measuring and Analyzing Customer Satisfaction
- Customer Satisfaction Surveys
- Analyzing Satisfaction Data
- Satisfaction with Company
- How Good Is Good Enough
Conducting In-Process Quality Assessments
- Conducting In-Process Quality Assessments
- The Preparation Phase
- The Evaluation Phase
- The Summarization Phase
- Recommendations and Risk Mitigation
Conducting Software Project Assessments
- Conducting Software Project Assessments
- Audit and Assessment
- Software Process Maturity Assessment and Software Project Assessment
- Software Process Assessment Cycle
- A Proposed Software Project Assessment Method
Dos and Donts of Software Process Improvement
- Dos and Donts of Software Process Improvement
- Measuring Process Maturity
- Measuring Process Capability
- Staged versus Continuous Debating Religion
- Measuring Levels Is Not Enough
- Establishing the Alignment Principle
- Take Time Getting Faster
- Keep It Simple or Face Decomplexification
- Measuring the Value of Process Improvement
- Measuring Process Adoption
- Measuring Process Compliance
- Celebrate the Journey, Not Just the Destination
Using Function Point Metrics to Measure Software Process Improvements
- Using Function Point Metrics to Measure Software Process Improvements
- Software Process Improvement Sequences
- Process Improvement Economics
- Measuring Process Improvements at Activity Levels
Concluding Remarks
- Concluding Remarks
- Data Quality Control
- Getting Started with a Software Metrics Program
- Software Quality Engineering Modeling
- Statistical Process Control in Software Development
A Project Assessment Questionnaire
EAN: 2147483647
Pages: 176
