Pareto Diagram
Pareto analysis helps by identifying areas that cause most of the problems, which normally means you get the best return on investment when you fix them. It is most applicable in software quality because software defects or defect density never follow a uniform distribution. Rather, almost as a rule of thumb, there are always patterns of clusterings ”defects cluster in a minor number of modules or components , a few causes account for the majority of defects, some tricky installation problems account for most of the customer complaints, and so forth. It is, therefore, not surprising to see Pareto charts in software engineering literature. For example, Daskalantonakis (1992) shows an example of Motorola's Pareto analysis for identifying major sources of requirement changes that enabled in-process corrective actions to be taken. Grady and Caswell (1986) show a Pareto analysis of software defects by category for four Hewlett-Packard software projects. The top three types (new function or different processing required, existing data need to be organized/ presented differently, and user needs additional data fields) account for more than one-third of the defects. By focusing on these prevalent defect types, determining probable causes, and instituting process improvements, Hewlett-Packard was able to achieve significant quality improvements.
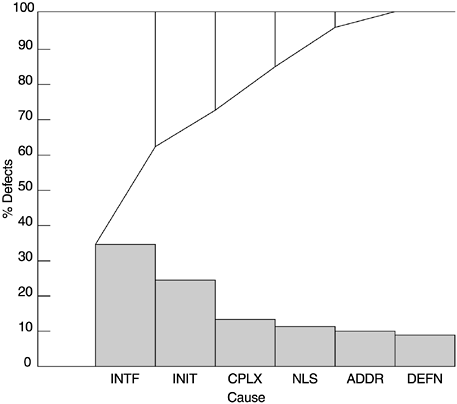
Figure 5.3 shows an example of a Pareto analysis of the causes of defects for an IBM Rochester product. Interface problems (INTF) and data initialization problems (INIT) were found to be the dominant causes for defects in that product. By focusing on these two areas throughout the design, implementation, and test processes, and by conducting technical education by peer experts, significant improvement was observed . The other defect causes in the figure include complex logical problems (CPLX), translation-related national language problems (NLS), problems related to addresses (ADDR), and data definition problems (DEFN).
Figure 5.3. Pareto Analysis of Software Defects
Another example of Pareto analysis is the problem component analysis conducted at IBM Rochester. The AS/400 software system consists of many products and components. To ensure good return on investment in quality improvement resources, a component problem index based on three indicators was calculated for each release of the software system, and for significant improvements strong focus was placed on the problem components. The problem index is a composite index of three indicators:
- Postrelease defects from the new and changed code of the release per thousand new and changed source instructions (defects of current release origin per KCSI). If the components defect rate is
- the same or less than the system target, then score = 0.
- higher than system target but less than twice the system target, then score = 1.
- higher than or equal to twice the system target but less than three times the system target, then score = 2.
- three or more times the system target, then score = 3.
- All postrelease defects are normalized to the total shipped source instructions of the component (all defects per KSSI). This is the defect rate for the entire component including base code from previous releases, ported code, and new and changed code. The scoring criteria are the same as above.
- Actual number of defects categorized by quartiles. If the component is in the first quartile, then score = 0, and so forth. This indicator is from the customers' perspective because customers may not care about the lines of code for the functions and the normalized defect rates. They care about the number of defects they encounter. This indicator may not be fair to large components that will have a greater number of defects even if their defect density is the same as others. However, the purpose of the index is not for quality comparison, but to guide the improvement effort. Thus this indicator was included.
The composite component problem index ranges from 0 to 9. Components with an index of 5 and higher are considered problem components. From a Pareto analysis of a product, 27% of the components had an index of 5 and higher; they accounted for about 70% of field defects (Figure 5.4). As a result of this type of Pareto analysis, formal line items for improving problem components (e.g., component restructure, module breakup, complexity measurement and test coverage, and intramodule cleanup) were included in the development plan and have effected significant positive results.
Figure 5.4. Pareto Diagram of Defects by Component Problem Index
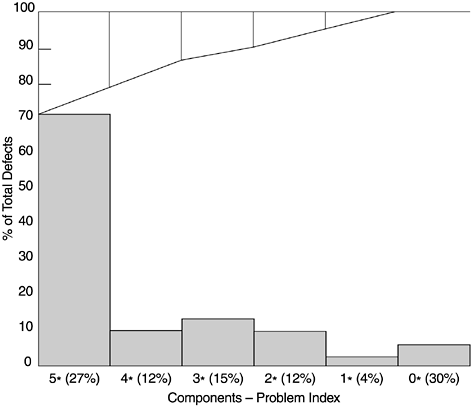
Note: Figure 5.4 is not a Pareto chart in its strict sense because the frequencies are not rank ordered. For a Pareto chart, the frequencies are always in strictly descending order, and the cumulative percentage line is a piecewise convex curve. If we take a two-category view (5* + components versus others), then it is a Pareto chart.
What Is Software Quality?
Software Development Process Models
- Software Development Process Models
- The Waterfall Development Model
- The Prototyping Approach
- The Spiral Model
- The Iterative Development Process Model
- The Object-Oriented Development Process
- The Cleanroom Methodology
- The Defect Prevention Process
- Process Maturity Framework and Quality Standards
Fundamentals of Measurement Theory
- Fundamentals of Measurement Theory
- Definition, Operational Definition, and Measurement
- Level of Measurement
- Some Basic Measures
- Reliability and Validity
- Measurement Errors
- Be Careful with Correlation
- Criteria for Causality
Software Quality Metrics Overview
- Software Quality Metrics Overview
- Product Quality Metrics
- In-Process Quality Metrics
- Metrics for Software Maintenance
- Examples of Metrics Programs
- Collecting Software Engineering Data
Applying the Seven Basic Quality Tools in Software Development
- Applying the Seven Basic Quality Tools in Software Development
- Ishikawas Seven Basic Tools
- Checklist
- Pareto Diagram
- Histogram
- Run Charts
- Scatter Diagram
- Control Chart
- Cause-and-Effect Diagram
- Relations Diagram
Defect Removal Effectiveness
- Defect Removal Effectiveness
- Literature Review
- A Closer Look at Defect Removal Effectiveness
- Defect Removal Effectiveness and Quality Planning
- Cost Effectiveness of Phase Defect Removal
- Defect Removal Effectiveness and Process Maturity Level
The Rayleigh Model
- The Rayleigh Model
- Reliability Models
- The Rayleigh Model
- Basic Assumptions
- Implementation
- Reliability and Predictive Validity
Exponential Distribution and Reliability Growth Models
- Exponential Distribution and Reliability Growth Models
- The Exponential Model
- Reliability Growth Models
- Model Assumptions
- Criteria for Model Evaluation
- Modeling Process
- Test Compression Factor
- Estimating the Distribution of Total Defects over Time
Quality Management Models
- Quality Management Models
- The Rayleigh Model Framework
- Code Integration Pattern
- The PTR Submodel
- The PTR Arrival and Backlog Projection Model
- Reliability Growth Models
- Criteria for Model Evaluation
- In-Process Metrics and Reports
- Orthogonal Defect Classification
In-Process Metrics for Software Testing
- In-Process Metrics for Software Testing
- In-Process Metrics for Software Testing
- In-Process Metrics and Quality Management
- Possible Metrics for Acceptance Testing to Evaluate Vendor-Developed Software
- How Do You Know Your Product Is Good Enough to Ship?
Complexity Metrics and Models
- Complexity Metrics and Models
- Lines of Code
- Halsteads Software Science
- Cyclomatic Complexity
- Syntactic Constructs
- Structure Metrics
- An Example of Module Design Metrics in Practice
Metrics and Lessons Learned for Object-Oriented Projects
- Metrics and Lessons Learned for Object-Oriented Projects
- Object-Oriented Concepts and Constructs
- Design and Complexity Metrics
- Productivity Metrics
- Quality and Quality Management Metrics
- Lessons Learned from OO Projects
Availability Metrics
- Availability Metrics
- 1 Definition and Measurements of System Availability
- Reliability, Availability, and Defect Rate
- Collecting Customer Outage Data for Quality Improvement
Measuring and Analyzing Customer Satisfaction
- Measuring and Analyzing Customer Satisfaction
- Customer Satisfaction Surveys
- Analyzing Satisfaction Data
- Satisfaction with Company
- How Good Is Good Enough
Conducting In-Process Quality Assessments
- Conducting In-Process Quality Assessments
- The Preparation Phase
- The Evaluation Phase
- The Summarization Phase
- Recommendations and Risk Mitigation
Conducting Software Project Assessments
- Conducting Software Project Assessments
- Audit and Assessment
- Software Process Maturity Assessment and Software Project Assessment
- Software Process Assessment Cycle
- A Proposed Software Project Assessment Method
Dos and Donts of Software Process Improvement
- Dos and Donts of Software Process Improvement
- Measuring Process Maturity
- Measuring Process Capability
- Staged versus Continuous Debating Religion
- Measuring Levels Is Not Enough
- Establishing the Alignment Principle
- Take Time Getting Faster
- Keep It Simple or Face Decomplexification
- Measuring the Value of Process Improvement
- Measuring Process Adoption
- Measuring Process Compliance
- Celebrate the Journey, Not Just the Destination
Using Function Point Metrics to Measure Software Process Improvements
- Using Function Point Metrics to Measure Software Process Improvements
- Software Process Improvement Sequences
- Process Improvement Economics
- Measuring Process Improvements at Activity Levels
Concluding Remarks
- Concluding Remarks
- Data Quality Control
- Getting Started with a Software Metrics Program
- Software Quality Engineering Modeling
- Statistical Process Control in Software Development
A Project Assessment Questionnaire
EAN: 2147483647
Pages: 176
