SAMPLING LOW-PASS SIGNALS
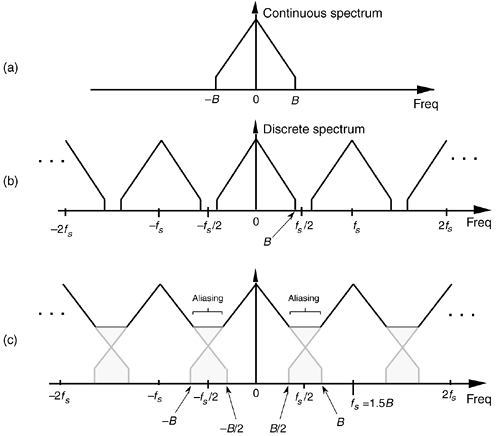
Consider sampling a continuous real signal whose spectrum is shown in Figure 2-4(a). Notice that the spectrum is symmetrical about zero Hz, and the spectral amplitude is zero above +B Hz and below –B Hz, i.e., the signal is band-limited. (From a practical standpoint, the term band-limited signal merely implies that any signal energy outside the range of ±B Hz is below the sensitivity of our system.) Given that the signal is sampled at a rate of fs samples/s, we can see the spectral replication effects of sampling in Figure 2-4(b), showing the original spectrum in addition to an infinite number of replications, whose period of replication is fs Hz. (Although we stated in Section 1.1 that frequency-domain representations of discrete-time sequences are themselves discrete, the replicated spectra in Figure 2-4(b) are shown as continuous lines, instead of discrete dots, merely to keep the figure from looking too cluttered. We'll cover the full implications of discrete frequency spectra in Chapter 3.)
Figure 2-4. Spectral replications: (a) original continuous signal spectrum; (b) spectral replications of the sampled signal when fs/2 > B; (c) frequency overlap and aliasing when the sampling rate is too low because fs/2 < B.

Let's step back a moment and understand Figure 2-4 for all it's worth. Figure 2-4(a) is the spectrum of a continuous signal, a signal that can only exist in one of two forms. Either it's a continuous signal that can be sampled, through A/D conversion, or it is merely an abstract concept such as a mathematical expression for a signal. It cannot be represented in a digital machine in its current band-limited form. Once the signal is represented by a sequence of discrete sample values, its spectrum takes the replicated form of Figure 2-4(b).
The replicated spectra are not just figments of the mathematics; they exist and have a profound effect on subsequent digital signal processing.[ ] The replications may appear harmless, and it's natural to ask, "Why care about spectral replications? We're only interested in the frequency band within ±fs/2." Well, if we perform a frequency translation operation or induce a change in sampling rate through decimation or interpolation, the spectral replications will shift up or down right in the middle of the frequency range of interest ±fs/2 and could cause problems[1]. Let's see how we can control the locations of those spectral replications.
[
] Toward the end of Section 5.9, as an example of using the convolution theorem, another derivation of periodic sampling's replicated spectra will be presented.
In practical A/D conversion schemes, fs is always greater than 2B to separate spectral replications at the folding frequencies of ±fs/2. This very important relationship of fs  2B is known as the Nyquist criterion. To illustrate why the term folding frequency is used, let's lower our sampling frequency to fs = 1.5B Hz. The spectral result of this undersampling is illustrated in Figure 2-4(c). The spectral replications are now overlapping the original baseband spectrum centered about zero Hz. Limiting our attention to the band ±fs/2 Hz, we see two very interesting effects. First, the lower edge and upper edge of the spectral replications centered at +fs and –fs now lie in our band of interest. This situation is equivalent to the original spectrum folding to the left at +fs/2 and folding to the right at –fs/2. Portions of the spectral replications now combine with the original spectrum, and the result is aliasing errors. The discrete sampled values associated with the spectrum of Figure 2-4(c) no longer truly represent the original input signal. The spectral information in the bands of –B to –B/2 and B/2 to B Hz has been corrupted. We show the amplitude of the aliased regions in Figure 2-4(c) as dashed lines because we don't really know what the amplitudes will be if aliasing occurs.
The second effect illustrated by Figure 2-4(c) is that the entire spectral content of the original continuous signal is now residing in the band of interest between –fs/2 and +fs/2. This key property was true in Figure 2-4(b) and will always be true, regardless of the original signal or the sample rate. This effect is particularly important when we're digitizing (A/D converting) continuous signals. It warns us that any signal energy located above +B Hz and below –B Hz in the original continuous spectrum of Figure 2-4(a) will always end up in the band of interest after sampling, regardless of the sample rate. For this reason, continuous (analog) low-pass filters are necessary in practice.
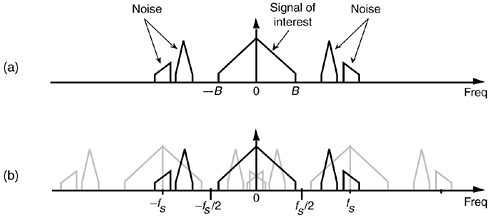
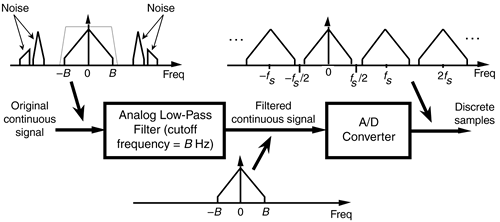
We illustrate this notion by showing a continuous signal of bandwidth B accompanied by noise energy in Figure 2-5(a). Sampling this composite continuous signal at a rate that's greater than 2B prevents replications of the signal of interest from overlapping each other, but all of the noise energy still ends up in the range between –fs/2 and +fs/2 of our discrete spectrum shown in Figure 2-5(b). This problem is solved in practice by using an analog low-pass anti-aliasing filter prior to A/D conversion to attenuate any unwanted signal energy above +B and below –B Hz as shown in Figure 2-6. An example low-pass filter response shape is shown as the dotted line superimposed on the original continuous signal spectrum in Figure 2-6. Notice how the output spectrum of the low-pass filter has been band-limited, and spectral aliasing is avoided at the output of the A/D converter.
Figure 2-5. Spectral replications: (a) original continuous signal plus noise spectrum; (b) discrete spectrum with noise contaminating the signal of interest.

Figure 2-6. Low-pass analog filtering prior to sampling at a rate of fs Hz.

This completes the discussion of simple low-pass sampling. Now let's go on to a more advanced sampling topic that's proven so useful in practice.
 |
Amazon |  |
